Panel 1
Giorgio Cattani, Mariacarmela Cusano, Alessandro Di Menno di Bucchianico, Raffaela Gaddi, Alessandra Gaeta, Giuseppe Gandolfo, Gianluca Leone
The indicator is based on atmospheric ozone (O₃) concentration data measured in 2023 at monitoring stations distributed across the national territory, collected and archived by ISPRA in the InfoAria database, in accordance with Directive 2008/50/EC (and its national transposition, Legislative Decree 155/2010) and Commission Implementing Decision 2011/850/EU. A total of 348 monitoring stations measured and reported ozone data. Of these, 326 provided data series with sufficient temporal coverage to assess compliance with threshold values and the long-term objective (LTO) for the protection of human health.
Suburban, rural, and background rural stations meeting the minimum data coverage required for the calculation of the long-term objective for vegetation protection (AOT40v) numbered 146. The LTO for human health was exceeded at 88.1% of stations. In 43.9% of the stations, this LTO was exceeded for more than 25 days.
The information threshold for health protection was exceeded at 34% of stations, while the alert threshold was exceeded at only 2 stations. The WHO reference level—set at 100 µg/m³ as the 99th percentile of daily maximum 8-hour mean concentrations—was exceeded at 313 stations (96% of those with sufficient data coverage). The long-term objective for vegetation protection (AOT40v) was exceeded at 93.2% of the stations.
Tropospheric ozone is a secondary pollutant formed through photochemical reactions involving primary precursors such as nitrogen oxides (NOₓ) and volatile organic compounds (VOCs). It is the principal component of the complex mixture of substances known as "photochemical smog," which develops in the lower layers of the atmosphere as a result of these processes. Photochemical pollution is not only a local phenomenon but also transboundary in nature, spreading across wide spatial scales; as a result, ozone levels measured in a specific area are not always attributable solely to local emission sources but may be significantly influenced by contributions from surrounding regions.
The highest ozone concentrations are typically observed during the warmest months of the year and during periods of maximum solar radiation. In urban areas, ozone forms and reacts rapidly, exhibiting highly complex behavior that differs substantially from that of other pollutants. The main anthropogenic sources of ozone precursors include road transport, residential heating, and energy production.
The indicator was developed using ozone concentration data measured at monitoring stations across the national territory, collected and archived by ISPRA in the InfoAria database in accordance with Commission Implementing Decision 2011/850/EU. In addition to metrics for comparison with information and alert thresholds, and with long-term objective values for the protection of human health and vegetation established by the reference legislation (Legislative Decree 155/2010), as well as WHO guideline values for human health protection (WHO-AQG, 2021), the following statistics were calculated: mean, 5th, 25th, 50th, 75th, 95th, and 99.8th percentiles, and maximum of hourly mean concentrations.
Fornire informazioni sullo stato della qualità dell'aria attraverso i parametri statistici calcolati a partire dai dati di concentrazione dell’ozono nell'aria ambiente, la verifica del rispetto dei valori limite previsti dalla normativa e il confronto con i valori di riferimento stabiliti dall’OMS.
Directive 2008/50/EC of the European Parliament and of the Council of 21 May 2008 on ambient air quality and cleaner air for Europe.
Legislative Decree 155/2010 – Legislative Decree of 13 August 2010, No. 155, implementing Directive 2008/50/EC on ambient air quality and cleaner air for Europe (Official Gazette No. 216 of 15/09/2010 – Ordinary Supplement No. 217 – in force since 30/09/2010)
Commission Implementing Decision 2011/850/EU of 12 December 2011 – establishing provisions for the implementation of Directives 2004/107/EC and 2008/50/EC of the European Parliament and of the Council with regard to the reciprocal exchange and reporting of ambient air quality information.
The objective of Directive 2008/50/EC is to enable the assessment of ambient air quality on a harmonized basis, to obtain information on air quality status in order to combat atmospheric pollution, to ensure public availability of such information, and to promote cooperation among Member States.
Legislative Decree 155/2010, which transposes the directive into national law, also aims to enable regional and autonomous provincial authorities to assess and manage ambient air quality. The limit values established by Legislative Decree 155/2010 represent the air quality objectives to be pursued in order to avoid, prevent, and reduce harmful effects on human health and the environment. The WHO reference values provide guidance for minimizing the impact of air pollution on human health.
The information and alert thresholds, the objectives, and the long-term target values for the protection of human health and vegetation with respect to ozone in ambient air, as set out in Legislative Decree 155/2010 and the WHO reference values, are reported in Table A.
Panel 2
ISPRA, Annuario dei dati ambientali, various editions
SNPA, 2024, La qualità dell'aria in Italia. Ed. 2023
WHO global air quality guidelines. Particulate matter (PM2.5 and PM10), ozone, nitrogen dioxide, sulfur dioxide and carbon monoxide. Geneva: World Health Organization; 2021.
Data quality assessment
Autonomous Provinces
Regions
SNPA (National System for Environmental Protection)
Database InfoAria - ISPRA
National;
Regional (20/20);
Provincial (99/110);
Municipal (299/8047)
2014-2023
Indicator assessment
The indicator is based on ozone concentration data measured at monitoring stations distributed across the national territory, collected and archived by ISPRA in the InfoAria database, in accordance with Commission Implementing Decision 2011/850/EU. Parameters were calculated for comparison with the information and alert thresholds, as well as with the long-term objectives and target values for the protection of human health and vegetation established by the reference legislation (Legislative Decree 155/2010). All parameters were calculated in accordance with European standards and verified by Regions, Autonomous Provinces, and the regional/provincial environmental protection agencies (ARPA/APPA).
The number of exceedance days corresponds to the number of days in which at least one exceedance of the thresholds or objectives listed in Table A was recorded. Exceedances relevant to human health protection and related statistical parameters were calculated for all urban, suburban, rural (aggregating rural and near-city rural types), and background rural stations (aggregating remote rural and regional rural types), following the macroscale siting criteria specified in Annex VIII of Legislative Decree 155/2010.
Compliance with the long-term objective for vegetation protection (AOT40v) was assessed for all suburban, rural, and background rural stations. The data used for this evaluation were required to have a minimum 90% coverage during the defined period for AOT40v calculation (May to July, from 8:00 to 20:00).
The trend analysis for the period 2014–2023 was carried out using the Mann-Kendall method corrected for seasonality. Implementing a deseasonalization procedure minimizes the influence of interannual fluctuations relative to the average seasonal cycle, reveals the presence of underlying trends, quantifies their statistical significance, and estimates changes in annual mean concentrations over the observation period.
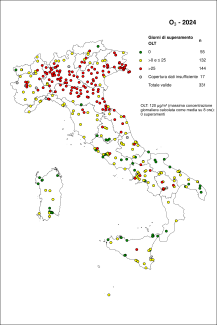
In 2023, the long-term objective (LTO) for the protection of human health was exceeded at 287 out of 326 stations, corresponding to 88.1% of stations with sufficient temporal coverage, as defined by Annex I of Legislative Decree 155/2010. The LTO was exceeded for more than 25 days at 143 stations (43.9%, Figure 2). The 39 stations where no LTO exceedance was recorded were located in urban, suburban, and rural settings.
The target value for health protection was exceeded at 168 out of 343 stations with sufficient data coverage, based on the three-year average criteria specified in Annex I of Legislative Decree 155/2010.
The information and alert thresholds were exceeded at 111 stations (34%) and 2 stations, respectively, out of 326 (Table 1).
The WHO guideline value for the long-term protection of human health—defined as the 99th percentile of daily maximum 8-hour mean concentrations at 100 µg/m³—was exceeded at 313 out of 326 stations (96%).
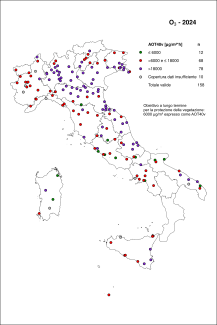
The long-term objective for vegetation protection (AOT40v) was exceeded at 136 out of 146 stations (93.1%), with values significantly higher than the regulatory threshold of 6,000 µg/m³·h (Table 2 – Figure 3).
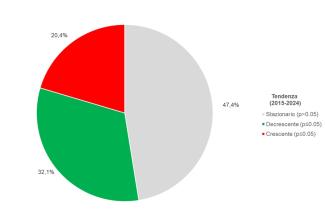
From the statistical analysis conducted using the Mann-Kendall method corrected for seasonality, it was found that at 43% of the stations (141 out of 326), no statistically significant trend could be identified. The underlying trend appears to be essentially monotonic, with interannual variations attributed to natural fluctuations in the seasonal component. Consequently, the null hypothesis (no trend) could not be rejected at the 95% confidence level.
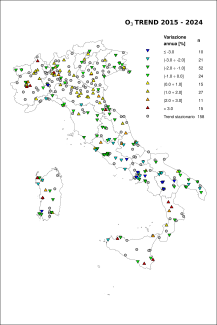
In contrast, a statistically significant increasing trend was observed in 36% of the cases (117 monitoring stations out of 326), with an estimated average annual increase of 1.1 µg/m³ per year [0.5 µg/m³y to 3.5 µg/m³y]. Among the subset of stations showing a statistically significant upward trend, the mean annual relative increase was 1.6% [0.4% to 6.3%] (Table 4, Figures 4 and 5).
Data
Tabella A: O3 - Soglia di informazione, soglia di allarme, obiettivo a lungo termine e valore obiettivo per la protezione della salute umana e per la protezione della vegetazione ai sensi del D.Lgs. 155/2010 e valori di riferimento OMS
D.Lgs.155/2010; OMS, WHO global air quality guidelines 2021
Figura 4: O3 - Distribuzione sul territorio delle stazioni analizzate e variazione percentuale media annua stimata della concentrazione. Fonte Elaborazione ISPRA su dati SNPA Note Risultati dell’analisi del trend (2015-2024) con il test di Kendall su un campione di 333 stazioni.
Elaborazione ISPRA su dati SNPA
Risultati dell’analisi del trend (2015-2024) con il test di Kendall su un campione di 333 stazioni.
Figura 5: O3 - Distribuzione percentuale delle stazioni di monitoraggio in base all’andamento del trend osservato nel periodo 2015 - 2024
Elaborazione ISPRA su dati SNPA
p≤ 0,05: il trend osservato è statisticamente significativo;
p>0,05: non può essere esclusa l'ipotesi nulla (assenza di trend)
Sintesi dei risultati dell’analisi del trend (2015 - 2024) con il test di Kendall corretto per la stagionalità delle concentrazioni di O3 in Italia su una selezione di 333 stazioni di monitoraggio distribuite sul territorio nazionale
Tabella 1: O3 - Stazioni di monitoraggio: dati e parametri statistici per la valutazione della qualità dell'aria (2024).
Elaborazione ISPRA su dati SNPA
¹ Tipo di area: U=URBANA, S=SUBURBANA, R=RURALE
² Tipo di stazione: T=TRAFFICO; F=FONDO; I=INDUSTRIALE
3 In grassetto sono riportati i dati con copertura sufficiente nel rispetto dei criteri dell'Allegato I, D.Lgs.155/2010
4 "--" valore non calcolato per copertura dati insufficiente come media su 3 anni secondo i criteri dell'Allegato I, D.Lgs.155/2010
5 Flag=1 per serie con almeno il 90% di dati validi in estate e il 75% di dati validi in inverno al netto delle perdite dovute alla taratura periodica o alla manutenzione ordinaria (in accordo ai criteri dell'Allegato I, D.Lgs.155/2010); Flag=0 per copertura dati insufficiente o mancanza di dati validi
6 Flag=1 per serie con almeno 5 mesi estivi su 6 con verifica di 27 valori giornalieri disponibili al mese (in accordo ai criteri dell'Allegato VII, D.Lgs.155/2010); Flag=0 per copertura dati insufficiente o mancanza di dati validi
"-” valore non calcolato per mancanza di dati validi
Tabella 2 - O3: Stazioni di monitoraggio: dati per la valutazione dell'obiettivo a lungo termine e del valore obiettivo per la protezione della vegetazione (2024)
Elaborazione ISPRA su dati SNPA
"1" in grassetto sono riportati i valori che rispettano i criteri dell'Allegato VII per il calcolo dell'AOT40 (90% dei valori di 1 ora nel periodo di tempo definito per il calcolo dell'AOT40)
"2" AOT40v corretto secondo quanto previsto dall'Allegato VII, D.Lgs.155/2010
Tabella 3 - O3: Verifica della presenza di superamenti dell'obiettivo a lungo termine ai sensi del D.Lgs.155/2010 (2024)
Elaborazione ISPRA su dati SNPA
zona: parte del territorio nazionale delimitata, ai sensi del D.Lgs 155/2010, ai fini della valutazione e della gestione della qualità dell'aria ambiente;
agglomerato: zona costituita da un'area urbana o da un insieme di aree urbane che distano tra loro non più di qualche chilometro oppure da un'area urbana principale e dall'insieme delle aree urbane minori che dipendono da quella principale sul piano demografico, dei servizi e dei flussi di persone e merci, avente: 1) una popolazione superiore a 250.000 abitanti oppure; 2) una popolazione inferiore a 250.000 abitanti e una densità di popolazione per km2 superiore a 3.000 abitanti;
Superamento valore obiettivo e obiettivo a lungo termine (OLT): Si intende superato qualora sia stato determinato il superamento in almeno una stazione di monitoraggio collocata nel territorio della zona.
Max media annua: valore più alto della media annuale registrato nella zona.
Tabella 4 – O3. Analisi dei trend per stazione di monitoraggio (2015-2024)
Elaborazione ISPRA su dati SNPA
p≤ 0,05: il trend osservato è statisticamente significativo;
p>0,05: non può essere esclusa l'ipotesi nulla (assenza di trend) ;
Δy: variazione media annuale stimata sulla base dei risultati del test di Kendall corretto per la stagionalità
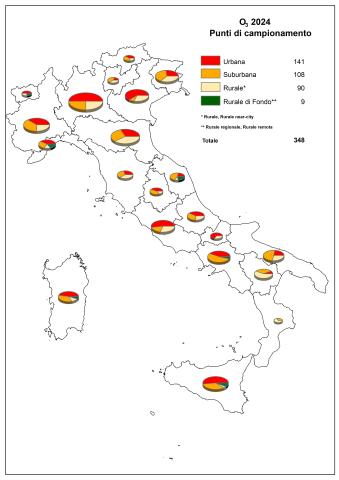
In 2023, a total of 348 monitoring stations measured and reported ozone (O₃) data relevant to the protection of human health (Table 1). Of these, 326 stations (93.7%) provided data series with sufficient temporal coverage for verifying threshold values and the long-term objective (LTO) for human health protection. For vegetation protection (AOT40v), 146 out of 173 suburban, rural, and background rural stations met the minimum data coverage requirements (Table 2).
The classification of O₃ monitoring stations according to the macroscale siting criteria defined by legislation is shown in Figure 1, with a predominance of urban sites.
The entire national territory is divided into zones and agglomerations for ambient air quality assessment purposes, in accordance with Legislative Decree 155/2010. Unlike other pollutants, ozone zones are not classified by threshold levels. However, it is required to indicate whether exceedances of the long-term objective have occurred in the previous five years, as this determines whether the number of ozone monitoring stations may be reduced, in accordance with Annex IX, point 4 of Legislative Decree 155/2010.
If the long-term objective is exceeded at even one monitoring station within a given year, the entire zone is considered in exceedance.
In 2023, exceedances of the long-term objective for human health protection were recorded in 64 out of 67 zones (Table 3).