Piero Fraschetti, Francesca Lena, Walter Perconti, Emanuela Piervitali, Giulio Settanta
The indicator describes the amount and spatial distribution of precipitation in Italy. In 2024, total annual precipitation in Italy was about 8% higher than the average value for the reference period 1991–2020. Northern and north-central areas were characterised by positive anomalies, while most of the remaining part of the country recorded widespread negative anomalies.
Precipitation is one of the key variables characterising the climate of a specific geographical area. Cumulative precipitation over a given time period represents the total amount of rainfall that occurred during that period.
The variation of precipitation compared to long-term normal values is assessed through the calculation of anomalies, defined as the percentage differences between the values recorded in a given year and the long-term average over the 1991–2020 reference period.
The annual time series of cumulative precipitation anomalies, expressed as deviations from a climatological baseline, enables the estimation of long-term precipitation trends.
Understanding the temporal evolution of precipitation is crucial for assessing ongoing climate change trends and serves as a fundamental basis for developing appropriate climate change adaptation strategies and actions.
The indicator has no direct links to regulatory or legislative frameworks.
Braca, G., Mariani, S., Lastoria, B., Tropeano, R., Casaioli, M., Piva, F., Marchetti, G., e Bussettini, M., 2024: Bilancio idrologico nazionale: stime BIGBANG e indicatori sulla risorsa idrica. Aggiornamento al 2023. Rapporti n. 401/2024, ISPRA, Roma;
Braca, G., Bussettini, M., Lastoria, B., Mariani, S., e Piva, F., 2021: Il Bilancio Idrologico Gis BAsed a scala Nazionale su Griglia regolare – BIGBANG: metodologia e stime. Rapporto sulla disponibilità naturale della risorsa idrica. Rapporti n. 339/21, Roma;
ISPRA, 2022, I normali climatici 1991-2020 di temperatura e precipitazione in Italia - Stato dell'Ambiente 99/2022
ISPRA, 2016, Analisi statistica degli estremi di precipitazione in Italia - Stato dell'Ambiente 51/2014
ISPRA, 2015, Valori climatici normali di temperatura e precipitazione in Italia - Stato dell'Ambiente 55/2015
ISPRA, 2013, Variazioni e tendenze degli estremi di temperatura e precipitazione in Italia - Stato dell'Ambiente 37/2013
ISPRA, 2012, Elaborazione delle serie temporali per la stima delle tendenze climatiche - Stato dell'Ambiente 32/2012
Jones P.D. e Hulme M., 1996, Calculating regional climatic series for temperature and precipitation: methods and illustrations, Int. J. of Climatol., 16, 361-377;
SNPA, 2025, Il clima in Italia nel 2024 - Report ambientali SNPA n. 44/2025
Toreti A., Fioravanti G., Perconti W., Desiato F., 2009, Annual and seasonal precipitation over Italy from 1961 to 2006, International Journal of Climatology, DO I: 10.1002/joc.1840
Precipitation is a variable characterized by significant spatial variability. For this reason, the availability of a large number of monitoring stations meeting the requirements of time series duration, completeness, and continuity is essential to ensure the full reliability of precipitation estimates.
Improvements in the estimation of cumulative precipitation in Italy could result from the extension of the indicator calculation system to include additional data sources. This would enhance the availability of historical precipitation series that meet the requirements of duration, continuity, and completeness of time series.
ISPRA
Most of the precipitation data used are collected and published by regional and provincial authorities, which, under Article 92 of Legislative Decree No. 112 of 31 March 1998, were assigned the functions and responsibilities previously held by the peripheral offices of the former National Hydrographic and Mareographic Service (SIMN, now integrated into ISPRA) of the Department for National Technical Services.
The precipitation data used for the development of the indicator can be accessed through the websites of the respective authorities or upon request. Data are aggregated on a monthly scale on the regular 1 km BIGBANG grid, which covers the entire national territory, and are available on ISPRA’s Groupware portal at: https://groupware. sinanet. isprambiente. it/bigbang-data/library/bigbang_90.
National
1961-2024
The indicator is calculated based on the assessment of precipitation over a regular 1 km grid covering the entire national territory, using data recorded by rain gauge monitoring stations. The spatial interpolation method applied is the Natural Neighbor technique, as implemented in the BIGBANG (Hydrological Balance GIS-Based Model on a National Regular Grid), version 9.0, developed and implemented by ISPRA within a GIS environment.
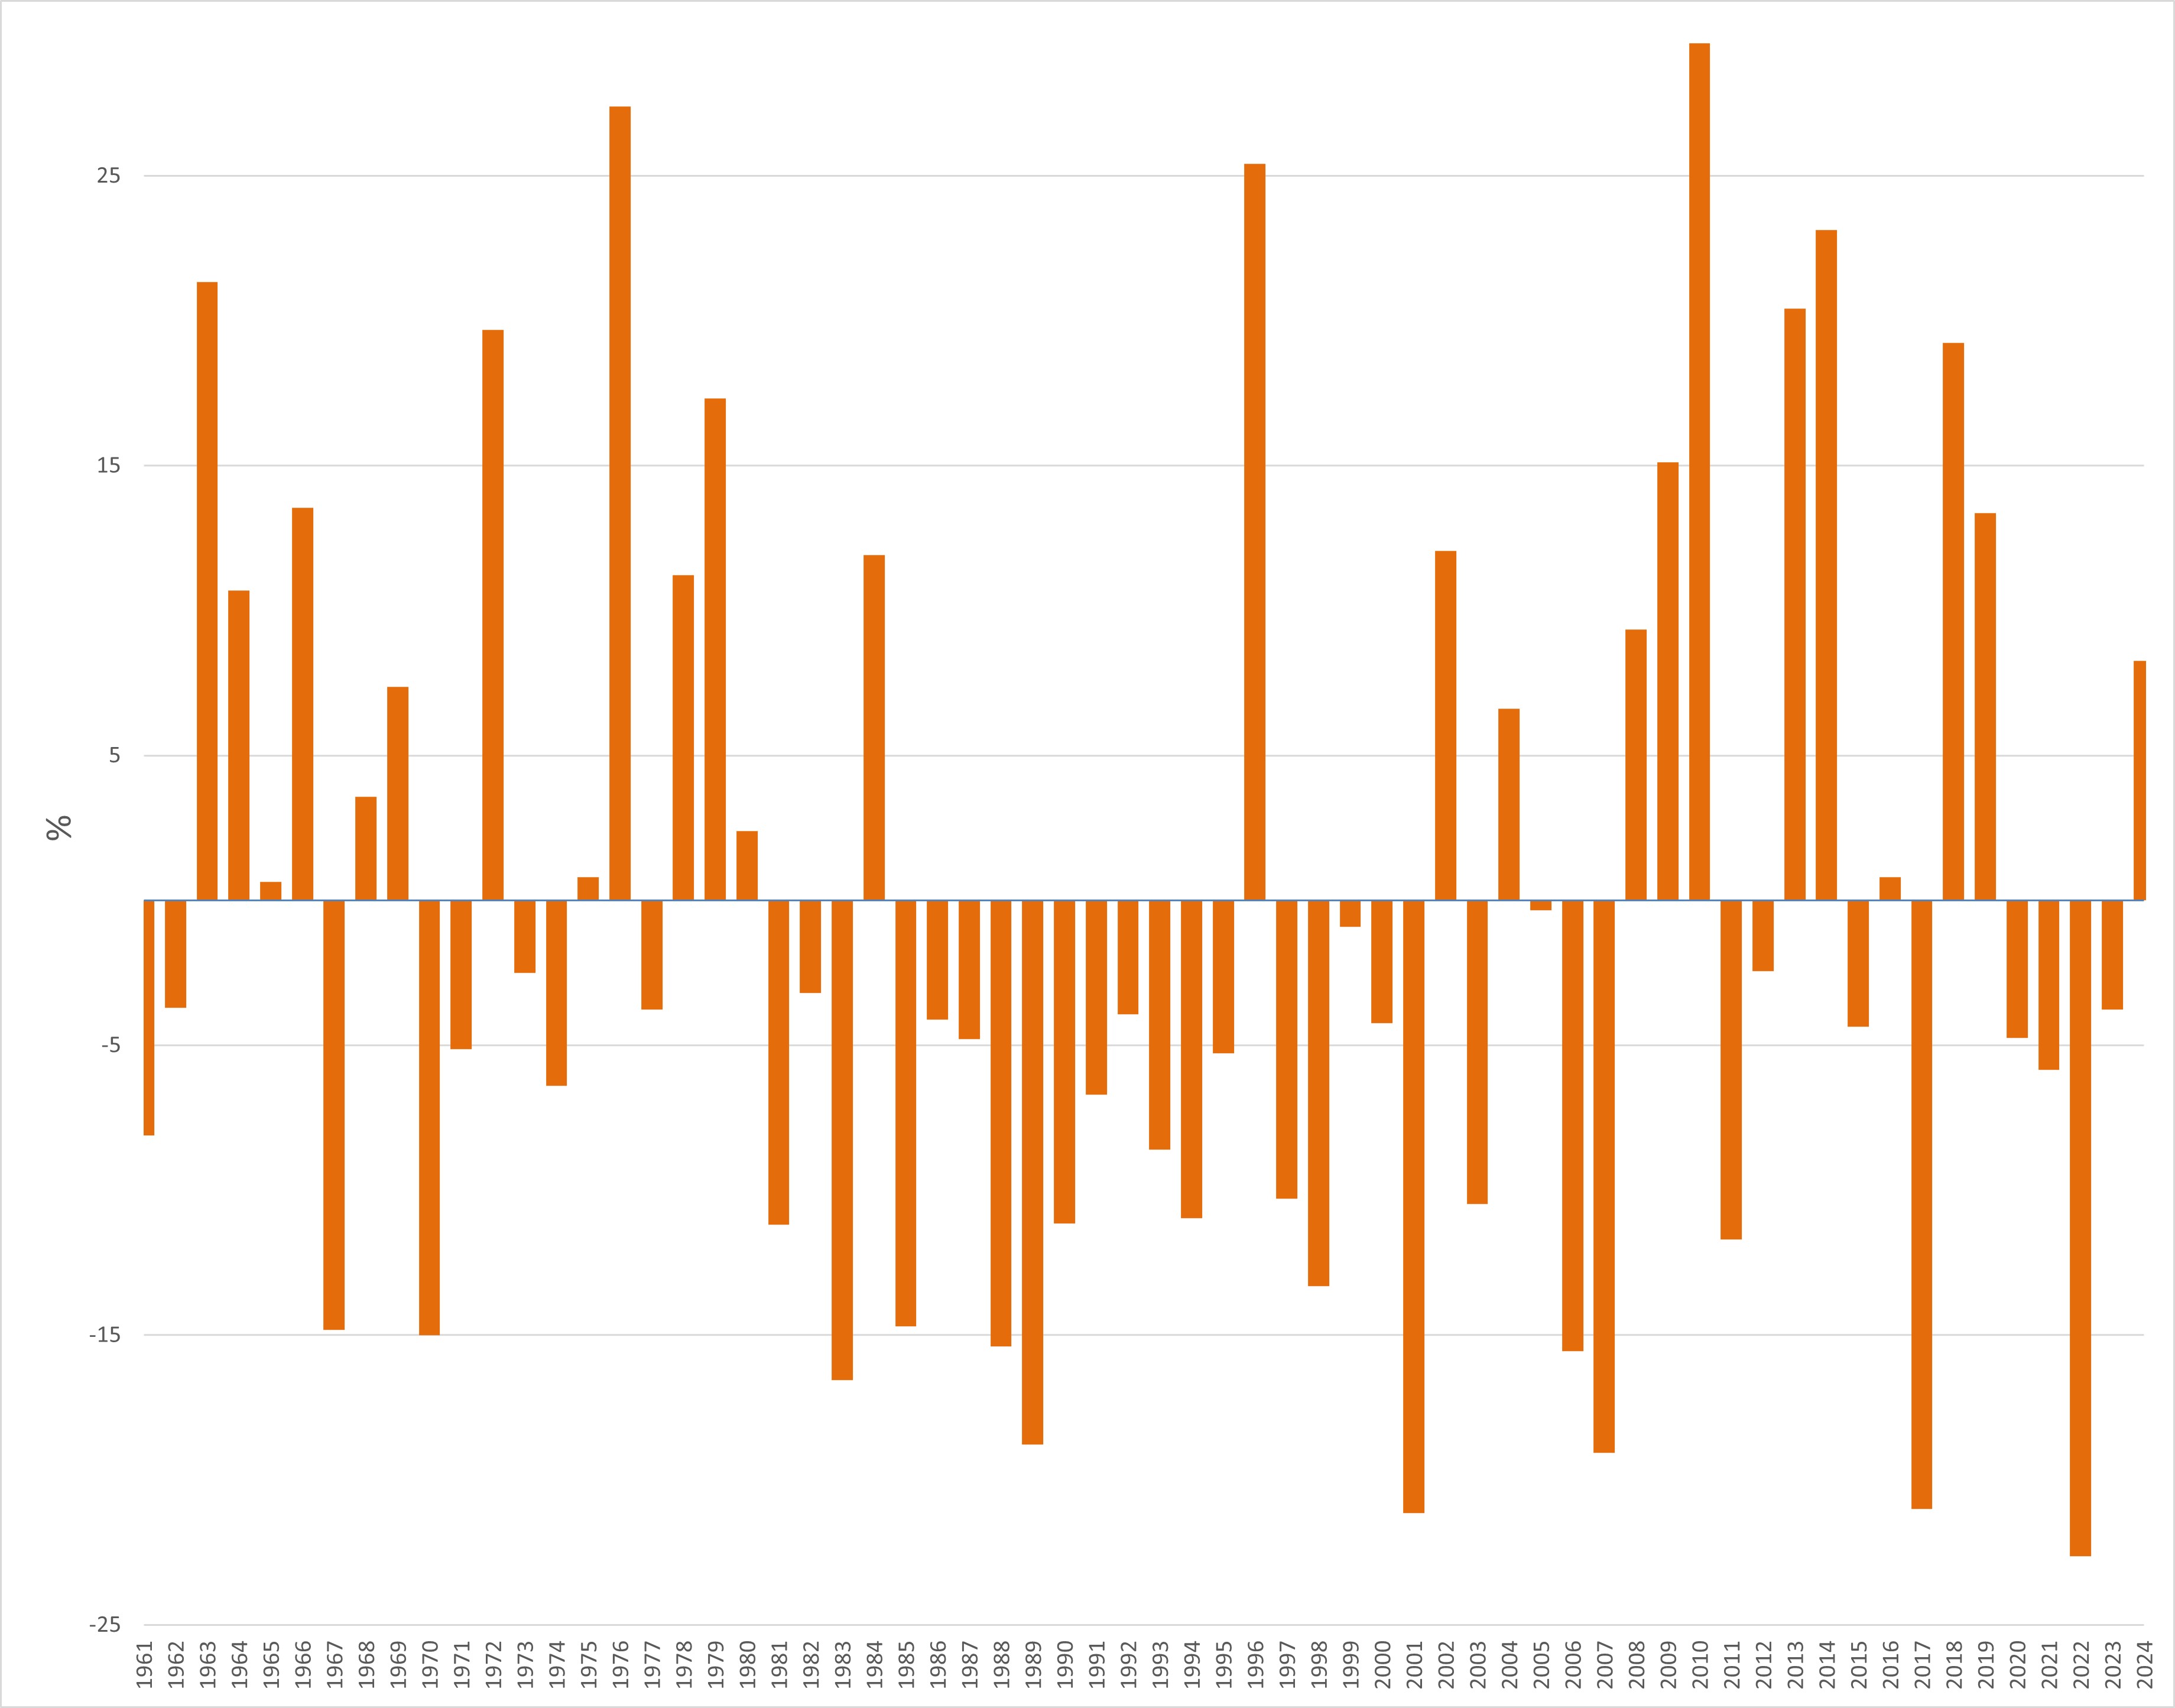
In 2024, total annual precipitation in Italy was approximately 8% higher than the 1991–2020 climatological average (Figure 1).
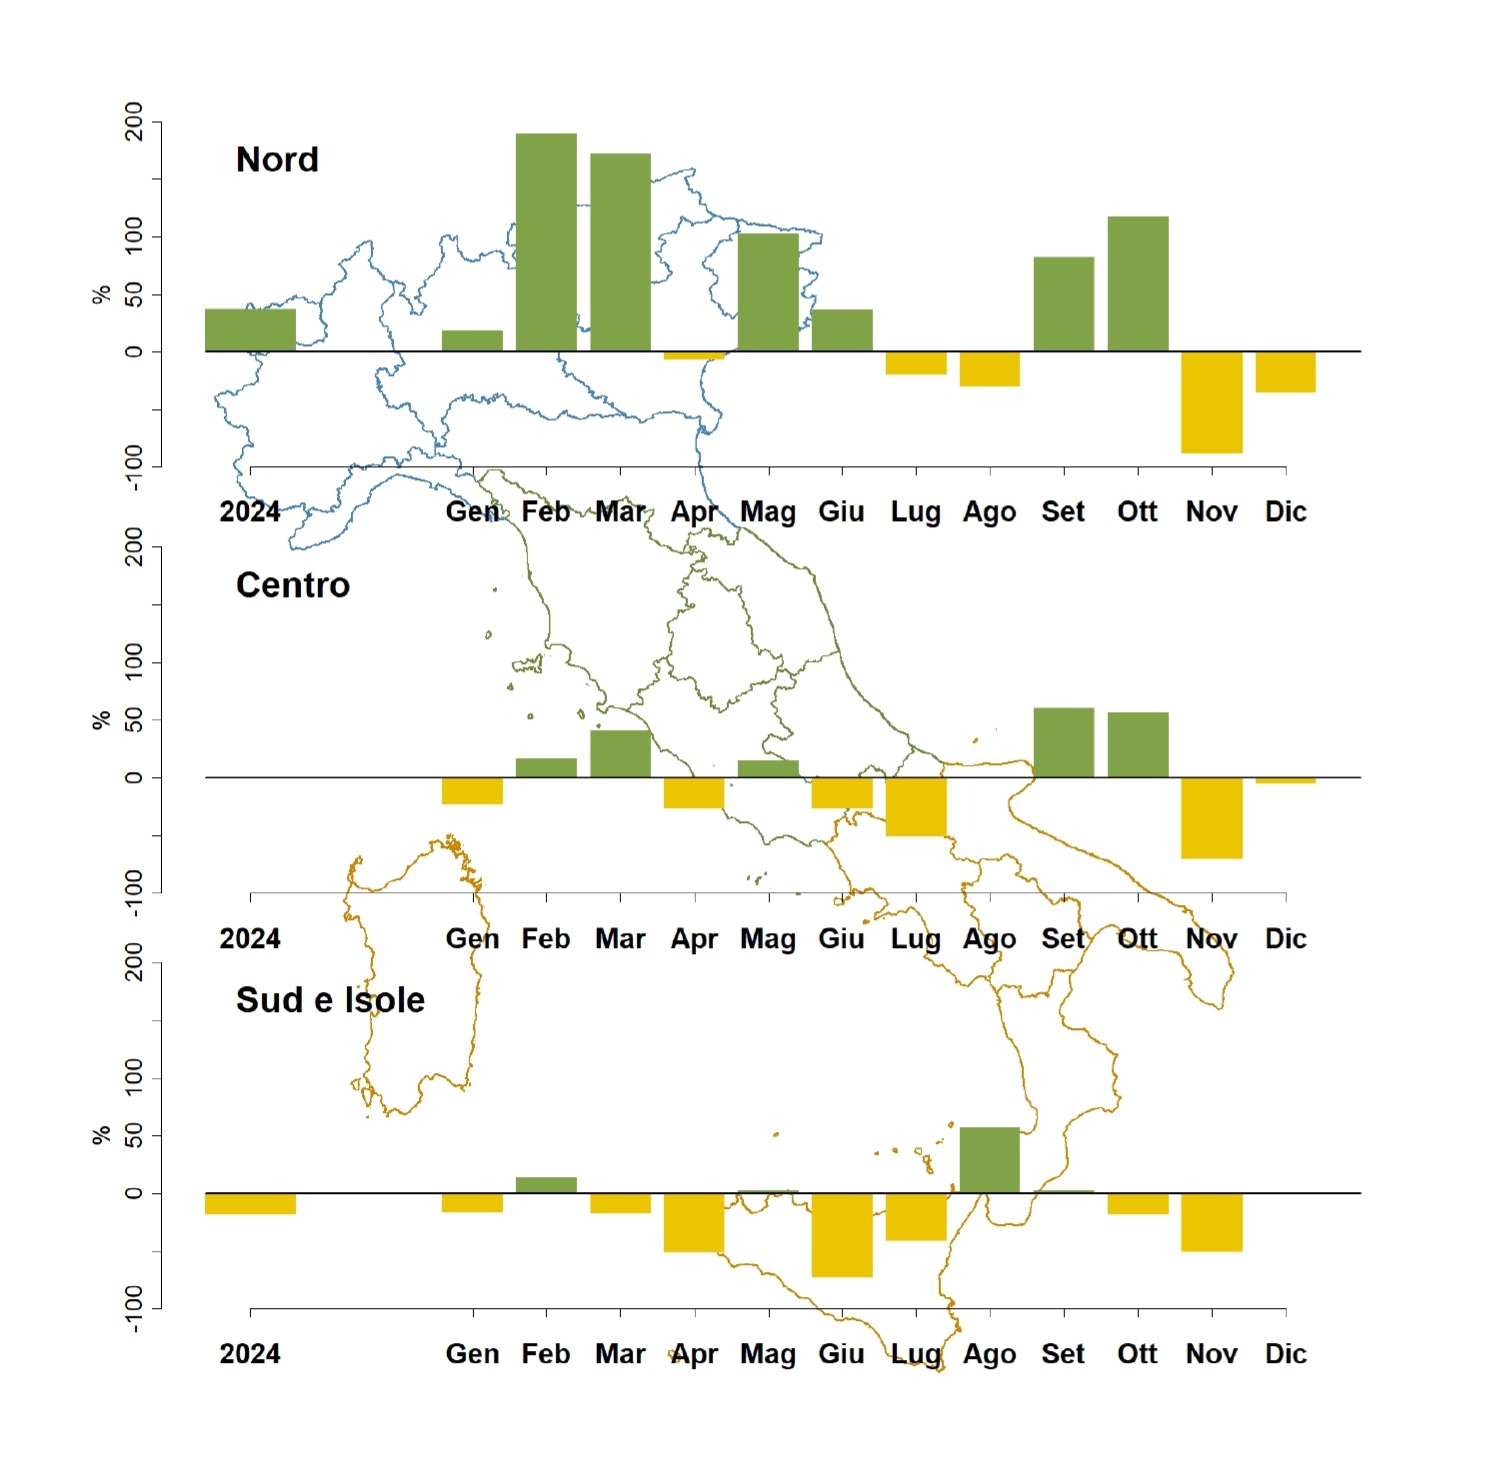
The analysis by geographical macro-areas shows that precipitation anomalies were negative in the South and Islands (–18%), positive in the North (+38%)—where 2024 was the second wettest year since 1961—and close to the average in Central Italy (Figure 2).
The time series of cumulative precipitation, both on an annual and seasonal basis, calculated using a linear regression model, for Italy (Figure 1) and the macro-regions (North, Centre, South, and Islands), do not show any significant trend (at the 5% significance level) for the period examined (1961-2024).
| Allegati |
|---|
Thumbnail
Titolo
Figure 1: Time series of annual mean anomalies in cumulative precipitation in Italy relative to the 1991-2020 normal valure Fonte
ISPRA |
Thumbnail
Titolo
Figure 2: Monthly and annual mean anomaly for 2024, expressed as percentage values, of cumulative precipitation in Northern, Central, and Southern Italy and the Islands, relative to the 1991–2020 climatological norm. Fonte
ISPRA |
The time series of average annual precipitation anomalies (expressed as percentages) for the period 1961–2024, relative to the 1991–2020 reference mean, shows that 2024 was among the years with above-average precipitation compared with the climatological mean (Figure 1).
As shown in Figure 2, 2024 was characterised by alternating monthly positive and negative anomalies throughout the year. Precipitation was below average across the country in April, July and November, and above average in February, May and September. The most pronounced anomalies occurred in northern Italy, with positive deviations in February (+190%) and March (+172%), and a strong negative deviation in November (–88%). In central Italy, anomalies ranged from –70% (November) to +60% (September), while in southern Italy and the islands they ranged from –73% (June) to +57% (August), with predominantly negative anomalies.