Cristina Frizza
In 2024, Domestic Material Consumption in Italy stood at 486 million tonnes (-0.7% compared to 2023), while Resource Productivity grew to 3.76 euro/kg (+1.4%), confirming an improvement in the efficiency of the use of natural resources.
Domestic Material Consumption (DMC; the internationally known English acronym is DMC) is the main indicator derived from the EW-MFA (Economy-Wide Material Flow Accounts) module of physical environmental accounts.
DMC measures the amount of materials directly used in an economic system and is calculated by subtracting “Exports” from “Direct material input” (equal to “Domestic extraction of used materials” plus “Imports”). It corresponds to the amount of materials that at the end of the reference period become part of the material stock of an economy (waste in controlled landfills; capital goods, such as buildings, infrastructures and machinery; durable consumer goods) or that have been transformed into residual materials that return to the environment (emissions into air, water and soil; dissipative uses of products and losses).
DMC is in turn used to build the efficiency indicator “Resource Productivity”, which calculates the relationship between economic activity and the consumption of natural resources. Resource Productivity, defined as the ratio between Gross Domestic Product and Domestic Material Consumption, is one of the main indicators used for monitoring circular economy policies.
The purpose is to monitor the objective of sustainable consumption and production and the occurrence of decoupling between the use of natural resources and economic activity.
Regulation (EU) No. 691/2011 of the European Parliament and of the Council of 6 July 2011 on European environmental economic accounts.
Economy-wide material flow accounts. Handbook, 2018 edition. Eurostat, Luxembourg, 2018 (https://ec.europa.eu/eurostat/web/products-manuals-and-guidelines/-/KS-GQ-18-006) System of Environmental-Economic Accounting 2012 - Central Framework. United Nations, New York, 2014 (https://seea.un.org/content/seea-central-framework)
The material flows of imports and exports refer to goods traded in international trade. Therefore, DMC does not include indirect material flows associated with international trade; such flows are calculated within the framework of material flows in raw material equivalents.
Eurostat
Database di Eurostat:
Material flow accounts - https://ec.europa.eu/eurostat/databrowser/view/env_ac_mfa/default/table?lang=en
Resource productivity - https://ec.europa.eu/eurostat/databrowser/view/env_ac_rp/default/table?lang=en
Na
1995-2024
The indicators derived from material flow accounts (EW-MFA) provide information on all physical exchanges between the anthroposphere and the natural environment, with the exception of water and air used as such (i.e. not incorporated in products or residues, such as water used for irrigation in agriculture, or air used for cooling of industrial plants).
Such exchanges are expressed in mass terms and the aggregates are composed exclusively of physical quantities measured in weight. The classification of materials concerning the flows of resource extraction, imports and exports is divided into four main categories of materials (“biomass”, “metal ores”, “non-metallic minerals”, “fossil fuels”), to which the categories “other products” and “waste” must be added, which apply only to trade flows. EW-MFA are part of the environmental accounts developed by the European Statistical System in consistency with the fundamental concepts and frameworks of national economic accounting and with the guidelines adopted by international organizations for the development of an integrated environmental and economic accounting system. It is an approach: i) multi-scale, as it is possible to carry out analyses at both the macro level (entire economy) and the meso level (economic activity); ii) multi-dimensional, as it integrates the economic and environmental dimension.
In 2024 Italy records a Domestic material consumption per capita of 8.2 tonnes, clearly lower than the European average (13.4 tonnes), and a Resource productivity equal to 3.76 euro/kg, higher than the EU figure (2.36 euro/kg), showing a better performance compared to the European context.
Between 1995 and 2024, against a GDP growth of 22%, Domestic material consumption decreased by 31%, leading to an increase in Resource productivity of over 77% (equal to +1.6 euro/kg). The trend shows an overall improvement, while still displaying a strong dependence on economic dynamics, with the exception of the marked decline in DMC observed between 2006 and 2013 (Table 1, Figure 1).
| Allegati |
|---|
Titolo
Table 1: Resource productivity and its components Fonte
Eurostat |
Titolo
Table 2: Domestic material consumption and its components Fonte
Eurostat |
Titolo
Table 3: Dependence on imports Fonte
Processing by ISPRA based on Eurostat data Note
The indicator is constructed as the ratio between imports in physical units and the direct material input, by material category. |
Thumbnail
Titolo
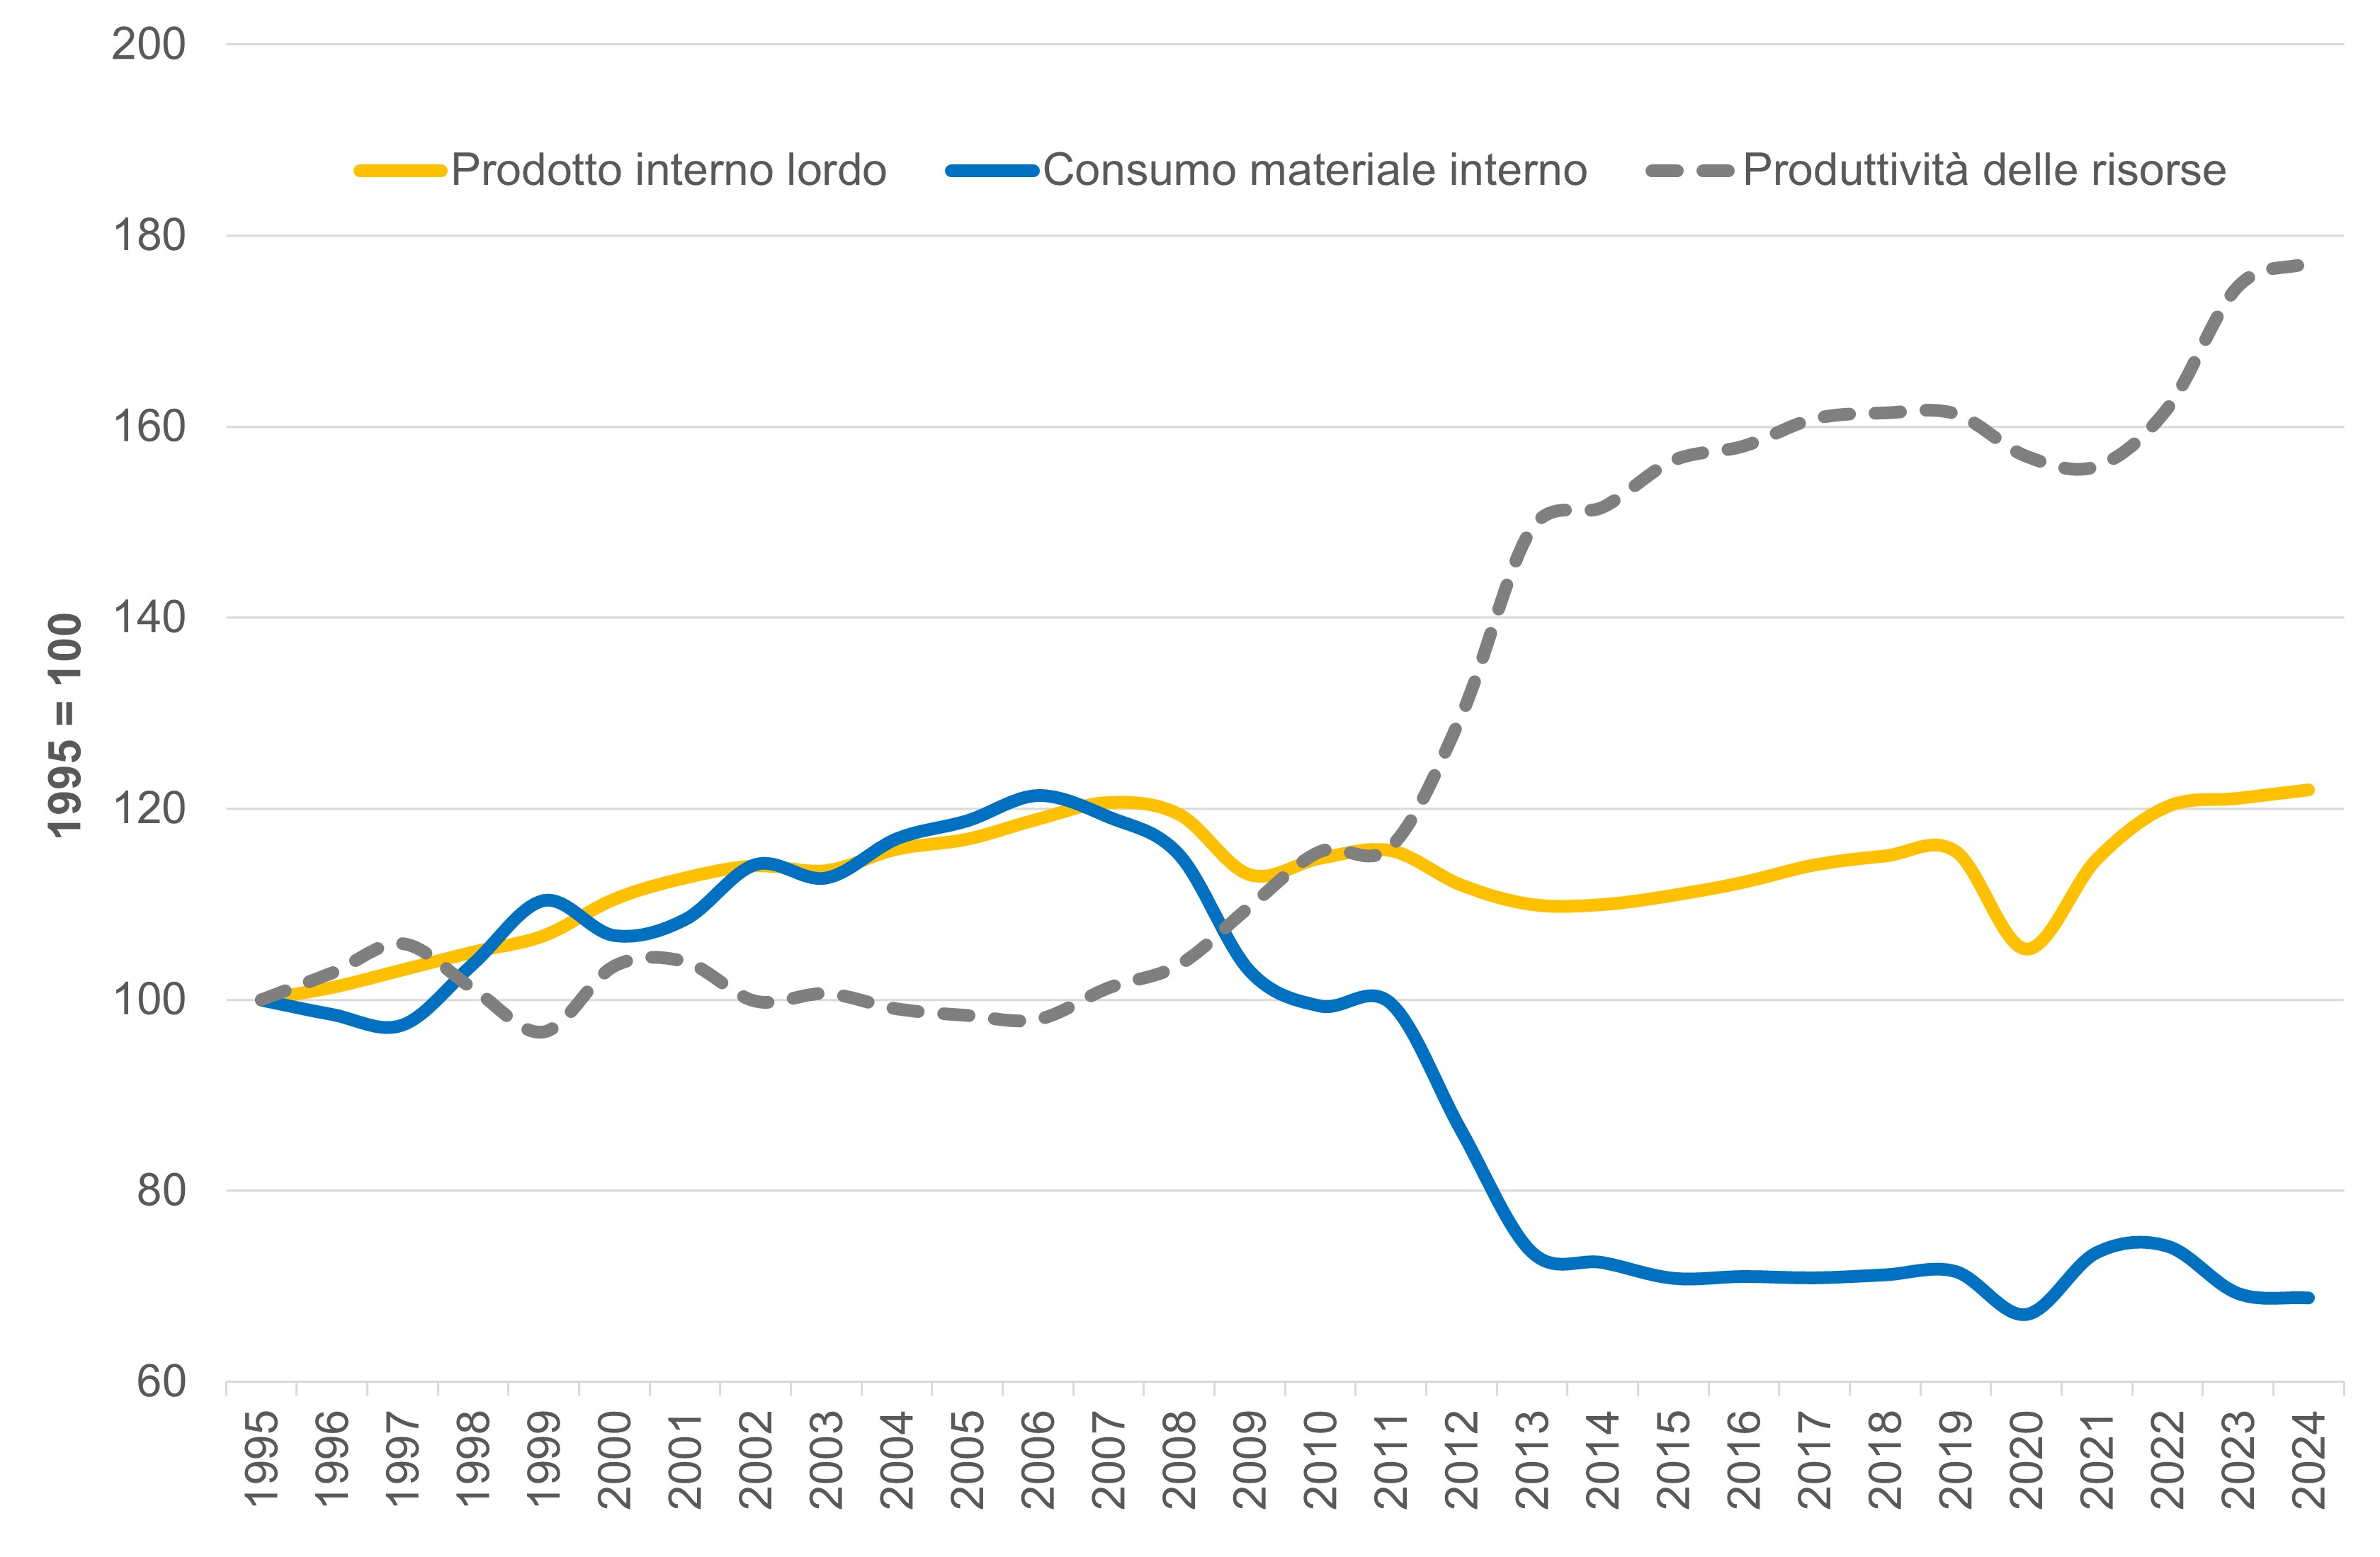
Figure 1: Resource productivity Fonte
Processing by ISPRA based on Eurostat data |
From 1995 to 2024, Resource productivity in Italy increases overall by 77%, rising from about 2.1 euro/kg to values close to 3.7 euro/kg. The trend, however, has not been linear: after a long phase of stability until 2007, productivity grows significantly in the following years, reaching 3.2 euro/kg in the two-year period 2013–2014 and 3.4 euro/kg between 2017 and 2019, before undergoing a temporary decline linked to the pandemic crisis, and then returning to higher values in 2022 (Figure 1, Tables 1–2). The joint analysis of GDP and Domestic material consumption (DMC) highlights three distinct phases: until 2006 and after 2013 the two variables are strongly coupled, while in the central period (2006–2013) the drop in DMC – largely attributable to non-metallic minerals – amplifies the effects of the economic crisis, leading to a significant growth in resource productivity.
The dynamics of the components of DMC allow for a further deepening of the picture (Table 2). In the period 1995–2024 Italian exports grow by 49%, with an overall positive though not uniform trend. Imports, instead, show a trajectory closer to that of domestic extraction: both reach a peak in 2007 and then decrease, reflecting the structural transformations of the national economic and production system.
The issue of dependence on foreign sources plays a central role (Table 3). Between 1995 and 2024 the share of imported materials in the total direct material input grows from 35.6% to 46.6%. Italy proves to be self-sufficient only for construction materials, while dependence on imports is increasing for biomass (from 25% to about 40%) and is almost total for metal ores and fossil fuels. This picture underlines how, despite progress in resource productivity, the Italian economic system remains strongly exposed to the dynamics of international raw materials markets.