Saverio Devoti, Matteo Marasco, Sara Morucci, Arianna Orasi
Upwelling is a physical phenomenon due to the action of wind and currents which can generate a rising current, oriented offshore and orthogonal to the coast.
This phenomenon has a notable impact on the local fish fauna and is therefore of great interest. The identification of the most favorable areas for the generation of this phenomenon was carried out using the wind speed and direction data provided by the National Mareographic Network (RMN) managed by ISPRA. These appropriately processed data allow us to identify the coastal areas that are most likely to be more exposed to the upwelling phenomenon such as, for example, the Carloforte area in Sardinia which is confirmed to be among the most favorable to the generation of this variable.
Coastal upwelling is a current phenomenon strongly influenced not only by sea currents, but also by the intensity and direction of the wind along the coast. In this case, the wind blowing in a direction parallel to the coast can have the effect, under some conditions, of generating a current which is diverted due to the Coriolis force, in a direction orthogonal to the coast and towards the open sea. Upwelling is precisely the vertical current phenomenon that moves deeper and colder waters that replace the surface water dragged offshore by the wind. The carrying current, which originates above all from variations in salinity, therefore tends to bring water up from the bottom, water which is colder than that present near the surface and rich in nutrients. This phenomenon has a significant impact on the local fish fauna. Upwelling is an extremely interesting phenomenon for the purposes of identifying coastal areas with high concentrations of nutrients and consequent increase in local fish fauna. In fact, upwelling phenomena have a notable influence on the recirculation of plankton-rich waters. Fish and marine organisms therefore benefit greatly from it; the result is a notable increase in fish diversity and in the abundance of fish in the arm of the sea affected by the phenomenon. Due to the strong influence of the wind in the generation of the upwelling phenomenon, the identification of the most favorable areas for the development of this process was achieved through the calculation of the frequencies of wind events in a direction parallel to the coast using data from the tide gauge stations of the National Tide Gauge Network. In detail, hourly wind data were used for those stations that presented a sufficiently high number of recorded data; wind episodes included in a 30 degree arc centered around the direction parallel to the coast at the point of interest, and with an intensity greater than 3 m/s were selected.
Identify stretches of sea favorable to the occurrence of the phenomenon and, therefore, where it is reasonable to expect a greater concentration of fish fauna.
There are no regulatory references or objectives set by the legislation.
Bakun, A. 1973. Coastal upwelling indices, west coast of North America, 1946-71. U. S. Dep. Commer., NOAA Tech. Rep., NMFS SSRF-67.
D'Ortenzio, F., D. Iudicone, C. De Boyer Montégut, P. Testor, D. Antoine, S. Marullo, R. Santoleri and G. Madec (2005). Seasonal variability of the mixed layer depth in the Mediterranean Sea as derived from in situ profiles. Geophysical Research Letters, 32, L12605, doi:10.1029/2005GL022463.
Ekman, V. W. 1905. On the influence of the earth's rotation on ocean currents. Ark. Matt. Astron. Fys. 2(11):1-52.
Fong, D. A. And Geyer, W. R.: Response of a river plume during an upwelling favorable wind event, J. Geophys. Res., 106, 1067–1084, 2001. 4.
Inghilesi, R., L. Ottolenghi, A. Orasi, C. Pizzi, F. Bignami, and R. Santoleri, Fate of river Tiber discharge investigated through numerical simulation and satellite monitoring, Ocean Sci., 8, 773-786, 2012.
ISPRA - RMN Stations: www. mareografico. it
Magaldi, M. G., T. M. Özgökmen, A. Griffa and M. Rixen, On the response of a turbulent coastal buoyant current to wind events: the case of the Western Adriatic Current, Ocean Dynamics, Volume 60, Number 1 (2010), 93-122.
Massetti L., 2004, Identification and Analysis of Upwelling in the Mediterranean Area, Master's Thesis in Applied Meteorology, Faculty of Agriculture, University of Florence.
Millot, C., Circulation in the Western Mediterranean Sea, Journal of Marine Systems, Volume 20, Issues 1–4, April 1999, Pages 423–442.
The upwelling indicator requires an in-depth study of the existing correlation with onshore and offshore Surface Water Temperature (SST) data.
Definition of a more robust upwelling index obtained by combining wind and SST data also coming from remote sensing. The actions to be planned concern, in particular, the introduction of data obtained from scatterometers, Ocean Color data and/or data from atmospheric numerical models.
The data is present in the database of the National Mareographic Network and can be found at the address www. mareografico. it or in Linked Open Data (LOD) at ISPRA - Dataset: http://dati. isprambiente. it/dataset/rmn-la-rete-mareografica-nazionale/
Italian seas
2019-2024
First, the statistical distributions and the corresponding wind roses were created at each station of the ISPRA National Mareographic Network (RMN), using the wind speed and direction data from 1 January 2024 to 31 December 2024. The speed and direction of the wind were selected with the aim of identifying the areas most favorable to the occurrence of the upwelling phenomenon. To take into account the Coriolis force, the directions parallel to the coast were chosen in the North West sector for the Tyrrhenian Sea and in the South East sector for the Adriatic Sea. Each directional sector has an amplitude of 30°. Furthermore, only winds with an intensity greater than 3 m/s were chosen. For each station, the ratio between the number of events selected (according to the procedure described above) and the total number of data recorded was calculated, obtaining an upwelling frequency (expressed as a percentage) which allows identifying the coastal areas most potentially exposed to the phenomenon.
The indicator allows the characterization of the areas favorable to the occurrence of the upwelling phenomenon, without, however, directly indicating its quantification.
The update of the indicator with the 2024 data highlighted a general stationarity in the number of cases favorable to the development of the upwelling phenomenon along the Italian coasts compared to 2023.
As can be seen from Table 1, the stations located in the Tyrrhenian area show very low frequencies of winds favorable to the generation of upwelling, while in the Adriatic Sea, these frequencies are on average higher, thanks also to the contribution of the Bora, a strong wind that blows from the North-East and which generates upwelling along the coastal line to the East of the basin. The stations located in the Ionian Sea and in the Sicilian Channel indicate these areas as favorable for the generation of upwelling. A significant increase was recorded in 2024, compared to 2023, at the Ancona station. The area of the Strait of Messina is confirmed to be, as also known from the literature, an area strongly affected by upwelling mainly due to hydrodynamic phenomena; the ionic waters of the Strait are in fact colder than those of the surrounding basins. Also in 2024, as in 2023, an increase in winds favorable to the generation of upwelling in the Ionian area near Crotone was maintained compared to 2022. Furthermore, a moderate increase was recorded at the stations of Bari, Ortona, Palermo, Ravenna, Vieste and Venice. The station that generally indicates the most favorable area for the generation of upwelling phenomena is always that of Carloforte.
The analysis of the indicator starting from 2019 allows a first evaluation of the short-term trend of the phenomenon, which appears generally stationary (Table 1). Furthermore, the increases in the Porto Empedocle and Crotone stations are confirmed, where an increase over time in cases favorable to the generation of upwelling episodes seems to emerge. The favorable cases in Ancona are increasing again, equaling what was detected in 2019, but this trend requires further confirmation through the acquisition and analysis of further data.
| Data |
|---|
Thumbnail
Headline
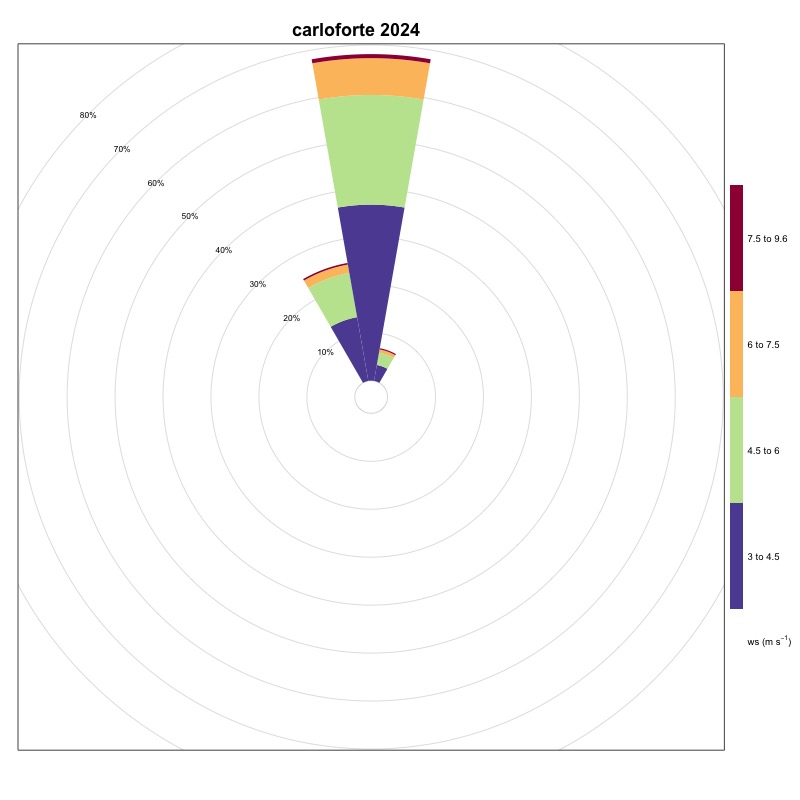
Figure 1: Wind station Ancona (2024) Data source
ISPRA – National Mareographic Network (RMN) |
Thumbnail
Headline
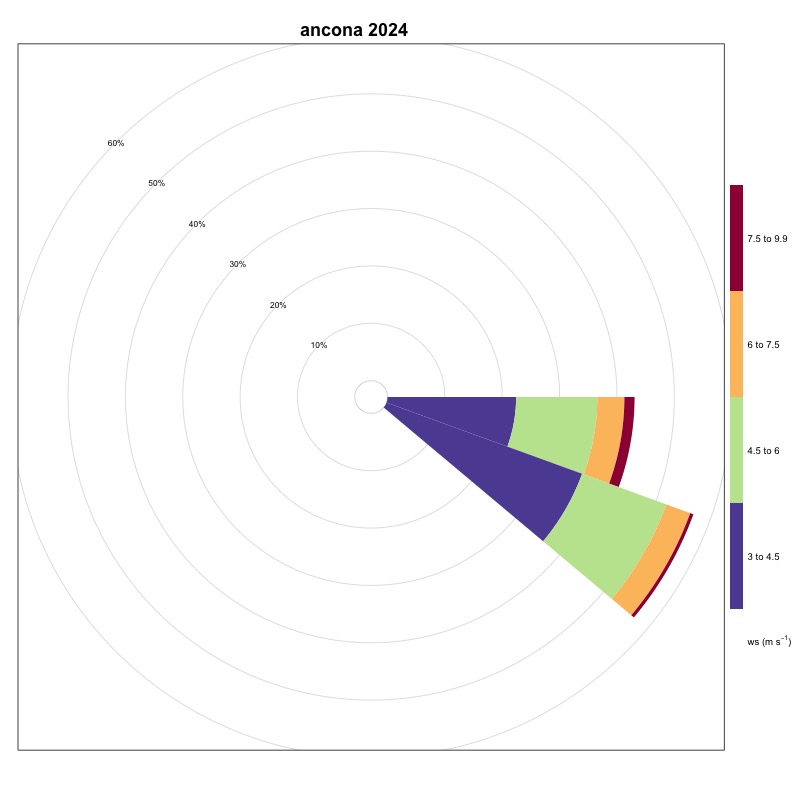
Figure 2: Wind station Bari (2024) Data source
ISPRA – National Mareographic Network (RMN) |
Thumbnail
Headline
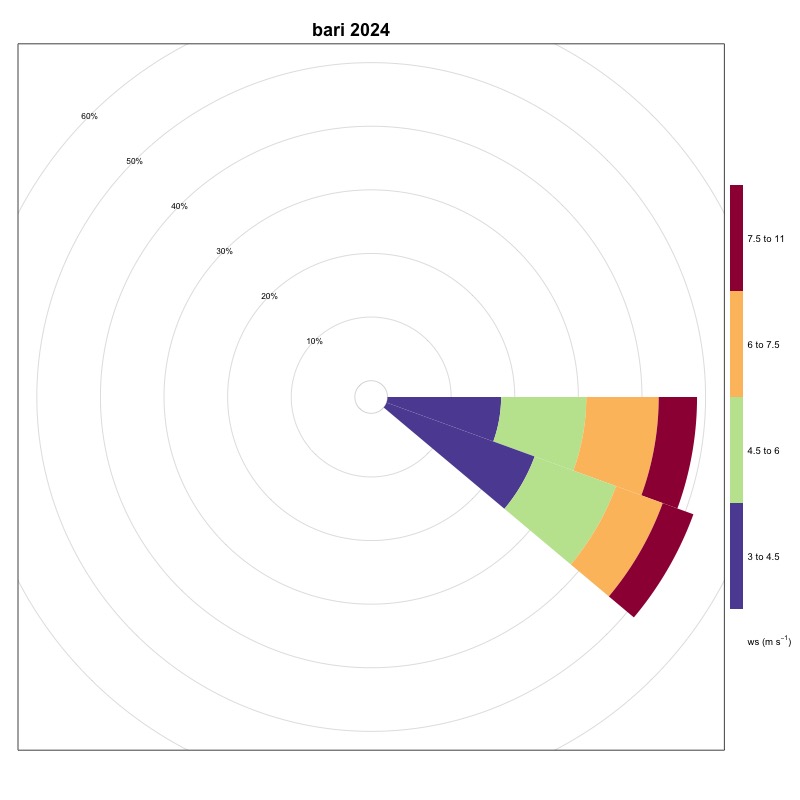
Figure 3: Wind station Cagliari (2024) Data source
ISPRA – National Mareographic Network (RMN) |
Thumbnail
Headline
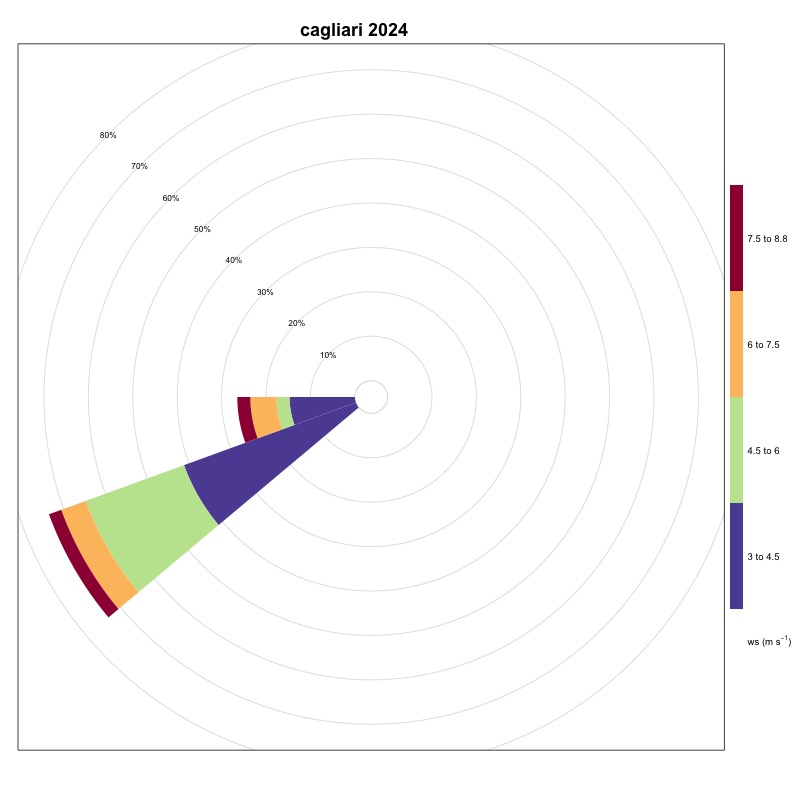
Figure 4: Wind station Carloforte (2024) Data source
ISPRA – National Mareographic Network (RMN) |
Thumbnail
Headline
Figure 5: Civitavecchia wind station (2024) Data source
ISPRA – National Mareographic Network (RMN) |
Thumbnail
Headline
Figure 6: Crotone wind station (2024) Data source
ISPRA – National Mareographic Network (RMN) |
Thumbnail
Headline
Figure 7: Wind station Genoa (2024) Data source
ISPRA – National Mareographic Network (RMN) |
Thumbnail
Headline
Figure 8: Wind station Imperia (2024) Data source
ISPRA – National Mareographic Network (RMN) |
Thumbnail
Headline
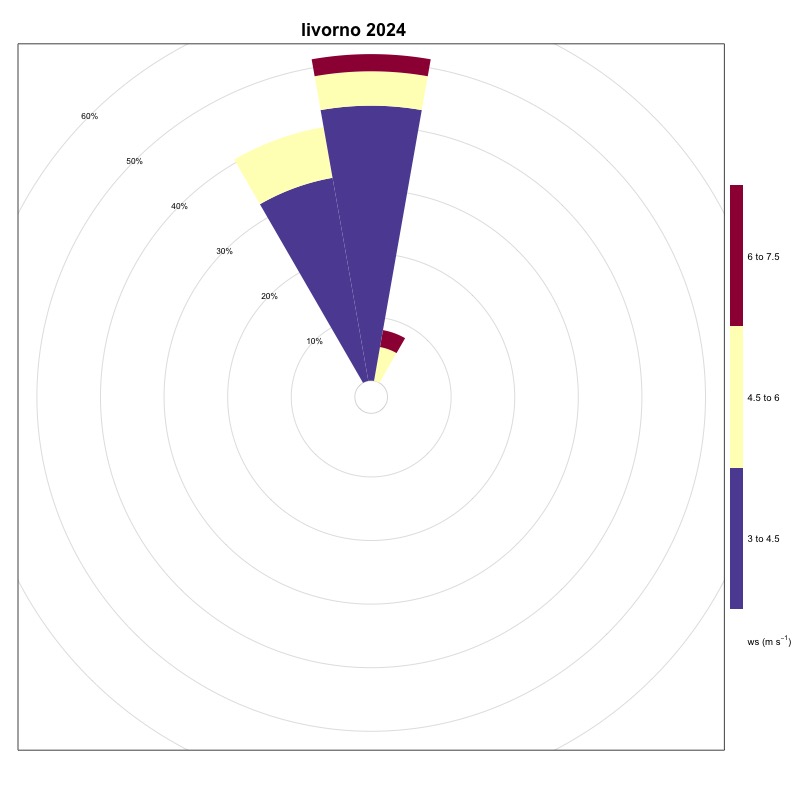
Figure 9: Wind station Livorno (2024) Data source
ISPRA – National Mareographic Network (RMN) |
Thumbnail
Headline
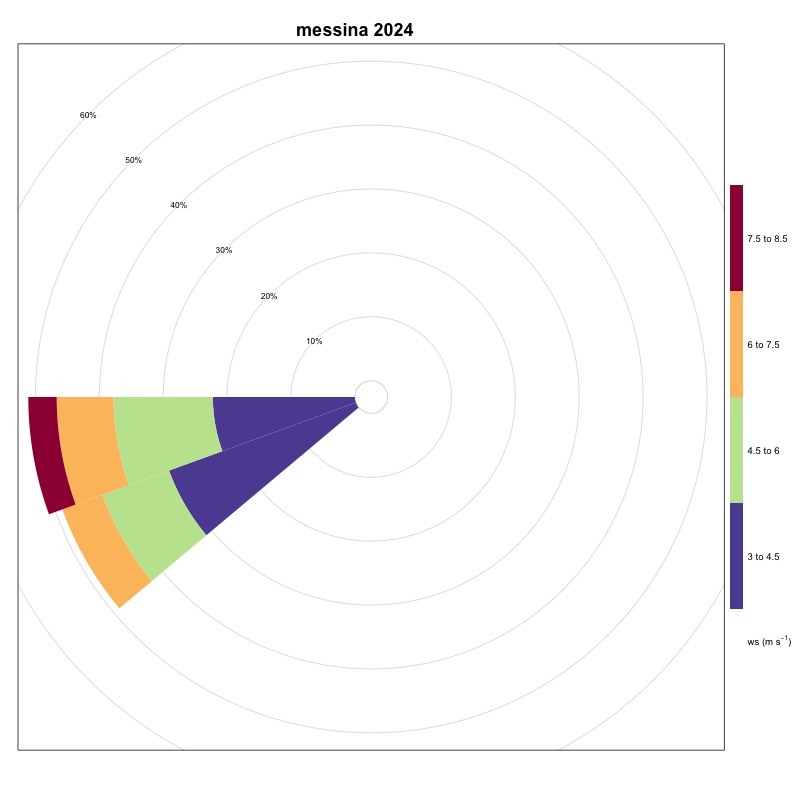
Figure 10: Wind station Messina (2024) Data source
ISPRA – National Mareographic Network (RMN) |
Thumbnail
Headline
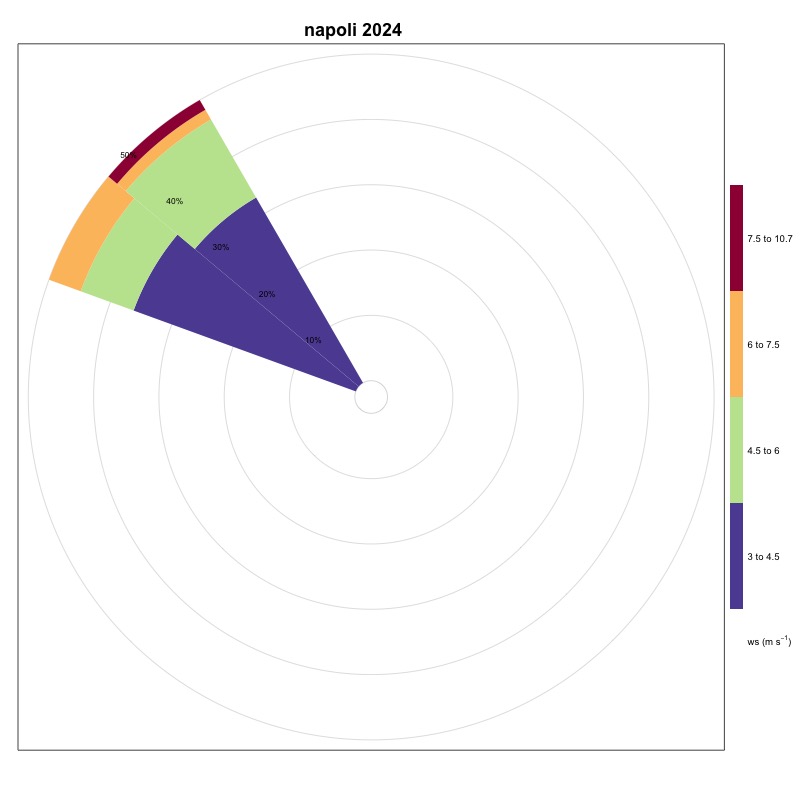
Figure 11: Wind station Naples (2024) Data source
ISPRA – National Mareographic Network (RMN) |
Thumbnail
Headline
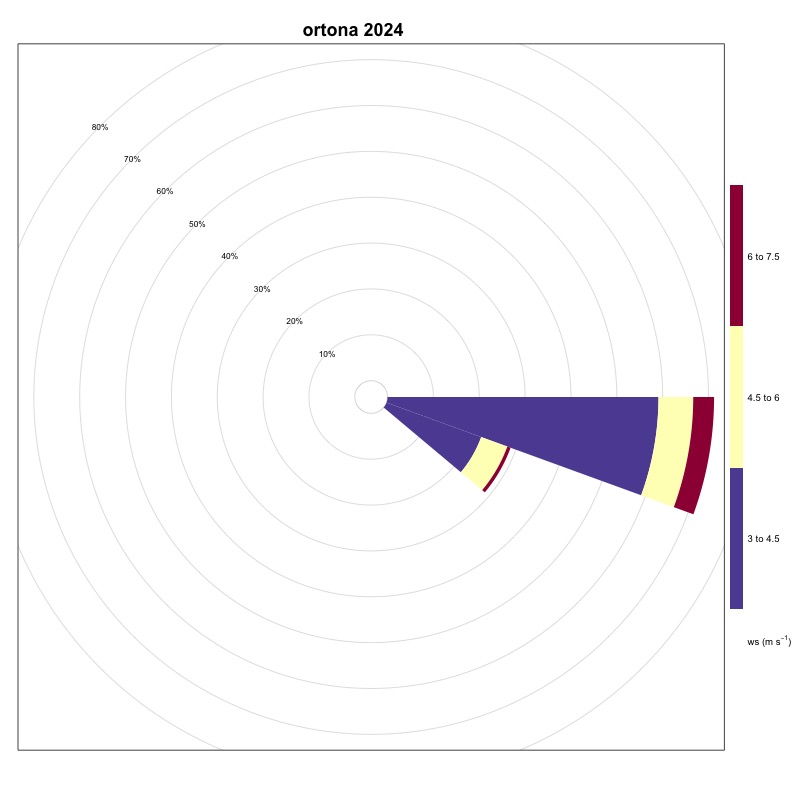
Figure 12: Wind station Ortona (2024) Data source
ISPRA – National Mareographic Network (RMN) |
Thumbnail
Headline
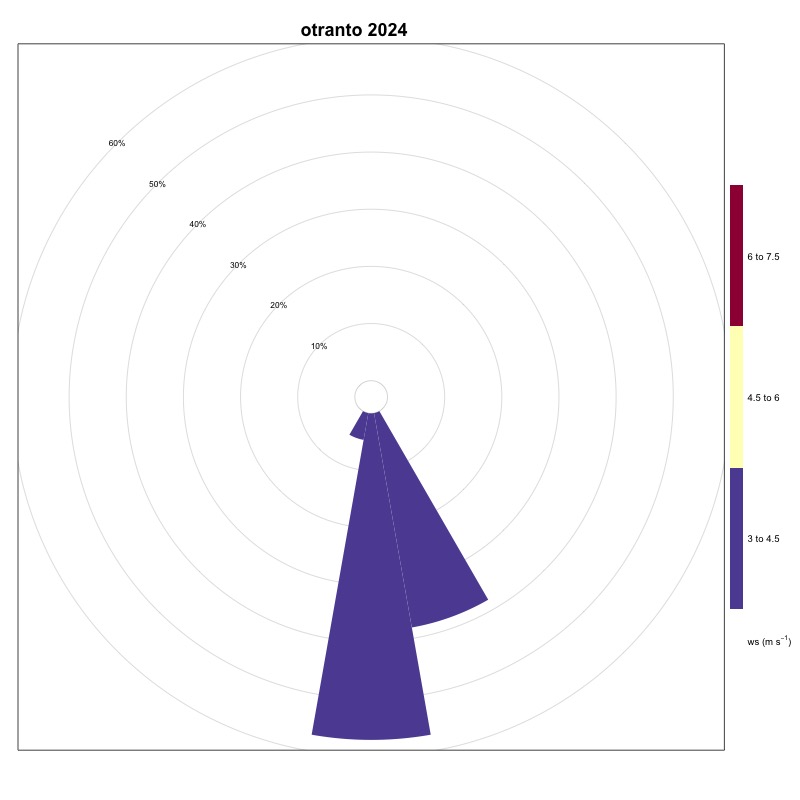
Figure 13: Wind station Otranto (2024) Data source
ISPRA – National Mareographic Network (RMN) |
Thumbnail
Headline
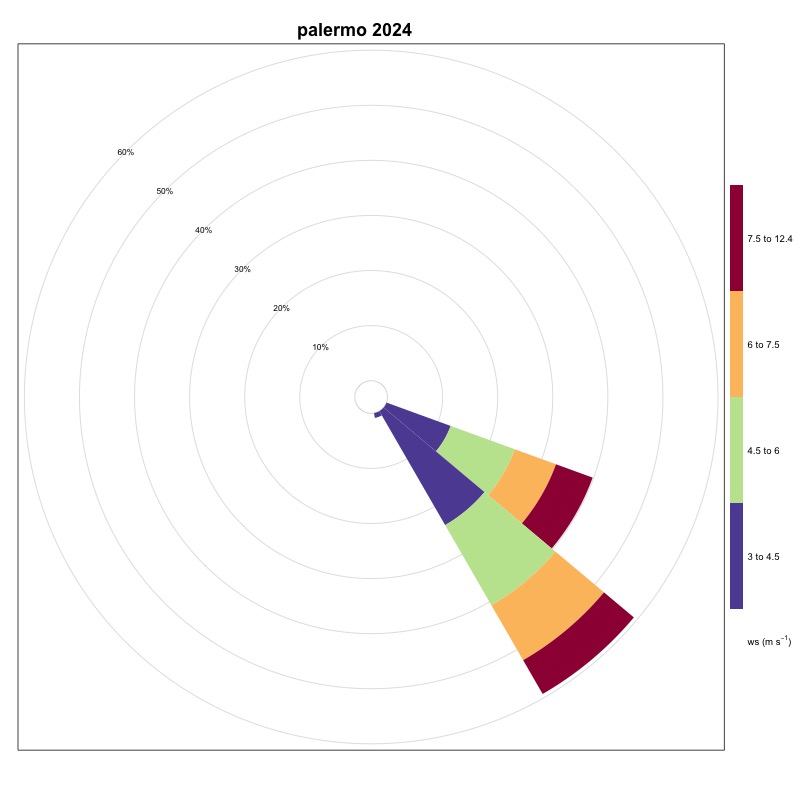
Figure 14: Wind station Palermo (2024) Data source
ISPRA – National Mareographic Network (RMN) |
Thumbnail
Headline
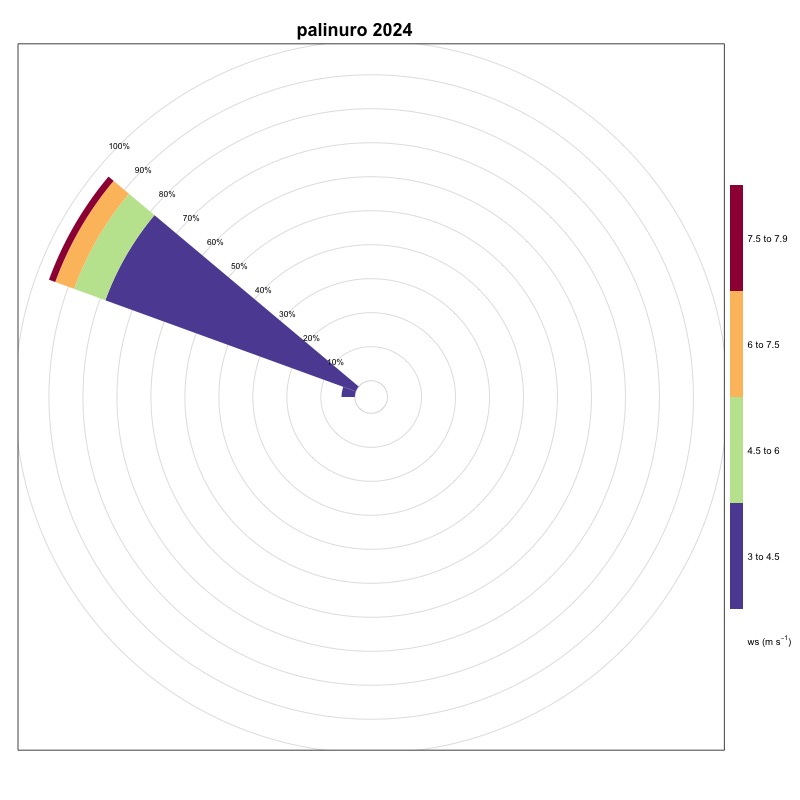
Figure 15: Wind station Palinuro (2024) Data source
ISPRA – National Mareographic Network (RMN) |
Thumbnail
Headline
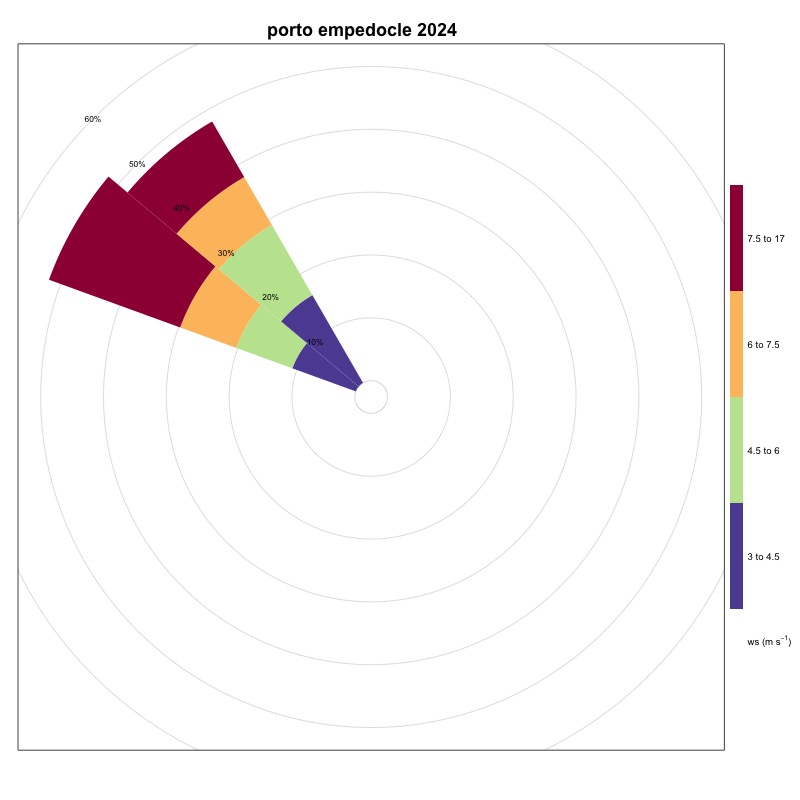
Figure 16: Porto Empedocle wind station (2024) Data source
ISPRA – National Mareographic Network (RMN) |
Thumbnail
Headline
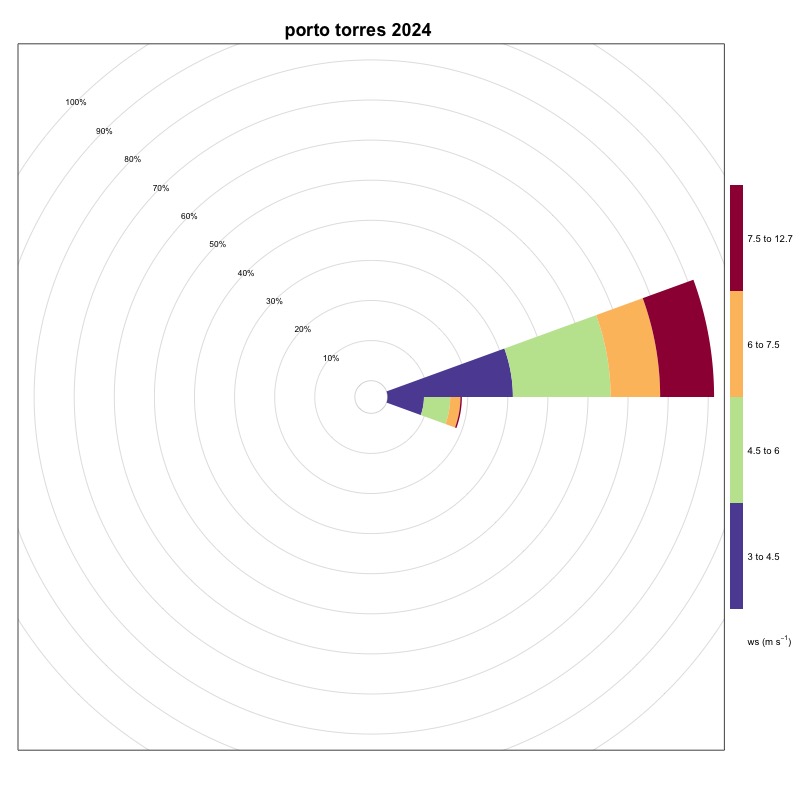
Figure 17: Porto Torres wind station (2024) Data source
ISPRA – National Mareographic Network (RMN) |
Thumbnail
Headline
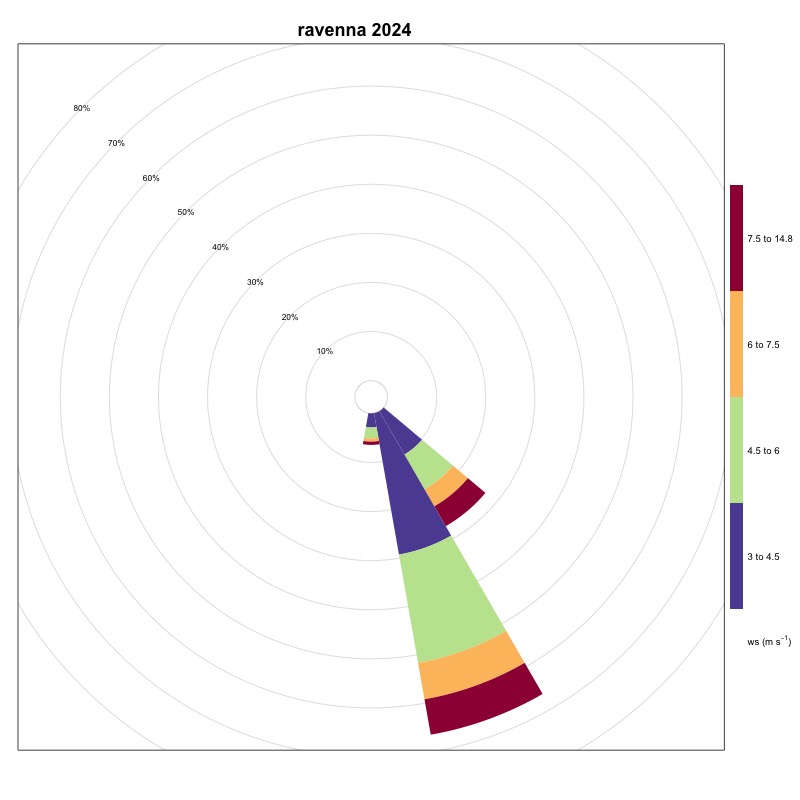
Figure 18: Wind station Ravenna (2024) Data source
ISPRA – National Mareographic Network (RMN) |
Thumbnail
Headline
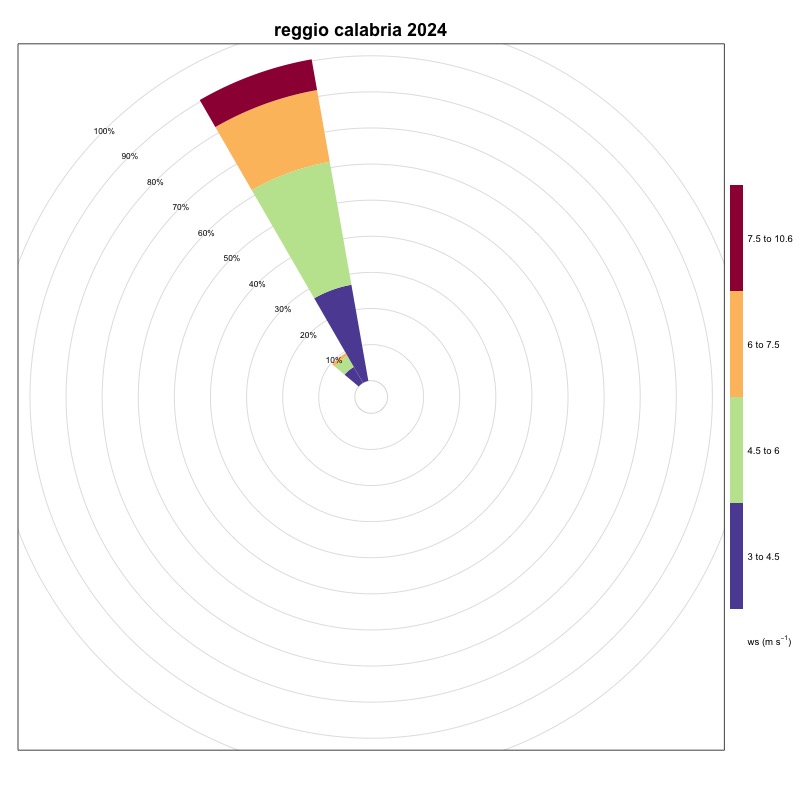
Figure 19: Wind station Reggio Calabria (2024) Data source
ISPRA – National Mareographic Network (RMN) |
Thumbnail
Headline
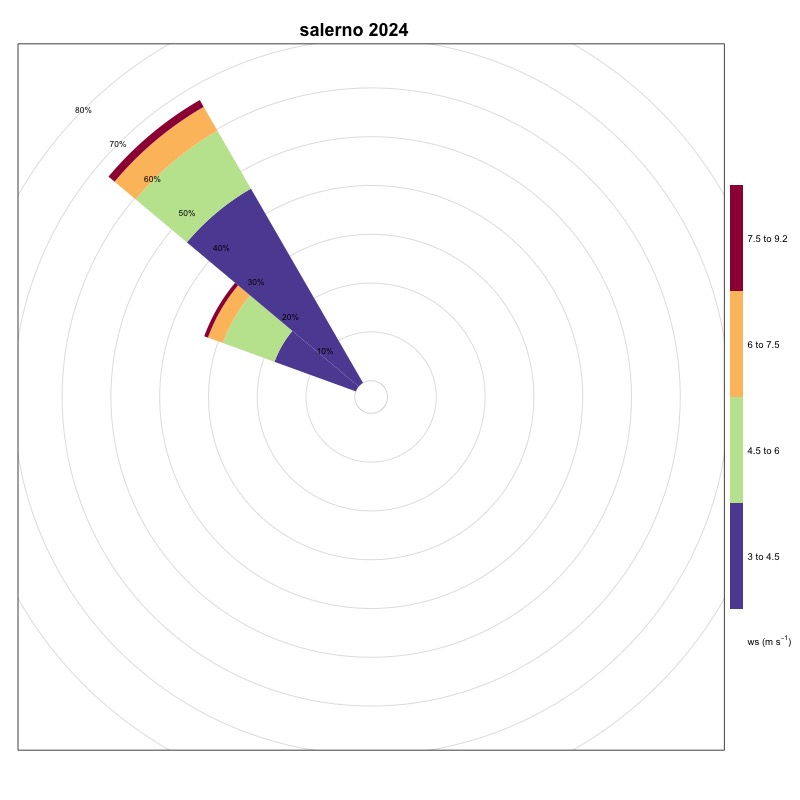
Figure 20: Wind station Salerno (2024) Data source
ISPRA – National Mareographic Network (RMN) |
Thumbnail
Headline
Figure 21: Wind station Taranto (2024) Data source
ISPRA – National Mareographic Network (RMN) |
Thumbnail
Headline
Figure 22: Wind station Trieste (2024) Data source
ISPRA – National Mareographic Network (RMN) |
Thumbnail
Headline
Figure 23: Wind station Venice (2024) Data source
ISPRA – National Mareographic Network (RMN) |
Thumbnail
Headline
Figure 24: Wind station Vieste (2024) Data source
ISPRA – National Mareographic Network (RMN) |
Headline
Table 1: Wind frequency along the Italian coasts Data source
ISPRA - National Mareographic Network |
The stations considered in the western area of the Italian seas present wind directions favorable to the generation of upwelling phenomena mainly from the North. Vice versa, for the stations in the eastern area, mainly from the South.
For the following stations the selected directional sectors are (degrees N):
Northern Tyrrhenian Sea :
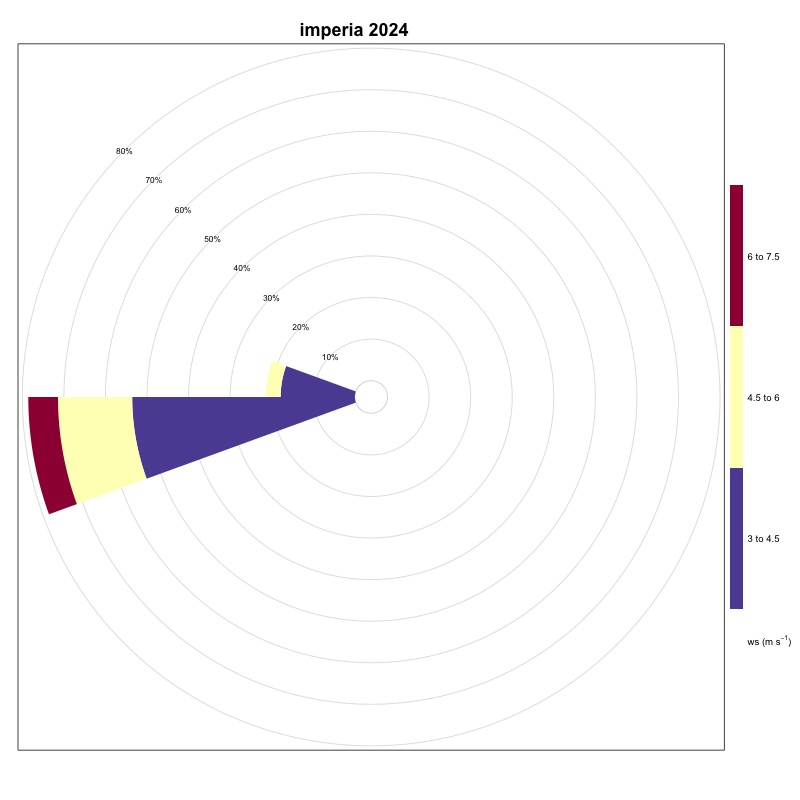
Imperia 255° – 285°
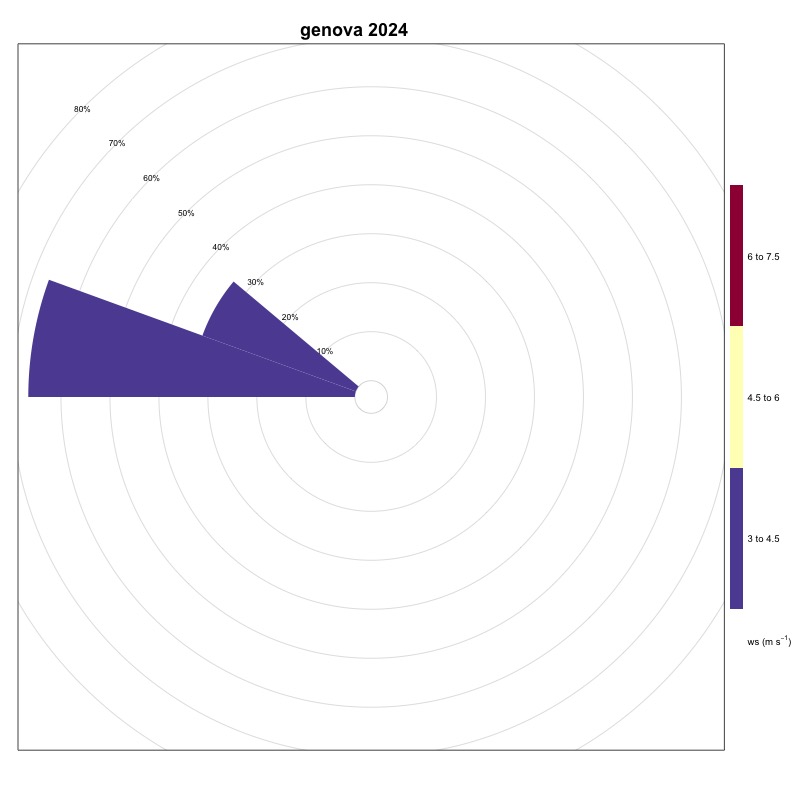
Genoa 279th - 309th
Livorno 345° - 15°
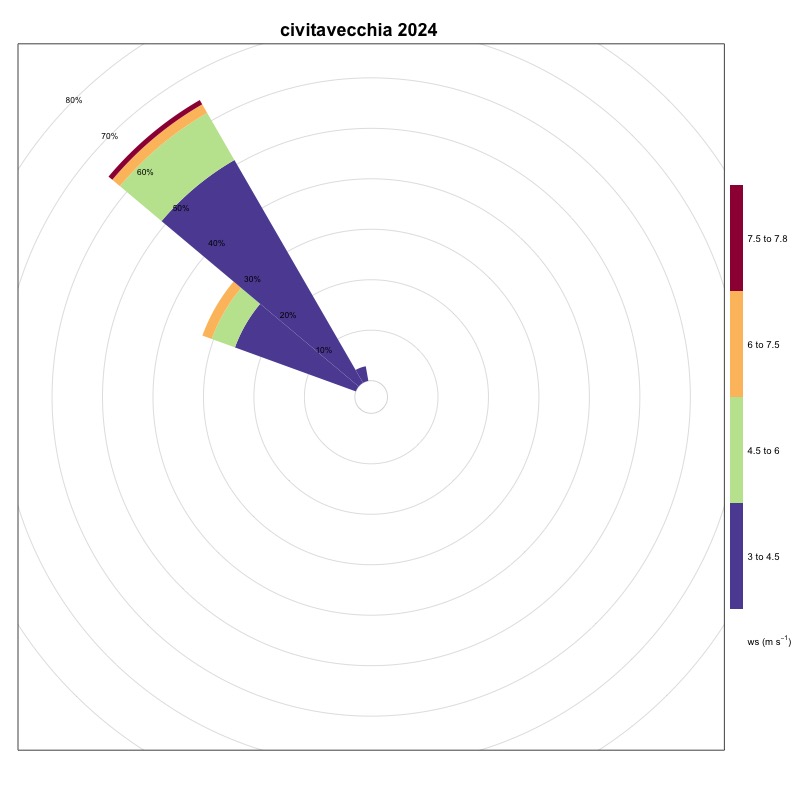
Civitavecchia 303° - 333°
The frequency of events for the stations of Imperia (Figure 8), Genoa (Figure 7), Livorno (Figure 9) and Civitavecchia (Figure 5) are respectively equal to 0.32%, 0.07%, 0.42% and 1.2%.
Southern Tyrrhenian Sea :
Naples 300° – 330°
Salerno 300° – 330°
Palinuro 279° – 309°
The frequency of events for the stations of Naples (Figure 11), Salerno (Figure 20) and Palinuro (Figure 15) are respectively equal to 0.66%, 1.41% and 0.58%.
The Adriatic Sea , in the northern area, is battered by the Bora, a strong wind that blows from the North-East and generates upwelling along the coastline to the East of the basin.
This stretch of sea is also affected by a large influx of river water coming from the Po and the other major rivers of North Eastern Italy, characterized by lower temperature and salinity than the sea and greater nutrient richness.
The stations considered are:
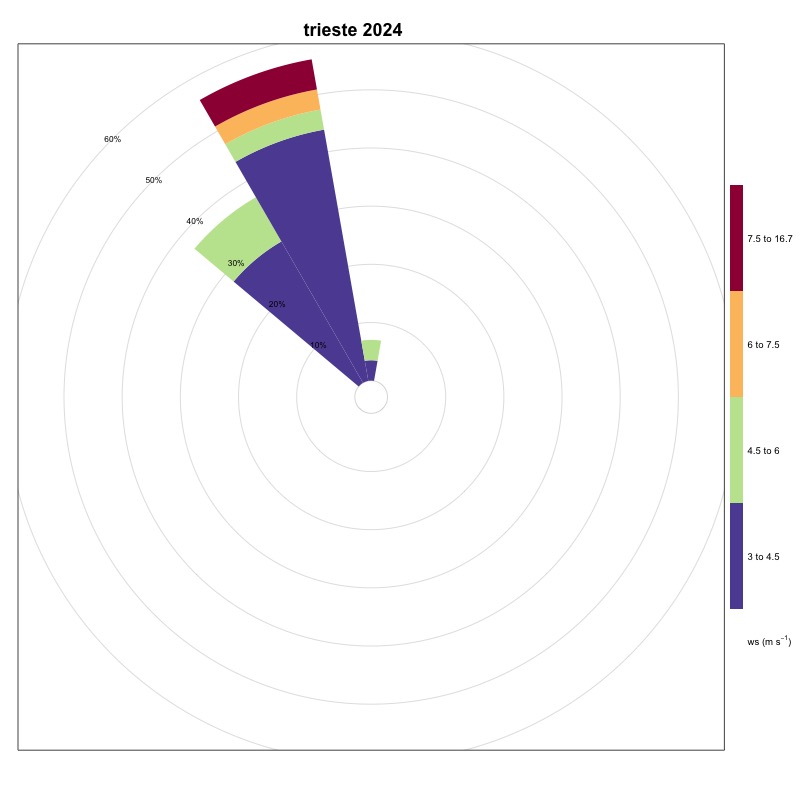
Trieste 325° – 355°
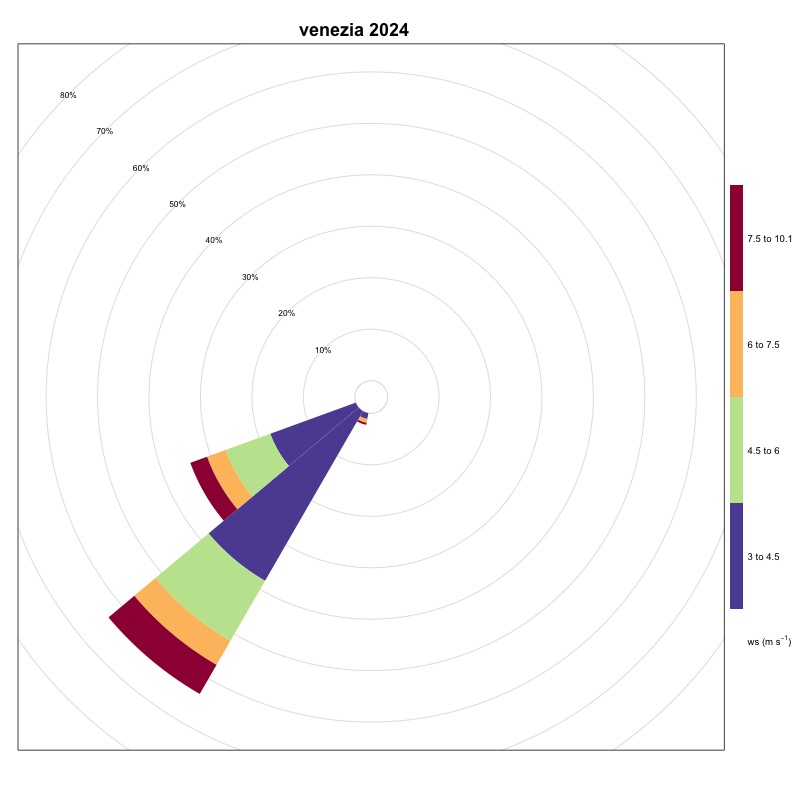
Venice 210° – 240°
Ravenna 144th – 174th
Ancona 99° – 129°
Ortona 99° – 129°
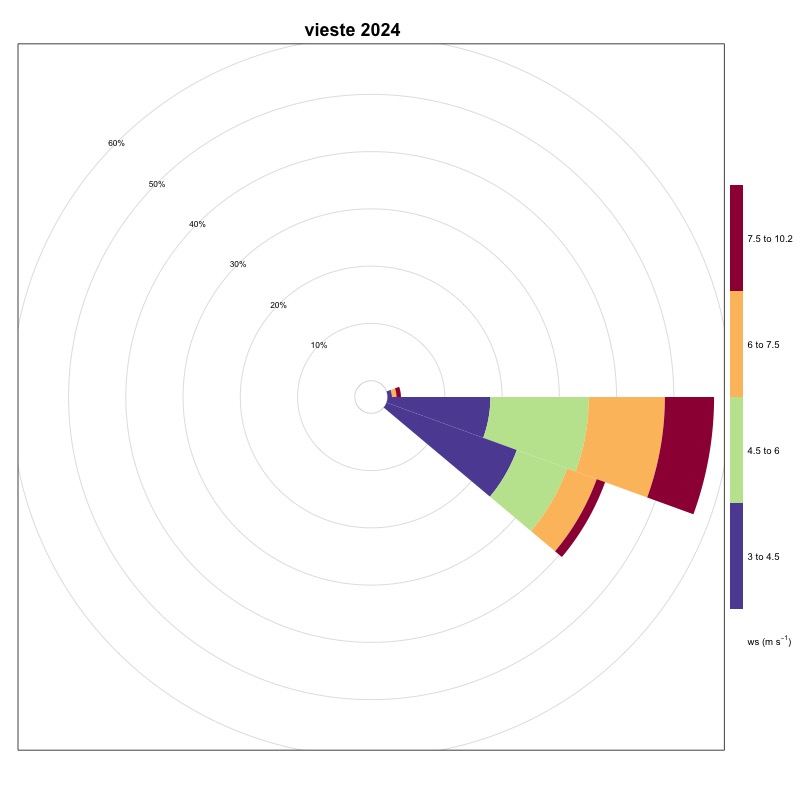
Vieste 90° – 120°
Bari 99° – 129°
Otranto 165° – 195°
The frequencies recorded in the northern area are respectively for Trieste (Figure 22), Venice (Figure 23), Ravenna (Figure 18), Ancona (Figure 1) equal to 0.65%, 2.98%, 5.25% and 4.09%.
The frequencies in the southern part of the Adriatic, recorded at the stations of Ortona (Figure 12), Vieste (Figure 24), Bari (Figure 2) and Otranto (Figure 13) are equal to 1.51%, 1.46%, 5.12% and 0.24%.
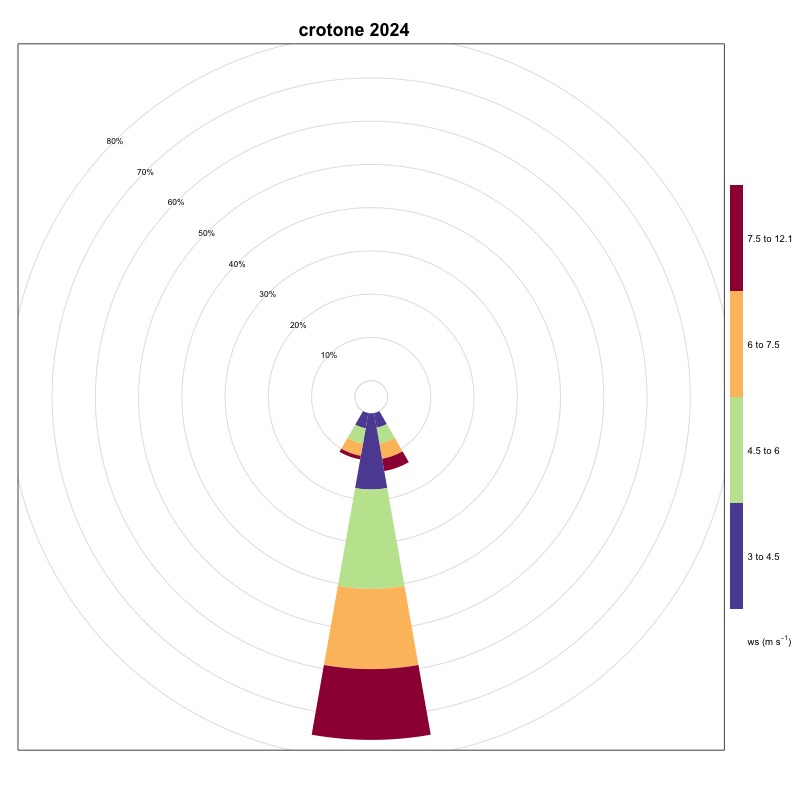
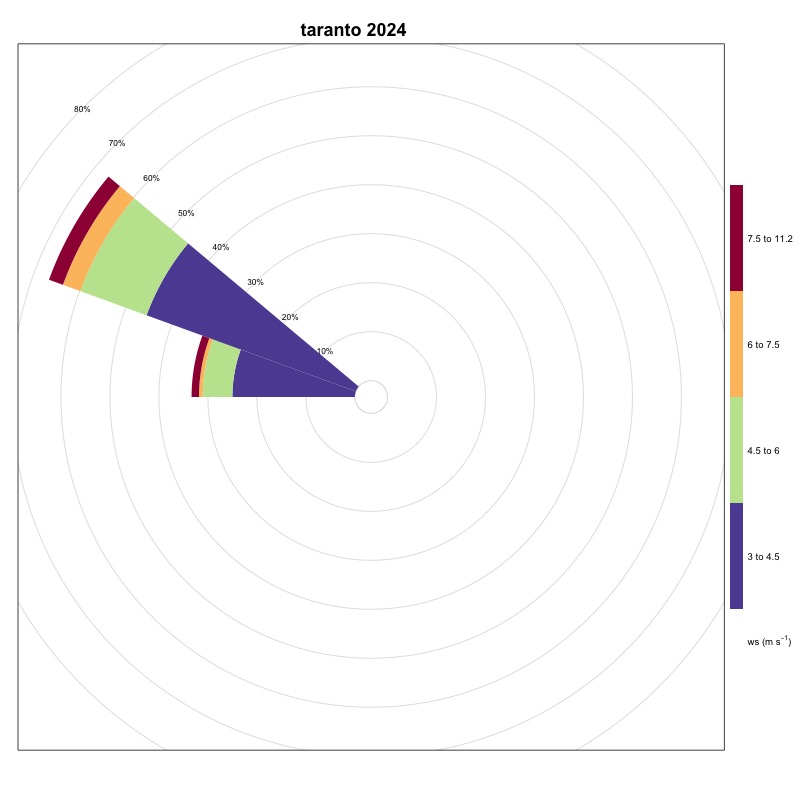
The frequencies calculated in Ionian Sea come from the stations of Taranto (Figure 21) and Crotone (Figure 6), with values equal to 1.51% and 8.31% and the following directional sectors:
Taranto 279th – 309th
Crotone 165° – 195°
The upwelling phenomenon in Sicily was calculated through data from the stations of:
Catania 186th – 216th
Porto Empedocle 300° – 330°
Palermo 123rd – 153rd
The Catania station presented malfunctions in 2024, therefore, it was not possible to calculate the percentage of favorable phenomena. The other two stations show frequencies of 6.5% (Figure 16) and 1.29% (Figure 14) respectively.
A particular case, due to the physical nature of local tidal and hydrodynamic phenomena, is represented by strait of Messina , monitored through the stations of:
Reggio Calabria 320° – 350°
Messina 230° – 260°
in which frequencies equal to 5.21% (Figure 19) and 0.51% (Figure 10) were recorded respectively.
Finally, in Sardinia, Cagliari (Figure 3) has a percentage of events coming from the sector between 230° and 260° equal to 0.4%, Porto Torres (Figure 17) has a frequency of 3.15% in the 75° - 105° directional sector, while Carloforte (Figure 4) with a frequency of 13.88% is once again the station with the highest number of favorable events, found in the directional sector between 345° and 15°.