Marina Penna, Benedetta Trabucco
The ecological classification index of the Biological Quality Element "benthic macroinvertebrates," M-AMBI (Multimetric-AZTI Marine Biotic Index), allows a synecological evaluation of the ecosystem under analysis. It is based on the analysis of the structure of benthic macroinvertebrate communities, considering the ecological value of macrozoobenthic species in soft sediments. Species are divided into five ecological groups (first-order opportunistic, second-order opportunistic, tolerant, sensitive/tolerant, and sensitive) based on their sensitivity to gradients of environmental stress. The index describes the quality status of the Biological Quality Element "benthic macroinvertebrates" in five classes: High, Good, Moderate, Poor, and Bad.
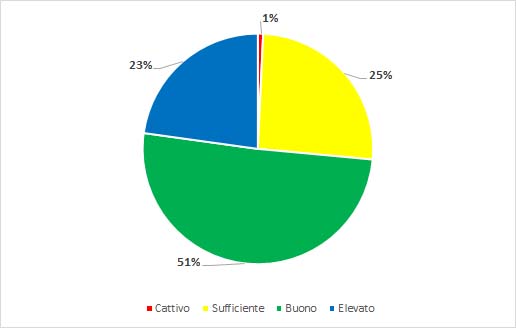
Overall, no critical situations were identified for the period 2017–2022 in the coastal regions where data are available. The analysis indicates that 74% of monitoring stations are in High or Good status, while 1% of stations are in Bad status.
The M-AMBI (Multivariate-Azti Marine Biotic Index) is a multimetric index that includes the calculation of AMBI, the Diversity Index (H), and the number of species (S) for coastal marine waters, in line with the implementation of the Water Framework Directive (WFD 2000/60/EC; Legislative Decree 152/06; Ministerial Decree 260/10). The calculation method for M-AMBI involves processing the aforementioned metrics using multivariate statistical analysis techniques.
This index is used to provide a synthetic ecological classification of the ecosystem by employing structural parameters (diversity, species richness, and the ratio of tolerant to sensitive species) of the soft sediment macrozoobenthic community. Backed by robust bibliographic support, the M-AMBI effectively summarizes the complexity of soft sediment communities, offering an ecological interpretation of the ecosystem under examination.
The value of M-AMBI ranges between 0 and 1 and corresponds to the Ecological Quality Ratio (EQR) required by the Water Framework Directive 2000/60/EC. The index describes the quality status of the Biological Quality Element "benthic macroinvertebrates" in five classes: High, Good, Moderate, Poor, and Bad.
To classify the quality status of marine water bodies, in compliance with DM 260/10, using the biological quality element "benthic macroinvertebrates.
- Directive 2000/60/EC
- DM 260/10
The value of M-AMBI ranges between 0 and 1 and corresponds to the Ecological Quality Ratio (EQR) required by the Directive. To fulfill the European Directive, the goal is to achieve good ecological status for all water bodies.
Reference EQR values:
- High/Good quality status: 0.81
- Good/Moderate quality status: 0.61
- Moderate/Poor quality status: 0.41
Borja, A., Franco, J., Perez, V., 2000. A marine biotic index to establish the ecological quality of soft-bottom benthos within European estuarine and Coastal environments. Marine Pollution Bulletin 40 (12), 1100–1114.
Borja, A., Muxika, I., Franco, J., 2003a. The application of a marine biotic index to different impact sources affecting soft-bottom benthic communities along European coasts. Marine Pollution Bulletin 46, 835–845.
Borja, A., Franco, J., Muxika, I., 2003b. Classification tools for marine ecological quality assessment: the usefulness of macrobenthic communities in an area affected by a submarine outfall. ICES CM 2003/Session J-02, Tallinn (Estonia), 24–28 September, 2003.
Borja, A., Franco, J., Valencia, V., Bald, J., Muxika, I., Belzunce, M.J., Solaun, O., 2004a. Implementation of the European water framework directive from the Basque country (northern Spain): a methodological approach. Marine Pollution Bulletin 48, 209–218.
Borja, A., Franco, J., Muxika, I., 2004b. The biotic indices and the water framework directive: the required consensus in the new benthic monitoring tools. Marine Pollution Bulletin 48, 405–408.
- Low level of detail of the information provided
- uneven data relating to different spatial units / different data quality
Constant updating of the species list used.
Coastal ARPA
Use the ARPA data collected in the SINTAI database, EIONET-SoE flow.
Coastal regions (8/15)
2017-2022
The M-AMBI (Muxika et al., 2007) includes the calculation of the AMBI (Borja et al., 2000), the Shannon-Wiener Diversity Index H' (1949), and the number of species (S):
- AMBI= [(0 x %GI) + (1.5 x % GII) + (3 x % GIII) + (4.5 x % GIV) + (6 x %GV)]/100
GI: Sensitive species
GII: Sensitive/tolerant species
GIII: Tolerant species
GIV: Opportunistic species (second order)
GV: Opportunistic species (first order)
ss
H' = - ∑ (pi)(log2 pi)
i=1
Where:
- pi = numerical frequency of the i-th species with respect to the total number of individuals = ni/Nn_i / N
- ss = total number of species present at each station
The calculation of M-AMBI involves processing the mentioned metrics using multivariate statistical analysis techniques. The value of M-AMBI ranges between 0 and 1 and corresponds to the Ecological Quality Ratio (EQR) required by the Directive.
To calculate the index, the use of free software (AZTI Marine Biotic Index: New Version AMBI 5.0), currently available for download at http://ambi.azti.es is necessary. Since it is based on the ecological value assigned to the species present at monitoring stations, the M-AMBI value must be calculated using the latest available update of the species list in the software. Quality classes are assigned based on the multivariate processing results of the parameters described earlier, compared with the reference conditions defined for each parameter in DM 260/2010.
During the 2017–2022 period, of the 272 monitored stations across 8 coastal regions:
- 23% are in High ecological status,
- 51% in Good status,
- 25% in Moderate status,
- 1% (equivalent to 2 stations in Lazio) in Bad status.
In summary, 74% of the stations considered in the analysis are in High or Good status, meeting the quality standard required by the regulations (Figure 1).
Not definable
| Data |
|---|
Thumbnail
Headline
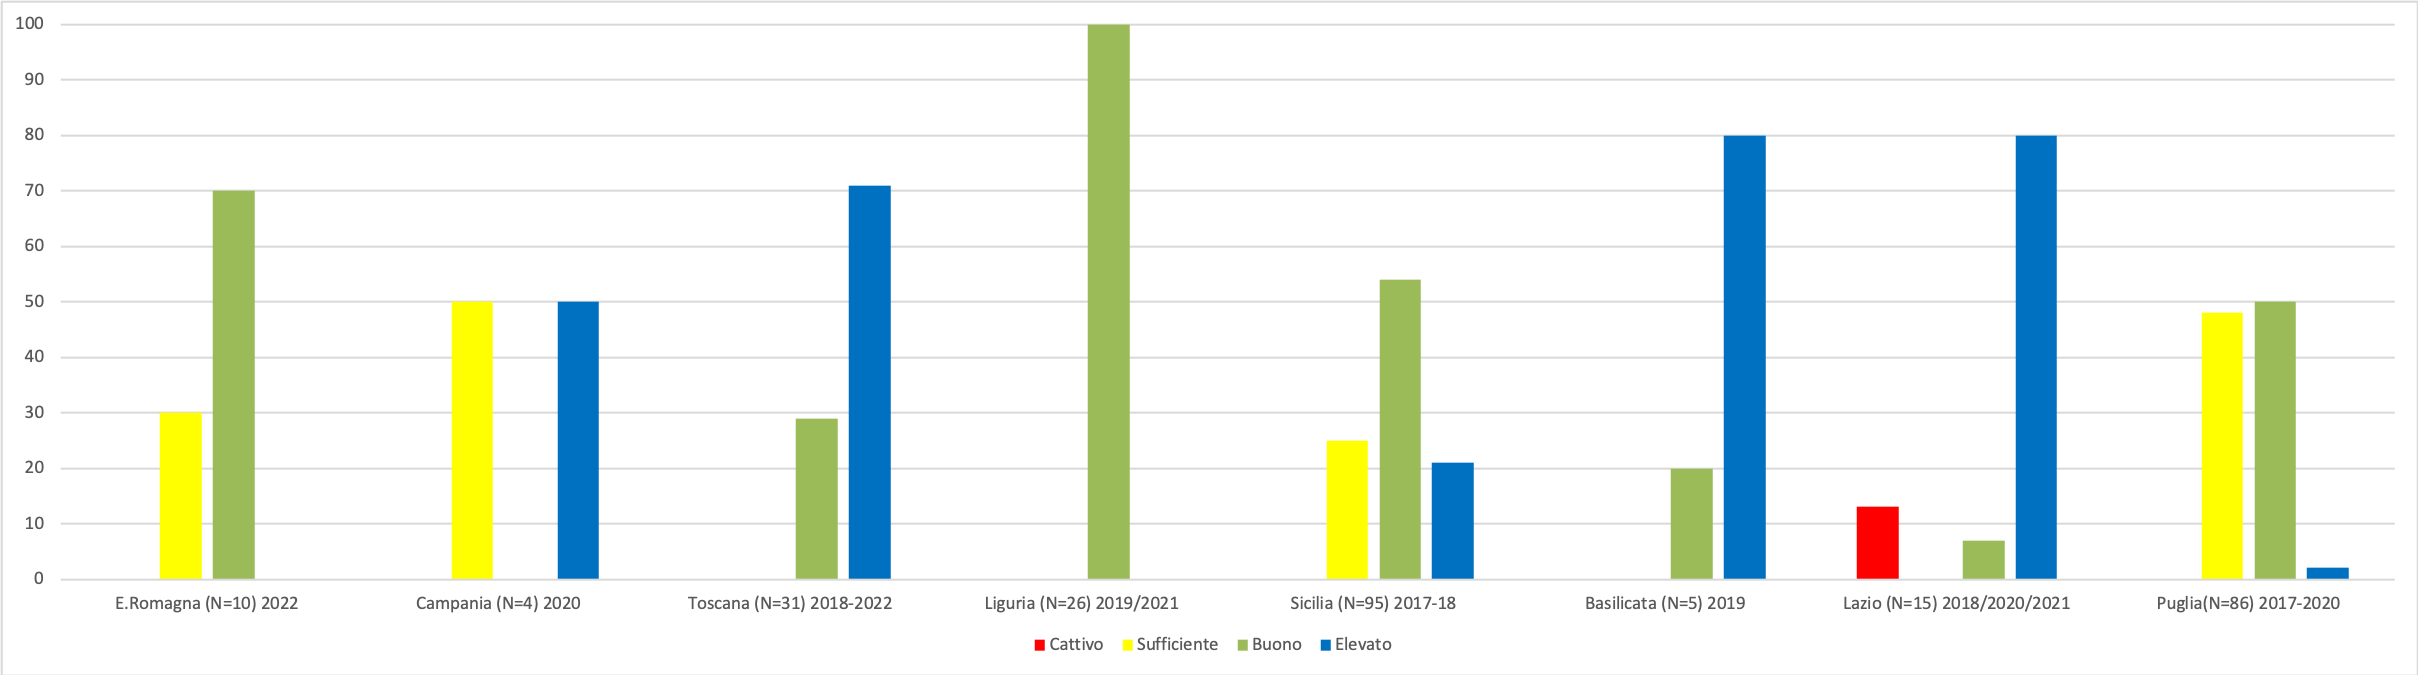
Figure 2: Benthonic Macroinvertebrate EQB (M-AMBI) 2017-2022 Data source
Processing ISPRA data flow EIONET SoE Note
Comparison of regions (No. number of stations) |
Thumbnail
Headline
Figure 1: EQB EQB benthic Macroinvertebrate (M-AMBI) Data source
ISPRA processing on EIOET SoE data stream Note
272 stations - 2007-21 referral period 2017-2022 |
For data analysis, when the same stations were monitored over multiple years, the worst classification result was considered for processing, in line with the precautionary principle.
From the comparison between regions (Figure 2), a significant heterogeneity emerges in terms of the number of monitored stations during the available period: ranging from 4 stations in Campania (only in 2020) to 95 stations in Sicily (data from 2017–2018).
In particular:
Moderate status (below the required quality standard) is observed in: