Eleonora Di Cristofaro, Francesca Palomba
The indicator describes ammonia (NH₃) emissions into the atmosphere produced by the agricultural sector, mainly due to livestock management and fertilizer use. It enables the assessment of the sector's contribution to total national emissions and the achievement of reduction targets. In 2023, the agriculture sector was responsible for the emission of 349.23 kt of NH₃ into the atmosphere, accounting for 91.4% of the national total. This represents an 18% reduction compared to 2005 levels, thereby making a significant contribution towards achieving the set target.
The trend in NH₃ emissions is consistent with the targets set by the Gothenburg Protocol and the National Emission Ceiling Directive (NEC Directive).
The indicator describes ammonia (NH₃) emissions into the atmosphere produced by the agricultural sector, primarily linked to the intensive practices adopted in recent decades. Specifically, it considers emissions resulting from the widespread use of synthetic and organic fertilizers, as well as from livestock management (emissions from housing and manure storage).
A minimal share of national NH₃ emissions originates from other production processes, road transport, and waste treatment/disposal.
Ammonia deposition contributes to several environmental issues, such as soil acidification, biodiversity loss, and eutrophication of water bodies. Additionally, it plays a role in the formation of particulate matter, with consequences for human health.
NH₃ emissions are quantified using appropriate estimation processes defined by the methodologies outlined in the EMEP/EEA air pollutant emission inventory guidebook (EMEP/EEA, 2023).
Assess the trend of emissions and the achievement of national and international reduction targets established by the Gothenburg Protocol and the NEC Directive. Evaluate the share of ammonia emissions attributable to agriculture in relation to total national emissions.
- Convention on Long-Range Transboundary Air Pollution, CLRTAP;
- Gothenburg Protocol (1999 and 2012);
-
NEC Directive (2016/2284) and Legislative Decree No. 81/2018 transposing it.
The target set by the NEC Directive (Directive (EU) 2016/2284 of 14 December 2016, which repeals and replaces Directive 2001/81/EC) is a 5% reduction in ammonia emissions for each year from 2020 to 2029 (as established by the 2012 revision of the Gothenburg Protocol) and a 16% reduction starting from 2030, compared to 2005 emission levels.
- EEA, 2022. National Emission reduction Commitments Directive reporting status 2022. URL: https://www.eea.europa.eu/publications/national-emission-reduction-commitments-directive-2022/national-emission-reduction-commitments-directive
- EMEP/EEA, 2023. Air Pollutant Emission Inventory Guidebook. Technical guidance to prepare national emission inventories. EEA report 06/2023. URL: https://www.eea.europa.eu/en/analysis/publications/emep-eea-guidebook-2023
- ISPRA, 2025 [a]. Italian Emission Inventory 1990-2023. Informative Inventory Report 2025. Rapporti 411/2025. URL: https://emissioni.sina.isprambiente.it/inventario-nazionale/#Report
- ISPRA, 2025 [b]. Serie storiche delle emissioni nazionali di inquinanti atmosferici 1990-2023. URL: https://emissioni.sina.isprambiente.it/inventario-nazionale/#Report
- ISTAT, 2025. Dati annuali sulla consistenza del bestiame, sulla produzione di latte, sui mezzi di produzione, sulle coltivazioni. Istituto Nazionale di Statistica. URL: http://dati.istat.it/
ISPRA
ISPRA, Inventario delle emissioni in atmosfera (https://emissioni.sina.isprambiente.it/inventario-nazionale/)
National level
1990-2023
The indicator represents the estimated national ammonia emissions from the agriculture sector, calculated according to the methodology described in the EMEP/EEA air pollutant emission inventory guidebook (EMEP/EEA, 2023). The Informative Inventory Report – IIR (ISPRA, 2025 [a]) provides details on the estimation methodology and input data, as well as emission data, trend analysis, key source categories, quality assurance and control activities, and the planned improvements to the inventory.
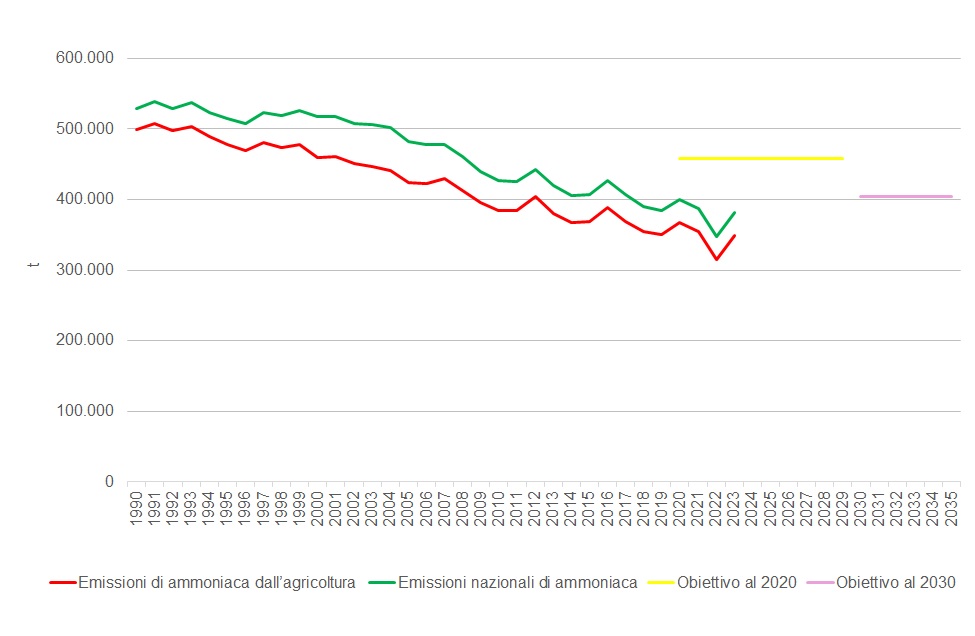
The NEC Directive (2016/2284) set a national ammonia emission reduction target of 5% for each year from 2020 to 2029, and 16% from 2030 onwards, compared to 2005 levels. For Italy, the target for 2023 is 457.74 kt of national ammonia emissions, while the 2030 target is 404.74 kt. In 2023, the agriculture sector was responsible for emitting 349.23 kt of NH₃ into the atmosphere, accounting for 91.4% of the national total (Table 1). This corresponds to an 18% reduction compared to 2005, thus making a significant contribution towards meeting the set target.
In 2023, ammonia emissions from the agriculture sector decreased by approximately 18% compared to 2005. Over the longer period from 1990 to 2023, emissions fell by 30.1%, from 499.89 kt to 349.23 kt (Figure 1). Since 1990, this reduction has been mainly attributed to the decline in the number of livestock for certain animal categories, the reduced use of synthetic nitrogen fertilisers, the decrease in agricultural land and production, and the adoption of emission abatement techniques in livestock management.
| Allegati |
|---|
Thumbnail
Titolo
Figure 1: Ammonia emissions trend Fonte
ISPRA |
Thumbnail
Titolo
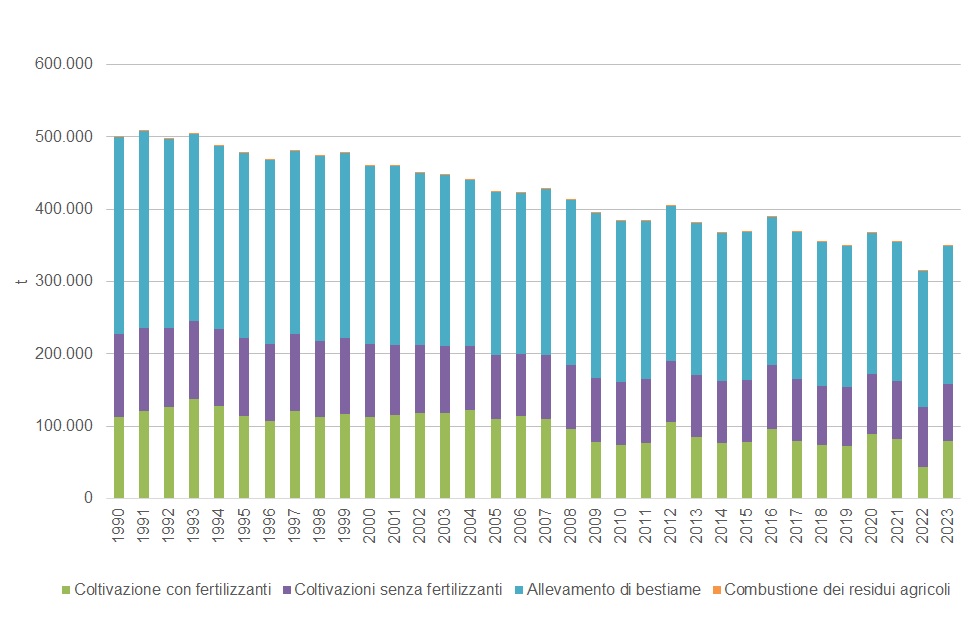
Figure 2: Trend of ammonia (NH₃) emissions from agriculture by source Fonte
ISPRA |
Titolo
Table 1: Agricultural ammonia emissions trend by source Fonte
ISPRA Legenda
|
In 2023, ammonia emissions from agriculture increased by 11% compared to the previous year, mainly due to a rise in emissions from the use of synthetic fertilisers, which accounted for 81.5% of the overall increase (Figure 2).
The year-to-year variability of ammonia emissions from synthetic fertiliser use is entirely determined by data provided by the Italian National Institute of Statistics (ISTAT) on the quantities of fertilisers sold at national level. It is assumed that these fertilisers are applied to agricultural soils and that emissions are proportional to their nitrogen content.
In 2023, the largest source of agricultural ammonia emissions was livestock management (housing and storage), which accounted for 54% of total NH₃ emissions from agriculture. Other significant sources (Figure 3) included: land application of manure (15.1%), application of synthetic nitrogen fertilisers (22.8%), grazing and biological nitrogen fixation by leguminous plants contributing to emissions from “fertiliser-free soils” (3.8%), other organic fertilisers (2.5%), spreading of sewage sludge (0.3%), agricultural residue burning (0.1%), and crop residue decomposition (1.0%).