Gabriella Aragona, Lucia Muto
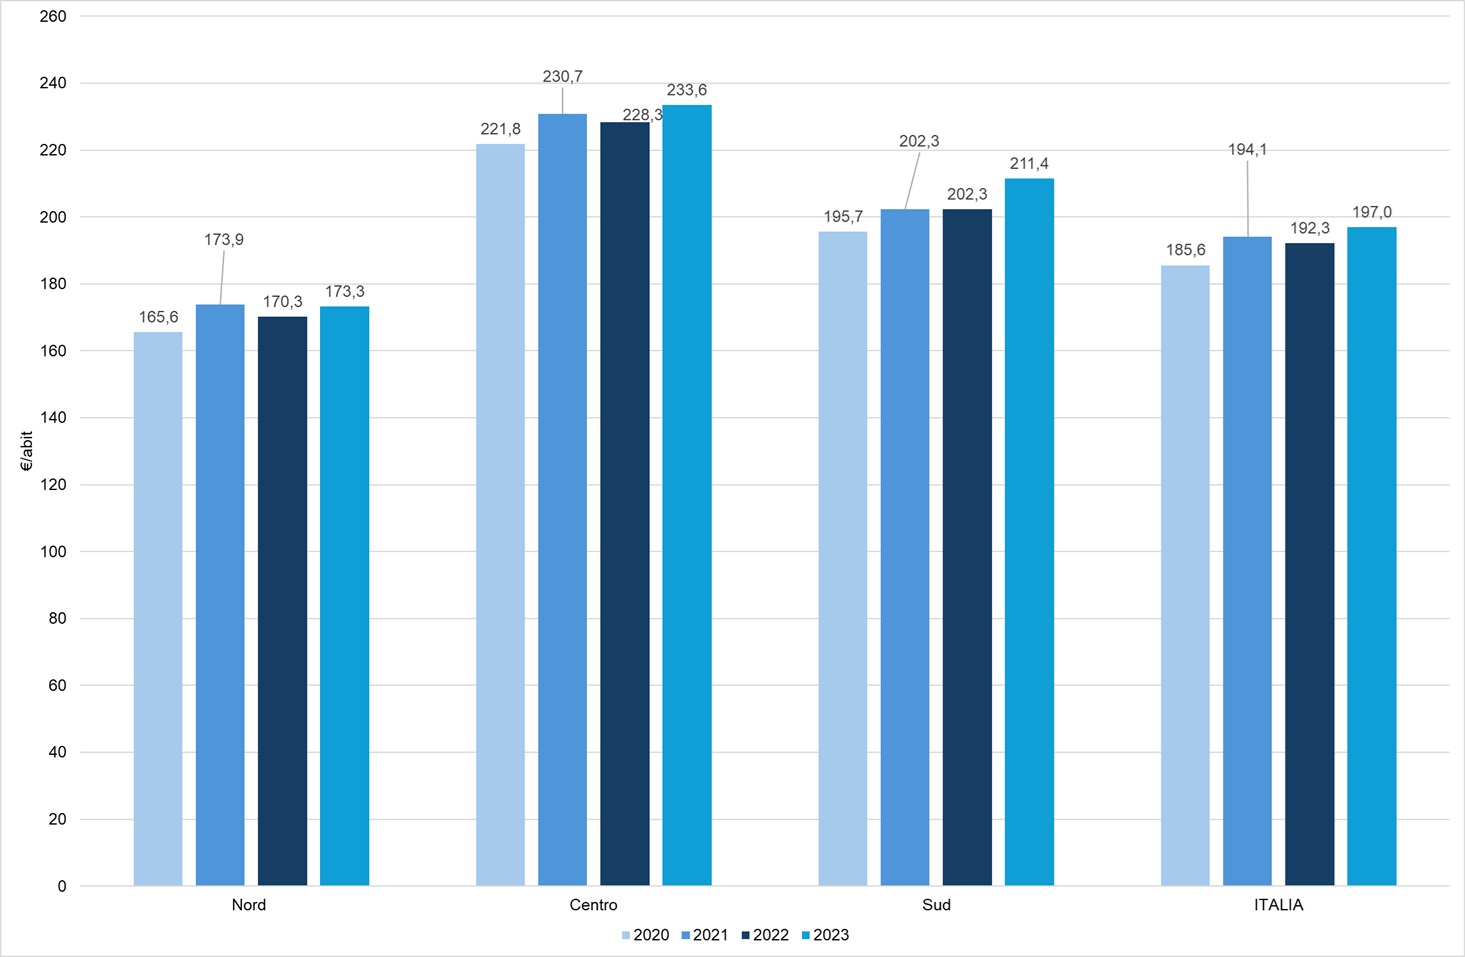
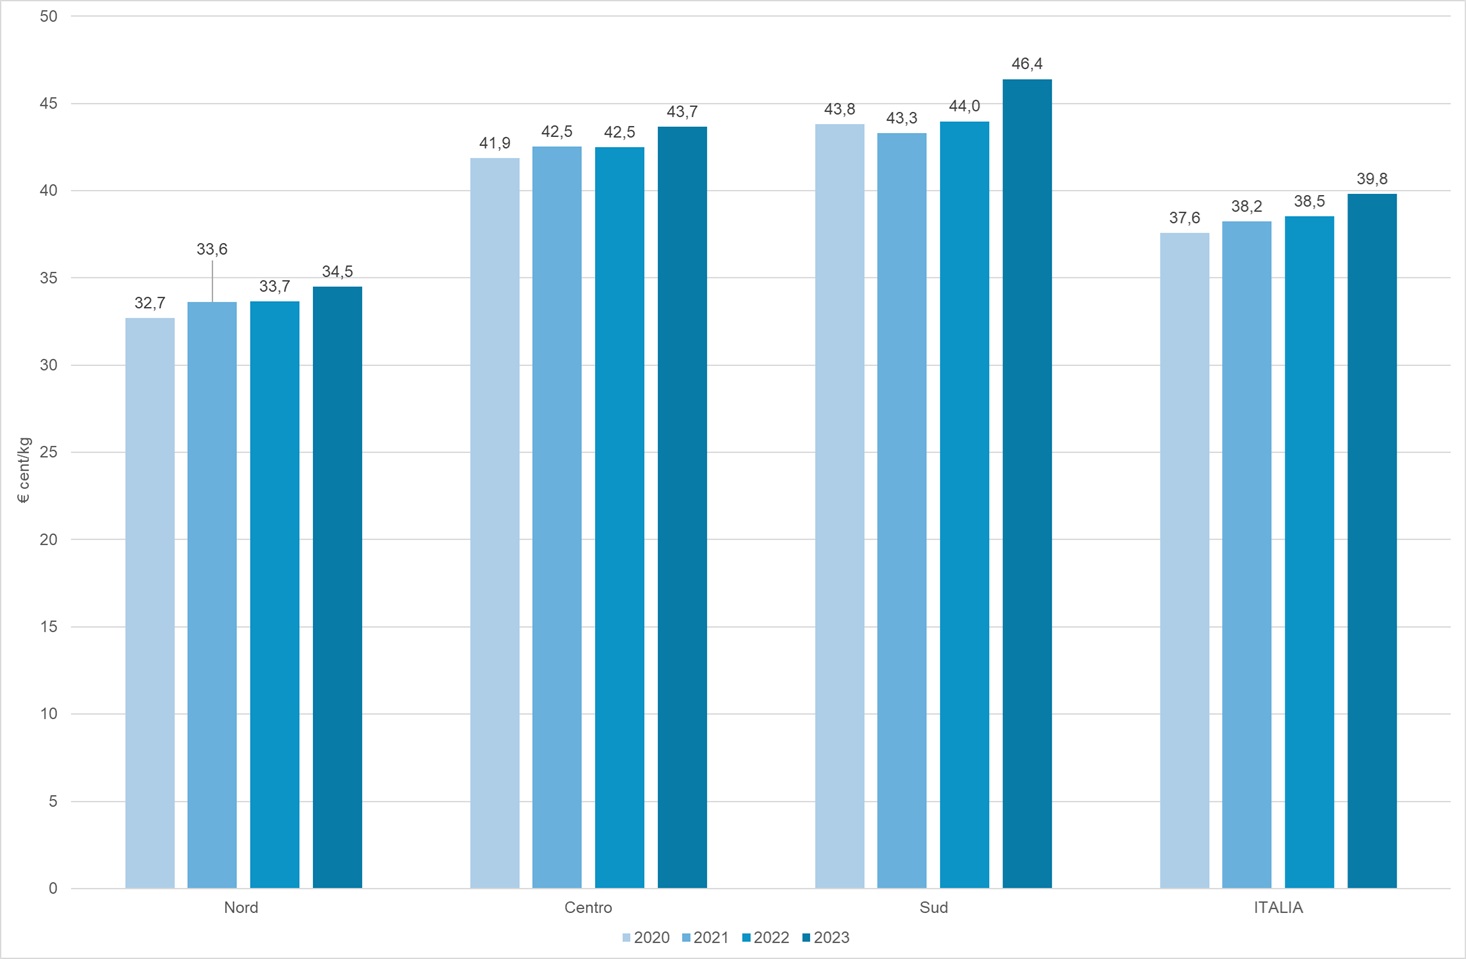
The indicator measures the national average cost incurred by municipalities to provide urban sanitation services, expressed per capita and per kilogram of municipal waste generated. In 2023, the average annual management cost was €197.0 per inhabitant and €0.398 per kilogram of municipal waste produced.
At the macro-regional level, the highest annual per capita service cost was recorded in Central Italy, amounting to €233.6 per inhabitant (€0.437/kg), followed by Southern Italy at €211.4 per inhabitant (€0.464/kg), and Northern Italy at €173.3 per inhabitant (€0.345/kg).
The indicator measures the average national management cost for urban hygiene services incurred by municipalities, expressed per capita and per kilogram of waste. The data analysis is conducted on a sample of municipalities, which for 2022 consisted of 6,090 municipalities, covering 77% of the total.
To assess the effectiveness of waste management policies in Italy, particularly regarding the revenue from energy and material recovery, we can examine several key indicators and economic instruments in place.
The Legislative Decree 152/2006, Article 238, paragraph 1, establishes that anyone who owns or holds, for any reason, premises or uncovered areas for private or public use, not constituting an accessory or an appurtenance of the premises themselves, located in areas of the municipal territory that produce municipal waste, is required to pay a fee. The fee constitutes the payment for the provision of the waste collection, recovery, and disposal service.
The Presidential Decree 158/99 is a regulation containing the rules for the elaboration of the standardized method to define the tariff for the management service of municipal waste cycles.
Law 205 of 2017, Article 1, paragraph 527, assigned to the Regulatory Authority for Energy, Networks, and Environment (ARERA) the functions of regulation and control regarding municipal and similar waste. With Resolution 443 of 2019, the Authority adopted the Waste Tariff Method (MTR), which includes the criteria for recognizing the efficient operating and investment costs of the integrated waste service for the period 2018-2021. Subsequently, with Resolution 363/2021, the Authority adopted the Waste Tariff Method (MTR-2) for the Second Regulatory Period 2022-2025.
Rapporto rifiuti urbani - Edizione 2024
ISPRA
Modello Unico di dichiarazione Ambientale MUD ISPRA - Catasto rifiuti (http://www.catasto-rifiuti.isprambiente.it)
National, regional
2020-2023
The indicator is constructed by summing the cost of individual items reported in the CG form of the "Urban Waste Communication" section of the MUD, submitted annually by the obligated entities (municipalities, their consortia, municipal unions, and other public and private operators), and then this value is related to the population and the amount of urban waste produced. The CG form reports the data from the Economic and Financial Plan - PEF - (Title VI of the MTR in Resolution 443/2019, as supplemented by resolutions 238/2020, 493/2020, and 363/2021).
The CG forms are thoroughly verified to ensure a representative sample of municipalities at the national level.
In 2023, the average annual waste management cost amounted to €197.0 per inhabitant, marking a 2.5% increase compared to 2022. The cost per kilogram of municipal waste produced was €0.398, reflecting a 0.7% rise from the previous year.
Between 2020 and 2023, the per capita waste management cost increased by 6.2%, outpacing the growth in per capita municipal waste generation over the same period, which rose by 1.5% compared to 2020.
| Data |
|---|
Thumbnail
Headline
Figura 1: Costo medio nazionale e per macro-area sostenuto dai comuni per l’erogazione dei servizi di igiene urbana, per abitante Data source
ISPRA |
Thumbnail
Headline
Figura 2: Costo medio nazionale e per macro-area sostenuto dai comuni per l’erogazione dei servizi di igiene urbana, per chilogrammo di rifiuti urbani prodotti Data source
ISPRA Data legend
€ cent/kg = centesimi di euro per chilogrammo |
Thumbnail
Headline
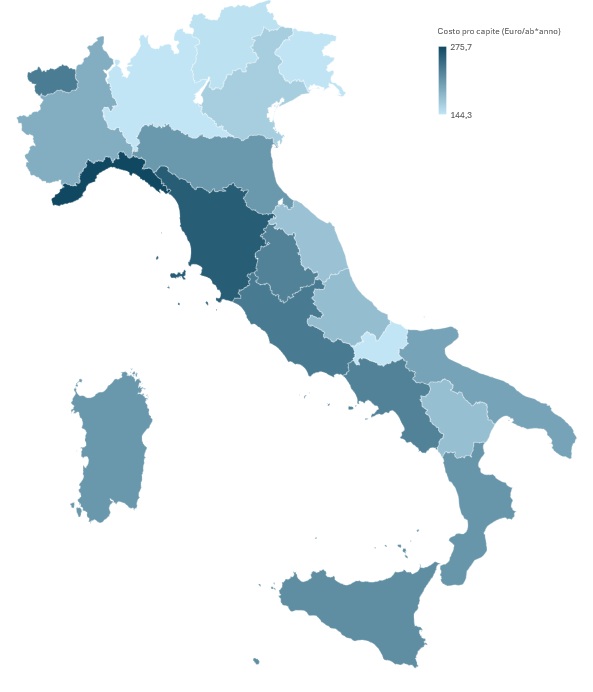
Figura 3: Costo medio procapite regionale sostenuto dai comuni per l’erogazione dei servizi di igiene urbana (2023) Data source
Analisi a cura di ISPRA su dati ISPRA e Istat |
Thumbnail
Headline
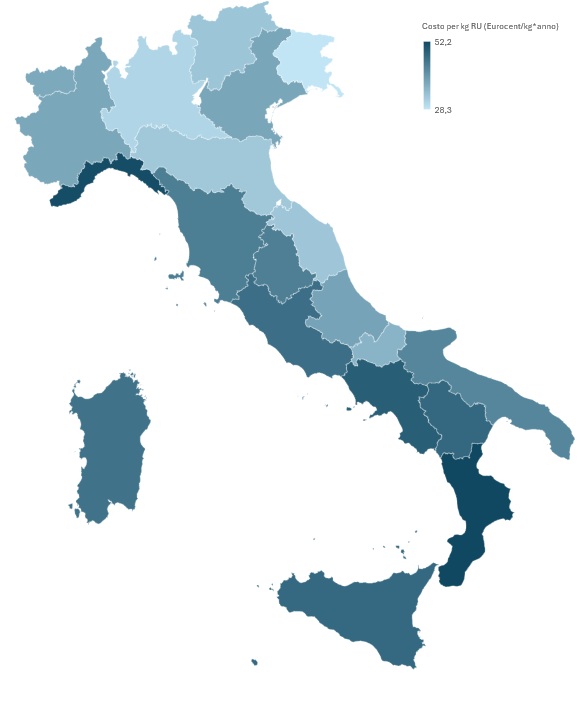
Figura 4: Costo medio regionale sostenuto dai comuni per l’erogazione dei servizi di igiene urbana, per chilogrammo di rifiuti urbani prodotti (2023) Data source
ISPRA Data legend
€ cent/kg = centesimi di euro per chilogrammo |
At the macro-geographical area level, the annual per capita total cost of the service is highest in Central Italy, at €233.6 per inhabitant (€0.437 per kg), followed by Southern Italy at €211.4 per inhabitant (€0.464 per kg), and Northern Italy at €173.3 per inhabitant (€0.345 per kg) (Tables 1 and 2, Figures 1 and 2).
In the North, the average cost per inhabitant is €23.7 lower than the national average, whereas in the South and Centre it is higher than the national average by €14.4 and €36.6 per inhabitant, respectively. Similarly, when considering the cost per kilogram of waste produced, the North shows a value €0.053/kg lower than the national average, while in the Centre and South, the cost per kg is higher than the national average by €0.038/kg and €0.066/kg, respectively.
It should be noted that the costs borne by municipalities for municipal waste management are influenced by various factors, such as the distance to treatment facilities, which is also related to the orographic characteristics of the municipality, as well as tourist influx. Cost analysis shows that municipalities with a strong tourism vocation exhibit higher service management costs compared to the national average. Likewise, for islands—especially smaller ones—a greater impact of transport costs (necessarily maritime) and distance from facilities has been observed.
In the North, the highest per capita costs are recorded in Liguria, which also stands out nationally as the region with the highest cost per inhabitant, at €275.7 (€0.515 per kg). In the Centre, the highest cost is observed in Tuscany at €258.1 per inhabitant (€0.440 per kg), while in the South, it is in Campania at €227.2 per inhabitant (€0.489 per kg) (Figures 3 and 4).
The lowest per capita costs are found in Lombardy in the North (€144.6 per inhabitant, €0.306 per kg), in the Marche in the Centre (€173.4 per inhabitant, €0.331 per kg), and in Molise in the South (€144.3 per inhabitant, €0.358 per kg) (Figures 3 and 4).