Panel 1
Antonella Bernetti, Antonio Caputo
The indicator assesses greenhouse gas emissions from the transport sector in order to verify the achievement of national and international targets. In 2023, transport accounted for 28.3% of total greenhouse gas emissions in Italy.
Between 1990 and 2019, emissions from the transport sector (excluding international transport/bunkers) increased by 4.0%. In 2020, a significant decrease was observed (-18.6% compared to 2019), primarily due to mobility restrictions related to the COVID-19 pandemic. Subsequently, between 2020 and 2021, emissions rose by 18.9%. In 2023, a return to pre-pandemic levels was confirmed.
Overall, transport sector emissions increased by 6.7% from 1990 to 2023. The national transport system continues to face various critical issues and remains far from meeting the ambitious 2030 and 2050 European targets for greenhouse gas emission reductions.
Rising atmospheric concentrations of greenhouse gases are causing significant changes in global temperatures and the Earth’s climate, with potential adverse effects on ecosystems, human settlements, agriculture, and socio-economic activities.
The indicator considers emissions of the three main greenhouse gases: carbon dioxide (CO₂), methane (CH₄), and nitrous oxide (N₂O). Other regulated greenhouse gases (hydrofluorocarbons, perfluorocarbons, and sulfur hexafluoride) are not relevant to the transport sector.
To assess greenhouse gas emissions from the transport sector in order to verify compliance with national and international reduction targets.
The United Nations Framework Convention on Climate Change (UNFCCC), signed in New York on 9 May 1992, was ratified in Italy by Law No. 65/1994. The Kyoto Protocol, linked to the UNFCCC and signed in Kyoto on 11 December 1997, was ratified by Law No. 120/2002. It establishes a target of reducing total greenhouse gas emissions by 6.5% compared to 1990 levels within the commitment period 2008–2012. In Italy, the Italian Institute for Environmental Protection and Research (ISPRA), on behalf of the Ministry for the Environment and the Protection of Land and Sea, is responsible for preparing and annually updating the national greenhouse gas inventory in accordance with the required formats. This is carried out in line with Legislative Decree No. 51/2008 and Legislative Decree No. 30/2013, which establish a National System for the inventory of greenhouse gas emissions.
The White Paper on transport, including international aviation but excluding international shipping, sets a target to reduce greenhouse gas emissions by 20% by 2030 compared to 2008 levels, and by 60% by 2050 compared to 1990 levels. Furthermore, the White Paper establishes the following objectives: the achievement of CO₂-free urban logistics in major urban centres by 2030; and, at the European level, a 40% reduction of CO₂ emissions from maritime bunker fuels by 2050 compared to 2005.
A new global agreement was reached in Paris in December 2015, applicable to the post-2020 period. The agreement aims to strengthen the global response to the threat of climate change by keeping the increase in global average temperature well below 2 °C above pre-industrial levels, while pursuing efforts to limit the temperature rise to 1.5 °C. The Paris Agreement entered into force on 4 November 2016.
To address the gap for the period 2013–2020, the Doha Amendment to the Kyoto Protocol was adopted on 8 December 2012. The EU and its Member States committed to this second phase of the Kyoto Protocol and agreed to reduce their collective emissions by 20% below 1990 levels or another base year. Italy ratified and implemented the Doha Amendment through Law No. 79/2016, which also defined a national low-carbon development strategy, established a National System for policies, measures and projections, and set out provisions for monitoring and communicating greenhouse gas emissions and climate change-related information.
Considering overall emissions from sectors not covered by the EU Emissions Trading Scheme (EU ETS)—including transport, residential, agriculture, and waste—the Italian reduction targets for 2020 and 2030 are established by the Effort Sharing Decision (Decision No. 406/2009) and the Effort Sharing Regulation (Regulation EU 2018/842), respectively. These targets are set at -13% and -33% compared to 2005 greenhouse gas emission levels.
Directive 2009/30/EC on fuel quality requires a minimum 6% reduction in the greenhouse gas intensity of transport fuels by 2020. With regard to the reduction of CO₂ emissions from vehicles, the targets for 2015 for passenger cars (Regulation EC No. 443/2009) and for 2017 for light commercial vehicles (Regulation EU No. 510/2011) were achieved already in 2013.
On 17 April 2019, the European Parliament and the Council adopted Regulation EU 2019/631, establishing new CO₂ emission performance standards for cars and vans. The regulation has been in effect since 1 January 2020. Regulation EU 2019/1242, which sets CO₂ emission standards for heavy-duty vehicles, entered into force on 14 August 2019.
The 2030 Climate and Energy Framework outlines EU-wide policy objectives for the period 2021–2030. Its key targets for 2030 include: at least a 40% reduction in greenhouse gas emissions compared to 1990 levels; a minimum 32% share of renewable energy; and an improvement in energy efficiency of at least 32.5%. The framework was adopted by the European Council in October 2014, and the targets on renewable energy and energy efficiency were revised upward in 2018.
Regulation EU 2018/1999 on the governance of the Energy Union and Climate Action sets out mechanisms and procedures to achieve the Union’s energy and climate objectives for 2030. Directive EU 2018/2001 establishes a common framework for the promotion of energy from renewable sources, setting a binding overall target. Member States must collectively ensure that the share of energy from renewable sources in the Union’s gross final energy consumption is at least 32% by 2030. To this end, they are required to set national contributions as part of their integrated national energy and climate plans in accordance with Regulation EU 2018/1999.
The European Green Deal (European Commission, 2019) foresees an acceleration of the transition towards sustainable and smart mobility. Among its key climate neutrality targets for 2050 are: a 90% reduction in greenhouse gas emissions from the transport sector compared to 1990 levels; a strengthening of multimodality, in particular by increasing freight transport via rail and inland waterways—being the least carbon-intensive motorised transport modes; and the expansion of the production and use of sustainable alternative fuels for the transport sector.
In alignment with the EU’s objective of achieving climate neutrality by 2050 and reducing net greenhouse gas emissions by at least 55% by 2030 compared to 1990 levels (the “Fit for 55” package), the revision of the Effort Sharing Regulation (ESR), formally adopted by the European Council in March 2023, updated the national reduction targets for 2030 in non-ETS sectors such as transport, buildings, agriculture, and waste. For Italy, the revised 2030 target has been set at -43.7%.
Panel 2
European Commission, Communication from the Commission to the European Parliament, the Council, the European Economic and Social Committee and the Committee of the Regions “A Roadmap for moving to a competitive low carbon economy in 2050,” COM(2011) 112, 8 March 2011
European Commission, Energy Roadmap 2050 (COM(2011) 885/2)
European Commission, The European Green Deal, COM(2019) 640 final
European Commission, White Paper on the Future of Europe - Reflections and scenarios for the EU27 by 2025, COM(2017)2025 of 1 March 2017
European Commission, White Paper “Roadmap to a Single European Transport Area – Towards a competitive and resource efficient transport system,” COM(2011) 144, 28 March 2011
EEA, European Environment Agency, Monitoring CO2 emissions from passenger cars, various years, https://www.eea.europa.eu/data-and-maps/data/co2-cars-emission-20
EEA, Database on annual greenhouse gas emissions by Member State and category, https://www.eea.europa.eu/data-and-maps/data/data-viewers/greenhouse-gases-viewer
IPCC, 2006 IPCC Guidelines for National Greenhouse Gas Inventories, 2006
ISPRA, National Air Emissions Inventory, 2025, https://emissioni.sina.isprambiente.it/inventario-nazionale/
ISPRA, Italian Greenhouse Gas Inventory 1990-2023, National Inventory Report 2025, Reports 411/2025
MASE, Integrated National Energy and Climate Plan (PNIEC) 2024, revised version 1 July 2024, https://www.mase.gov.it/portale/documents/d/guest/pniec_2024_revfin_01072024-errata-corrige-pulito-pdf
MASE, MIMIT, National Energy Balance, various years, https://dgsaie.mise.gov.it/ben.php
MIMIT, Guide to Fuel Savings and CO2 Emissions, various years, https://www.mise.gov.it/index.php/it/mercato-e-consumatori/qualita-di-prodotti-e-servizi/auto-ed-emissioni-co2
UNFCCC, Database on annual greenhouse gas emissions by country and category, https://di.unfccc.int/detailed_data_by_party
-
Data quality assessment
EEA (European Environmental Agency) ISPRA (Istituto Superiore per la Protezione e la Ricerca Ambientale) UNFCCC
European Environment Agency. (2024). Annual greenhouse gas emissions by member state [Data viewer]. https://www.eea.europa.eu/data-and-maps/data/data-viewers/greenhouse-gases-viewer
Italian National Institute for Environmental Protection and Research, Data and publications on historical emissions time series, https://emissioni.sina.isprambiente.it/inventario-nazionale/
United Nations Framework Convention on Climate Change, Database on annual greenhouse gas emissions by country and category, https://di.unfccc.int/detailed_data_by_party
National
1990 - 2023
Indicator assessment
The estimation of greenhouse gas emissions, as required by the UN Framework Convention on Climate Change (UNFCCC), is performed starting from energy consumption data using appropriate emission factors and applying sophisticated algorithms. Harmonized calculation models at the European level are employed. Emissions are calculated according to the IPCC Guidelines under the Convention and refer solely to domestic transport, excluding international bunker emissions.
A poor assessment is assigned to the current status due to persistent critical issues in the national transport system, which remains far from meeting the ambitious 2030 and 2050 European targets for greenhouse gas (GHG) emission reductions. In Italy, GHG emissions from the transport sector in 2022 accounted for 28.3% of total national emissions (Table 1). Along with energy industries, transport remains one of the main emitting sectors.
Road transport continues to be the dominant mode and is still largely reliant on fossil fuels. Although air transport has experienced strong growth in recent years, it accounted for only 2.2% of total transport-related emissions in 2023 (data not shown in table). In 2023, 66.9% of CO₂ emissions from the transport sector originated from passenger transport. Road transport (passenger and freight combined) accounted for 92.6% of total sector emissions (Table 2).
Despite a 15.1% reduction compared to 2005, GHG emissions from the transport sector amounted to 108,993.8 kt CO₂ eq in 2023. The 2030 reduction target for Italy, as established by the Effort Sharing Regulation (EU) 2023/857, is -43.7% compared to 2005 levels for total emissions from the sectors covered: agriculture, buildings, waste, transport, and industrial plants not included in the EU Emissions Trading System (EU ETS).
In 2023, the share of transport emissions within the sectors covered by the Effort Sharing Regulation (see indicator “Greenhouse gas emissions in the ETS and ESD sectors”) was 39.5%. Therefore, the transport sector's contribution is essential for achieving the 2030 target.
A negative evaluation is assigned to the trend, as greenhouse gas emissions from the transport sector increased by 6.7% between 1990 and 2023 (Table 1). The temporal evolution reflects trends in fuel consumption: an increase up to 2007, followed by a decline, with the exception of rises recorded in 2014, 2018, 2019, 2021, and 2022.
The sector’s emissions trend fundamentally mirrors that of road transport, which represents the dominant share. The transport mode that shows the highest relative growth is air transport (data not shown in the table).
The sector’s evolution is attributable to the combined dynamics of passenger transport—largely dominated by private road vehicles—and freight transport, which remains primarily road-based. Both were impacted by the economic crisis beginning in 2007, although signs of recovery have emerged in recent years.
The observed increase in transport demand over the years, despite periods of economic downturn, has offset gains in vehicle energy efficiency and the increased use of lower-emission fuels.
At the EU27 level, transport sector emissions rose by approximately 18% between 1990 and 2023, despite decreases recorded during 2008–2013 and again in 2020. Notably, Eastern European countries show a more pronounced increase in transport emissions compared to Western Europe (Table 3).
Data
Table 1: Greenhouse gas emissions from the transport sector by type of gas and share of transport in the total (excluding international aviation and maritime bunkers)
ISPRA
The data are taken from the National Greenhouse Gas Emissions Inventory reported under the UNFCCC framework. The figures refer to total national emissions net of removals from the LULUCF sector (Land Use, Land-Use Change and Forestry). The historical series has been recalculated from 1990 based on methodological updates adopted in the IPCC sectoral estimation approach.
Table 2: CO₂ emission percentages by type of traffic and mode of transport (excluding international aviation and shipping)
ISPRA
The data are taken from the National Air Emissions Inventory reported under the United Nations Framework Convention on Climate Change (UNFCCC). The reference is to transport activities falling under national responsibility in terms of greenhouse gas emissions. The historical series has been recalculated in line with the annual update of the Inventory.
Table 3: Greenhouse gas emissions from the transport sector in other countries
European Environment Agency; UNFCCC
Greenhouse gas emissions from the transport sector, as reported by countries under the UNFCCC and the EU Greenhouse Gas Monitoring Mechanism (MMR). In addition to European countries, for comparison purposes, emission data are also provided for China (latest data from 2014), the Russian Federation, Japan, and the United States.
For EU Member States, the data refer to greenhouse gas emissions reported under the EU MMR Regulation as well as under the UNFCCC framework. The United Kingdom and Iceland also report their greenhouse gas inventories to the EU under the MMR, and their inventories are included in the EU inventory submitted under the UNFCCC.
As members of the European Environment Agency (EEA), the inventories of Norway, Liechtenstein, Switzerland, and Turkey are also included. The EU-27 aggregate (the current European Union, referring to the inventories of the 27 Member States) is reported as well.
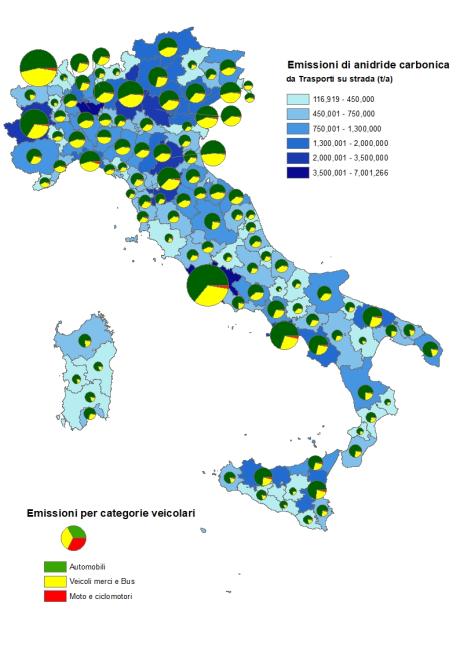
Figura 1: Emissioni di anidride carbonica dai trasporti su strada nel 2023
ISPRA
In 2023, in Italy, the transport sector accounted for 28.3% of total greenhouse gas (GHG) emissions (Table 1). Emissions from the sector (excluding international transport/bunkers) increased by 6.7% overall from 1990 to 2023: they rose by 4.0% between 1990 and 2019, dropped sharply in 2020 (-18.6%) due to the COVID-19 pandemic, and then increased by 18.9% between 2020 and 2021 and by 6.0% between 2021 and 2023.
Carbon dioxide emissions, which in 2023 made up 99.0% of total sectoral GHG emissions, are closely linked to energy consumption; the majority of these emissions originate from road transport. Most emissions related to air traffic come from international flights, i.e., flights connecting EU Member States or connecting a Member State with a third country.
However, the actual climate impact of aviation emissions is higher than that suggested by CO₂ alone, as air transport contributes to global warming by releasing water vapor at high altitudes, which can lead to the formation of contrails and cirrus clouds, with additional warming effects.
The reduction in overall methane emissions from transport is due to the combined effect of technological improvements—limiting volatile organic compound (VOC) emissions from vehicle exhaust—and the expansion of the two-wheeler fleet, which has led to an increase in emissions. It is important to note that Italy has a significant fleet of motorcycles and mopeds, only part of which complies with VOC emission limits (which include methane).
Nitrous oxide (N₂O) emissions are associated with vehicle technology and are linked to the use of catalytic converters.