Giovanni Finocchiaro, Silvia Iaccarino
The indicator allows us to quantify the accommodation capacity of hotels, complementary facilities, and bed and breakfasts in the area, as well as estimate the level of hotel occupancy. In the updated series, the net hotel occupancy rate stands at 53.3% in 2025, slightly down from 55.2% in 2024, but remains high compared to the historical series. Total accommodation capacity reaches approximately 7.7 million beds; the significant increase observed compared to the previous year primarily affects complementary facilities and must be interpreted with caution, taking into account the changes in coverage and classification of the surveyed facilities.
The indicator provides key information regarding tourism infrastructure, examining accommodation capacity in terms of number of establishments and beds, as well as density per km².
Accommodation facilities are classified into:
- Hotels, including hotels of all categories and tourist residences.
- Complementary facilities, including campsites and tourist villages, rental accommodations managed as businesses (holiday homes and apartments, guesthouses, accommodations in restaurants, furnished units for tourist use, residences, inns), agritourism lodgings (rural buildings offering accommodations to tourists by individual or associated agricultural entrepreneurs), and other facilities (youth hostels, holiday homes, mountain refuges, fixed bivouacs, hiking lodges, alpine shelters, high-altitude social refuges, and tourist guesthouses).
- Bed and breakfasts, which offer lodging and breakfast services for a limited number of rooms and/or beds.
The utilization rate of a facility during a given period, compared to its maximum potential, is estimated using the net utilization index, defined as the ratio between the number of overnight stays (P) recorded in hotels and the number of bed-days of actual operation (Ge), excluding closures due to seasonality, renovations, or temporary shutdowns.
The formula used is: I=GeP×100=ge×LP×100
where:
- Ge represents the number of bed-days of actual operation.
- ge represents the number of days the facility was open.
- L represents the number of available beds.
Quantify the accommodation capacity of hotels, complementary facilities, and bed and breakfasts in the area and their distribution.
The indicator has no direct references to specific regulatory elements.
Istat, various years, Tourism Statistics
Second Home Census
Istat (National Institute of Statistics)
National, Regional
1990-2025
beds (no.); net occupancy rate
The indicator is calculated using ratios, percentages, and variations. The net utilization index is given by the ratio between the number of overnight stays (P) recorded in hotels and the number of bed-days of actual operation (Ge). I=GeP×100=ge×LP×100
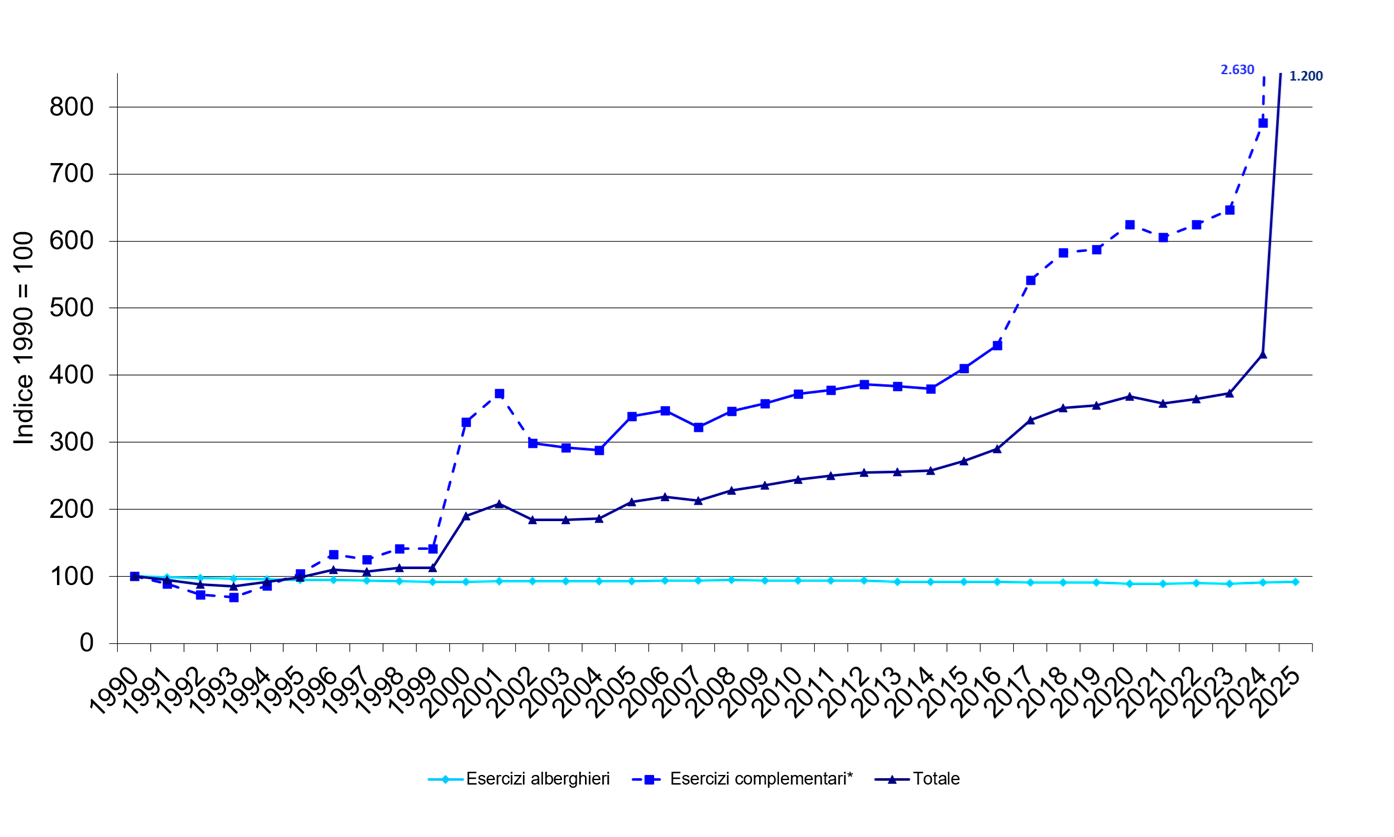
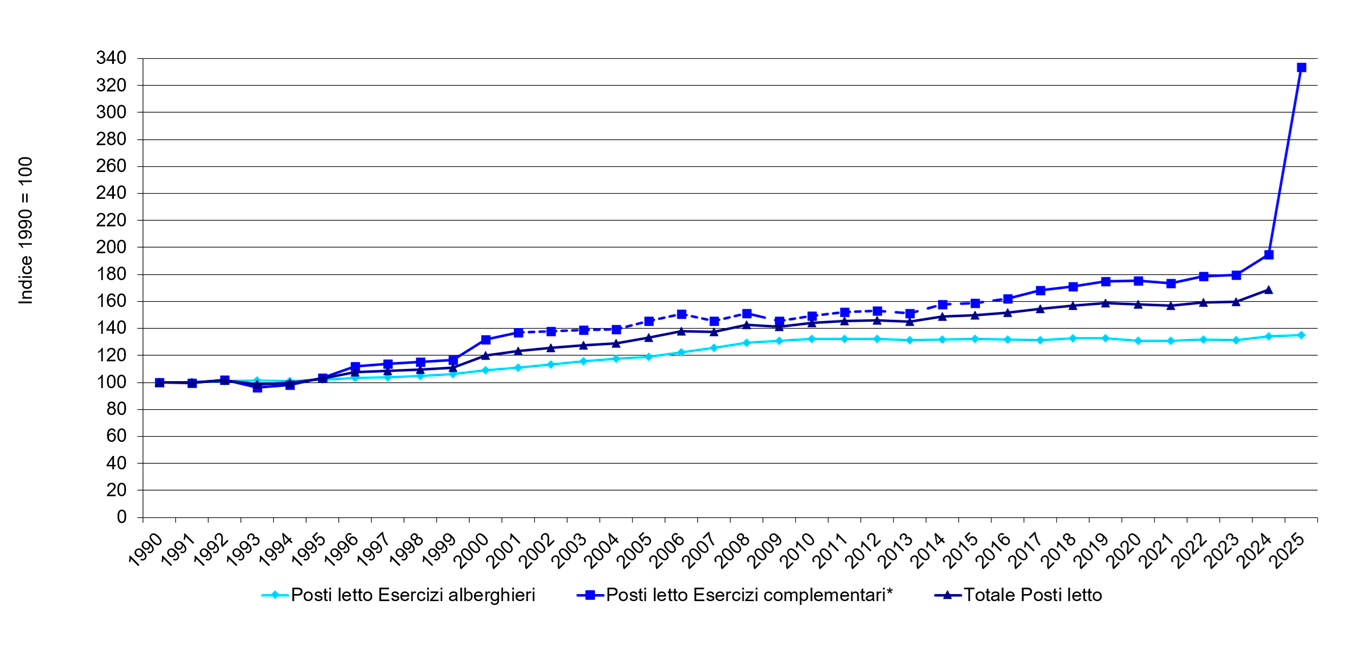
In 2025, tourism infrastructure increased substantially in terms of the total number of accommodation establishments, rising from approximately 265 thousand to approximately 739 thousand establishments, corresponding to an increase of 178.4%. The number of bed places increased from approximately 5.5 million to approximately 7.7 million, representing a 39.8% increase (Table 1).
The trend differed markedly by type of accommodation. Hotels recorded limited growth, with the number of establishments increasing by 1.0% and bed places by 0.7%. Bed and breakfasts increased by 6.8% in terms of establishments and by 5.0% in terms of bed places. The overall increase was instead driven mainly by complementary accommodation establishments, whose number increased by 190.1% and whose bed places rose by 71.3%.
From 2025 onwards, data on rented accommodation also include privately owned dwellings rented out on a non-business basis. Consequently, the figures for extra-hotel accommodation establishments and for total accommodation establishments are not directly comparable with those for previous years. Therefore, the changes recorded between 2024 and 2025 cannot be interpreted exclusively as an actual annual increase in accommodation supply.
The net hotel occupancy rate stood at 53.3% in 2025, decreasing by 1.9 percentage points from 55.2% in 2024, while remaining at a high level compared with the historical series (Table 5). The hotel sector therefore continued to make substantial use of its available capacity, although without maintaining the growth observed in the immediately preceding years.
Overall, the state can still be considered good, since the high occupancy rate of hotel establishments indicates relatively efficient use of the available capacity. This assessment should, however, be interpreted with caution, as the expansion of the statistical coverage of rented accommodation does not allow a homogeneous evaluation of the overall change in accommodation supply compared with 2024. From an environmental perspective, the overall picture does not indicate an unequivocal improvement but requires specific monitoring of the pressures associated with the expansion of extra-hotel accommodation.
During the homogeneous period 2002–2024, accommodation capacity increased at the national level. Overall bed-place density rose from 13.6 to 18.2 bed places per km², while the density of accommodation establishments increased from 0.38 to 0.88 establishments per km². Within the hotel sector, the density of establishments remained substantially stable at around 0.11 establishments per km², whereas bed-place density increased from 6.40 to 7.56 bed places per km². For complementary accommodation establishments, density increased from 0.25 to 0.65 establishments per km² and from 7.14 to 10.04 bed places per km² (Table 3).
The 2025 data introduce a break in the time series, as rented accommodation also includes privately owned dwellings rented out on a non-business basis. Consequently, the figures relating to complementary accommodation establishments and the overall total are not directly comparable with those for previous years and do not allow the entire observed increase to be attributed to actual growth in accommodation supply.
Considering the period 1990–2025, the number of hotel establishments declined overall by approximately 8%, while the corresponding number of bed places increased by approximately 35%, highlighting a progressive concentration of accommodation capacity in larger establishments. For total accommodation establishments, however, long-term comparisons should be limited to 2024 or accompanied by an explicit note regarding the methodological break introduced in 2025.
Overall, the trend is assessed as negative from an environmental perspective, since, over the comparable period, accommodation capacity increased together with its territorial density, with potential effects on resource consumption, waste generation, mobility and local services. The assessment for 2025 remains indicative because the change in the statistical coverage does not allow actual growth to be clearly distinguished from the expansion of statistical observation; nevertheless, the long-term trend does not move in the environmentally desirable direction.
| Allegati |
|---|
Titolo
Table 2: Tourism intensity by region: arrivals, presences, average stay in all accommodation establishments (2025) Fonte
ISPRA processing based on ISTAT data Legenda
Provisional data |
Titolo
Table 3: Density of accommodation establishments Fonte
ISPRA processing based on ISTAT data |
Titolo
Table 4: Density of accommodation facilities by region and autonomous province (2025) Fonte
ISPRA processing based on ISTAT data |
Titolo
Table 5: Net occupancy index of hotel establishments by region and autonomous province Fonte
ISPRA processing based on ISTAT data Legenda
a LAZIO: Data for the municipality of Rome has been replicated with those from the latest available year, months January-December. b LAZIO: Data for the province of Rome has been replicated with those from the latest available year, months January-December. c LAZIO: Data for the region has been replicated with those from the latest available year, months January-December. d SICILY: Data for the provinces of Messina and Ragusa has been replicated with those from the latest available year, months January-December. e SICILY: Data for the municipality of Palermo has been replicated with those from the latest available year, months January-December. f SARDINIA: Data for the provinces of Olbia-Tempio, Medio-Campidano, Ogliastra, and Carbonia-Iglesias has been replicated with those from the latest available year, months January-December. g ITALY: The calculation is affected by the previous notes a-b-c-d-e-f |
Titolo
Table 6: Regional hospitality index Fonte
ISPRA processing based on ISTAT data Legenda
* 2025 provisional population data |
Thumbnail
Titolo
Figure 1: Change in the number of hotels and complementary establishments Fonte
ISPRA processing based on ISTAT data Legenda
* From 2025, rental accommodation data will include privately rented accommodation in a non-business form; the values for non-hotel establishments and the total are therefore not comparable with previous years. Note
The dotted line relating to complementary establishments indicates the inclusion of Bed and Breakfasts in this type of establishment, up until 2001. |
Thumbnail
Titolo
Figure 2: Change in the number of beds in hotels and complementary establishments Fonte
ISPRA processing based on Istat data Legenda
* From 2025, rental accommodation data will include privately rented accommodation in a non-business form; the values for non-hotel establishments and the total are therefore not comparable with previous years. Note
The dotted line relating to complementary establishments indicates the exclusion of Bed and Breakfasts, which were included in this type of establishment until 2001. |
Titolo
Table 1: Capacity of hotels, complementary establishments and Bed and Breakfasts in Italy Fonte
ISPRA processing based on Istat data Legenda
a From 2025, rental accommodation data will include private accommodation rented on a non-business basis; the values for non-hotel establishments and the total are therefore not comparable with previous years; b Agro-tourism accommodations in the years 1990-1995 are included under "Other establishments"; c Youth hostels, holiday homes, mountain refuges, and similar. From 1990 to 1995, agro-tourism accommodations are also included; d From 2002, the "Bed and Breakfast" type is no longer included under "Other establishments" but is recorded separately; e Annual variations in the variables relating to the capacity of accommodation facilities may incorporate the spurious effect of extraordinary revisions of the accommodation establishment archives used by the peripheral tourism boards that provide the basic data. These revision and updating processes mainly concern "Rental accommodations", "Agro-tourism accommodations", and "Other accommodation facilities". |
The totals reported in the tables may show slight differences due to rounding. In 2025, national accommodation capacity reached 738,751 establishments and 7,687,036 bed places, corresponding to increases of 178.4% and 39.8%, respectively, compared with 2024 (Table 1). These changes should not, however, be interpreted as annual growth rates in the strict sense.
From 2025 onwards, data on rented accommodation include privately owned dwellings rented out on a non-business basis. This methodological break mainly affects the number of complementary accommodation establishments and, to a significant extent, their bed places. The recorded increase therefore reflects both the actual evolution of accommodation supply and the expansion of the statistical coverage. By contrast, for the hotel sector and for the categories unaffected by the methodological change, temporal comparisons remain more consistent.
For correct interpretation, 2025 should either be considered the starting year of a new time series for extra-hotel and total accommodation aggregates or always be accompanied by a note explaining the methodological break. Assessing the environmental implications of the new configuration of accommodation supply will require additional homogeneous years of data and territorial information on water and energy consumption, waste generation, mobility, and the pressures exerted on the destinations most affected.
Overall, the picture confirms the relative stability and high occupancy of the hotel sector, whereas, for complementary accommodation, 2025 primarily represents a change in the statistical coverage. It is therefore necessary to clearly distinguish the statistical increase in accommodation supply from its actual territorial expansion before drawing definitive conclusions regarding its environmental impacts.