Giovanni Finocchiaro, Silvia Iaccarino
The indicator quantifies the pressure of tourism on the urban waste management system in Italy. It currently represents a recognized proxy for the monitoring of Goal 12 of the 2030 Agenda (SDG 12.b.1). Since 2023, the methodology has been enriched by including not only the official overnight stays in accommodation establishments, but also stays in non-commercial lodgings (second homes, homes of friends or relatives) and same-day visits without overnight stay. The inclusion of these components allows for a more realistic and complete estimate of the equivalent tourist population and, therefore, of the amount of waste generated per equivalent inhabitant.
In 2023, the indicator reached 15.7 kg per equivalent inhabitant according to the new methodology, marking an increase of 53% compared to the value estimated with the traditional method (10.1 kg per equivalent inhabitant).
The indicator measures one of the most significant impacts of tourism, namely the increase in the production of urban waste, by estimating the per capita waste attributable to tourism through the comparison between the resident population and an equivalent tourist population. This indicator allows for the assessment of the pressure exerted by tourist flows on local waste management systems and represents a useful proxy for the monitoring of Goal 12 of the 2030 Agenda (SDG 12.b.1).
The indicator is obtained from the difference between the per capita production of urban waste calculated using the resident population and the per capita production of urban waste calculated instead using the “equivalent tourist population”, obtained by adding to the resident population the tourist overnight stays recorded during the year and distributed over 365 days.
Since 2019, in addition to the overnight stays in accommodation establishments in Italy by residents and foreigners (overnight stays), the following components have been added:
-
(a) overnight stays in non-commercial accommodations (second homes + homes of relatives/friends), both by Italian residents and foreigners;
-
(b) same-day visits carried out by foreigners and Italian residents in Italy.
The additional measures are estimated using the Bank of Italy’s International Tourism Survey for foreign visitors (inbound tourism) and ISTAT’s “Trips and Holidays” survey for Italian residents (domestic tourism).
Same-day visits (excursions) refer to tourism-related movements without overnight stay made by visitors (excursionists) for any purpose, excluding cross-border commuting and transit movements through borders.
Non-commercial accommodations refer to homes owned by tourists (second homes) and the homes of relatives and friends where the visitor stays free of charge.
To determine the impact of the tourism sector on municipal waste production.
There are no legal references or regulatory objectives related to this indicator.
EUROSTAT (2006) - Working Papers and Studies "Methodological work on measuring the sustainable development of tourism -Part 2 Holden, A., 2008. Environment and tourism, 2nd ed. ed, Routledge introductions to environment series. Routledge, London ; New York.
Despite the methodological extension, some limitations remain:
-
it is assumed that tourists and residents have the same average waste generation;
-
specific estimates for the waste generated in tourism access points (e.g. airports, ports) are missing;
-
the waste from commercial activities linked to tourism is not directly included in the indicator;
-
the estimate of stays in second homes and same-day visits is indirect and based on sample surveys.
Nevertheless, the indicator currently represents the most advanced available estimate, consistent with the SDG objectives and useful for regional and local policies in the field of waste management and tourism sustainability.
-
ISPRA
(Istituto Superiore per la Protezione e la Ricerca Ambientale) -
ISTAT – Italian National Institute of Statistics
(Istituto Nazionale di Statistica) -
Bank of Italy (Banca d’Italia)
http://www.catasto-rifiuti.isprambiente.it/
http://dati.istat.it/ "Servizi/Turismo"
National, Regional
2006-2023
Until 2018, the indicator was calculated according to the basic method:
(Waste produced per capita attributable to registered tourist movement = (Total waste / Resident population) - (Total waste / (Resident population + number of tourist overnight stays recorded during the year, distributed over 365 days)),
that is, considering the resident population and the official overnight stays recorded in accommodation establishments, distributed on an annual basis.
Since 2019, an expanded methodology has been adopted, which includes:
-
Overnight stays in non-commercial lodgings (second homes, homes of relatives/friends);
-
Same-day visits without overnight stay (by both residents and foreigners).
The information is estimated from official sources: the ISTAT “Trips and Holidays” survey for residents and the Bank of Italy survey for international tourists.
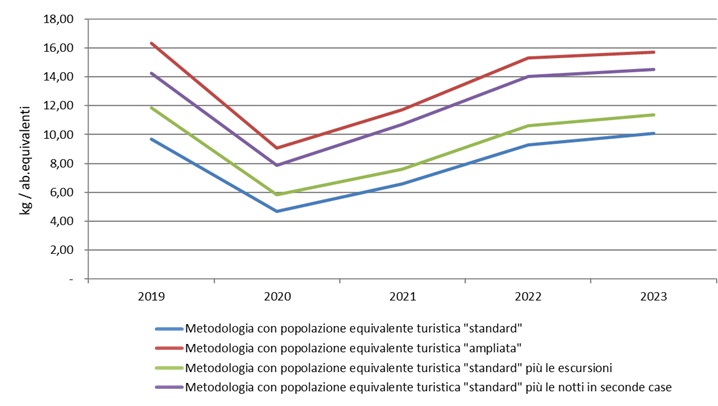
In 2023, the indicator calculated with the new methodology stands at 15.7 kg per equivalent inhabitant, registering an increase of 0.4 kg compared to 2022 (15.31 kg/eq. inhab.). This increase confirms a persistent and growing tourist pressure, even after the full post-pandemic recovery (Figure 1). From an environmental point of view, this data highlights a negative situation, as the tourism sector continues to contribute significantly to the production of urban waste, diverging from the objectives of prevention and reduction set by circular economy policies.
In the period 2006–2023, the indicator shows a non-uniform trend, also due to the methodological change that occurred in 2019. From 2006 to 2018, the data are calculated with the basic method (equivalent tourist population calculated using only official tourist overnight stays), while since 2019 an expanded method has been introduced, which also includes overnight stays in non-commercial lodgings and same-day visits. Therefore, the pre-2019 values are not fully comparable with the more recent ones (Table 1 and Figure 2).
Considering the new methodology, the period 2019–2023 shows a growing trend, going from 16.34 kg in 2019 to 15.7 kg in 2023, with an inevitable decline during the two-year pandemic period. From an environmental point of view, this trend highlights an increase in tourist pressure on the urban waste system, going against sustainability goals and indicating the need for more effective mitigation and prevention strategies (Figure 2).
| Allegati |
|---|
Titolo
Table 1: Regional distribution of per capita share of municipal waste attributable to tourism Fonte
ISPRA processing based on data from ISPRA, ISTAT, and the Bank of Italy
Note
Since 2019, the processing methodology has been improved; therefore, pre-2019 and post-2019 data are not comparable. |
Thumbnail
Titolo
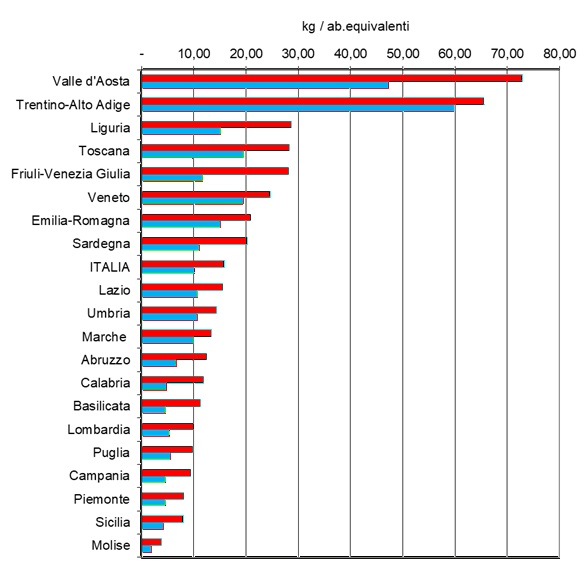
Figure 1: Regional distribution of the per capita share of municipal solid waste attributable to tourism: differences between the previous and the "expanded" methodology (2023) Fonte
ISPRA processing based on data from ISPRA, ISTAT, and the Bank of Italy |
Thumbnail
Titolo
Figure 2: National distribution of the per capita share of urban waste attributable to tourism: various contributions Fonte
ISPRA processing based on data from ISPRA, ISTAT, and the Bank of Italy |
In 2023, the national average value of the indicator is 15.7 kg per equivalent inhabitant, confirming a significant tourist pressure on urban waste production. The value, already high compared to the prevention and reduction targets, shows strong territorial differences (Table 1). Some regions far exceed the national average: Valle d’Aosta reaches 72.9 kg/eq. inhab., followed by Trentino-Alto Adige (65.5 kg/eq. inhab.) and six other regions. These regions, characterized by high levels of residential tourism and a high frequency of same-day visits, show a much more pronounced environmental impact (Figure 1).
This leads to the need for differentiated approaches in the planning of urban waste management. Regions with strong tourism seasonality and extensive use of second homes require targeted interventions to adapt waste collection services and improve prevention through awareness campaigns aimed at visitors and temporary residents.
As shown in Figure 3, in many regions the main contribution comes from nights spent in second homes and non-commercial hospitality, which in some cases exceed 50% of the total. Excursionism contributes in a more limited but stable way, while official stays remain important only in some regions. This reading confirms that the tourism pressure recorded with the expanded method is largely linked to forms of tourism that are less “visible” in traditional data.