UN - SDG Goals
Goal 2: Zero hunger
End hunger, achieve food security and improved nutrition, and promote sustainable agriculture.

The indicator takes into account the fertilizers distributed in agriculture, i.e. the technical inputs used essentially for the growth of agricultural crops. It analyses their territorial and temporal distribution, for an overall representation of the environmental impact based on the quantities and types of fertilizers placed on the market.
In 2024, over 4 million tons of fertilizers were placed on the market.
44.7% is made up of mineral fertilizers (simple, compound, based on meso and microelements), which have always been the best-selling type, with the only exception in 2022 and despite a negative propensity in their long-term distribution (2000 - 2024).
Organic fertilizers (soil improvers and organic fertilizers) follow, with a sales figure of 35.3% and a reversal in the propensity in long-term distribution, positive until the previous year (2000 - 2023).
The most popular category The largest share of fertilizers sold is that of simple minerals, with over 1.2 million tons (29.7% of total fertilizers). Their sales volume has fluctuated for several years, but their slight increase (compared to 2023) is more significant than the simultaneous decline in soil improvers, leading to a reversal of the prevalence of soil improvers in the last two years (a drop of over 250,000 tons, for a sales volume in 2024 of approximately 1 million tons).
The indicator describes ammonia (NH₃) emissions to the atmosphere from the agricultural sector, mainly resulting from livestock management and fertilizer use. It also assesses the sector's contribution to total national ammonia emissions and progress towards emission reduction targets.
In 2024, the agricultural sector emitted 323.5 kt of NH₃, accounting for 90.8% of total national ammonia emissions. With a 24% reduction compared with 2005, the sector is making a decisive contribution to achieving the emission reduction target.
The trend in NH₃ emissions is consistent with the reduction commitments established under the Gothenburg Protocol and the National Emission Ceilings (NEC) Directive.
The European strategy Farm to Fork sets two objectives to be achieved by 2030, which consist of reducing the use and risk of chemical pesticides by 50% and reducing the use of the most dangerous pesticides by 50%. In order to measure the progress made towards these objectives, two indicators have been defined based on the sales of active substances contained in plant protection products and on the dangerous properties of these substances. The indicators described represent the European and national trend of progress towards the pesticide reduction objectives of the strategy Farm to Fork. In 2023, the use and risk of chemical pesticides, both at European and national level, will be reduced, compared to the reference period 2015-2017, beyond the set target, with decreases corresponding to 58% and 64% respectively. As regards the use of the most dangerous pesticides, however, the trend towards the objective of 50% reduction is slower, in fact in 2023 the European reduction will reach 27%, that of Italy 29%.
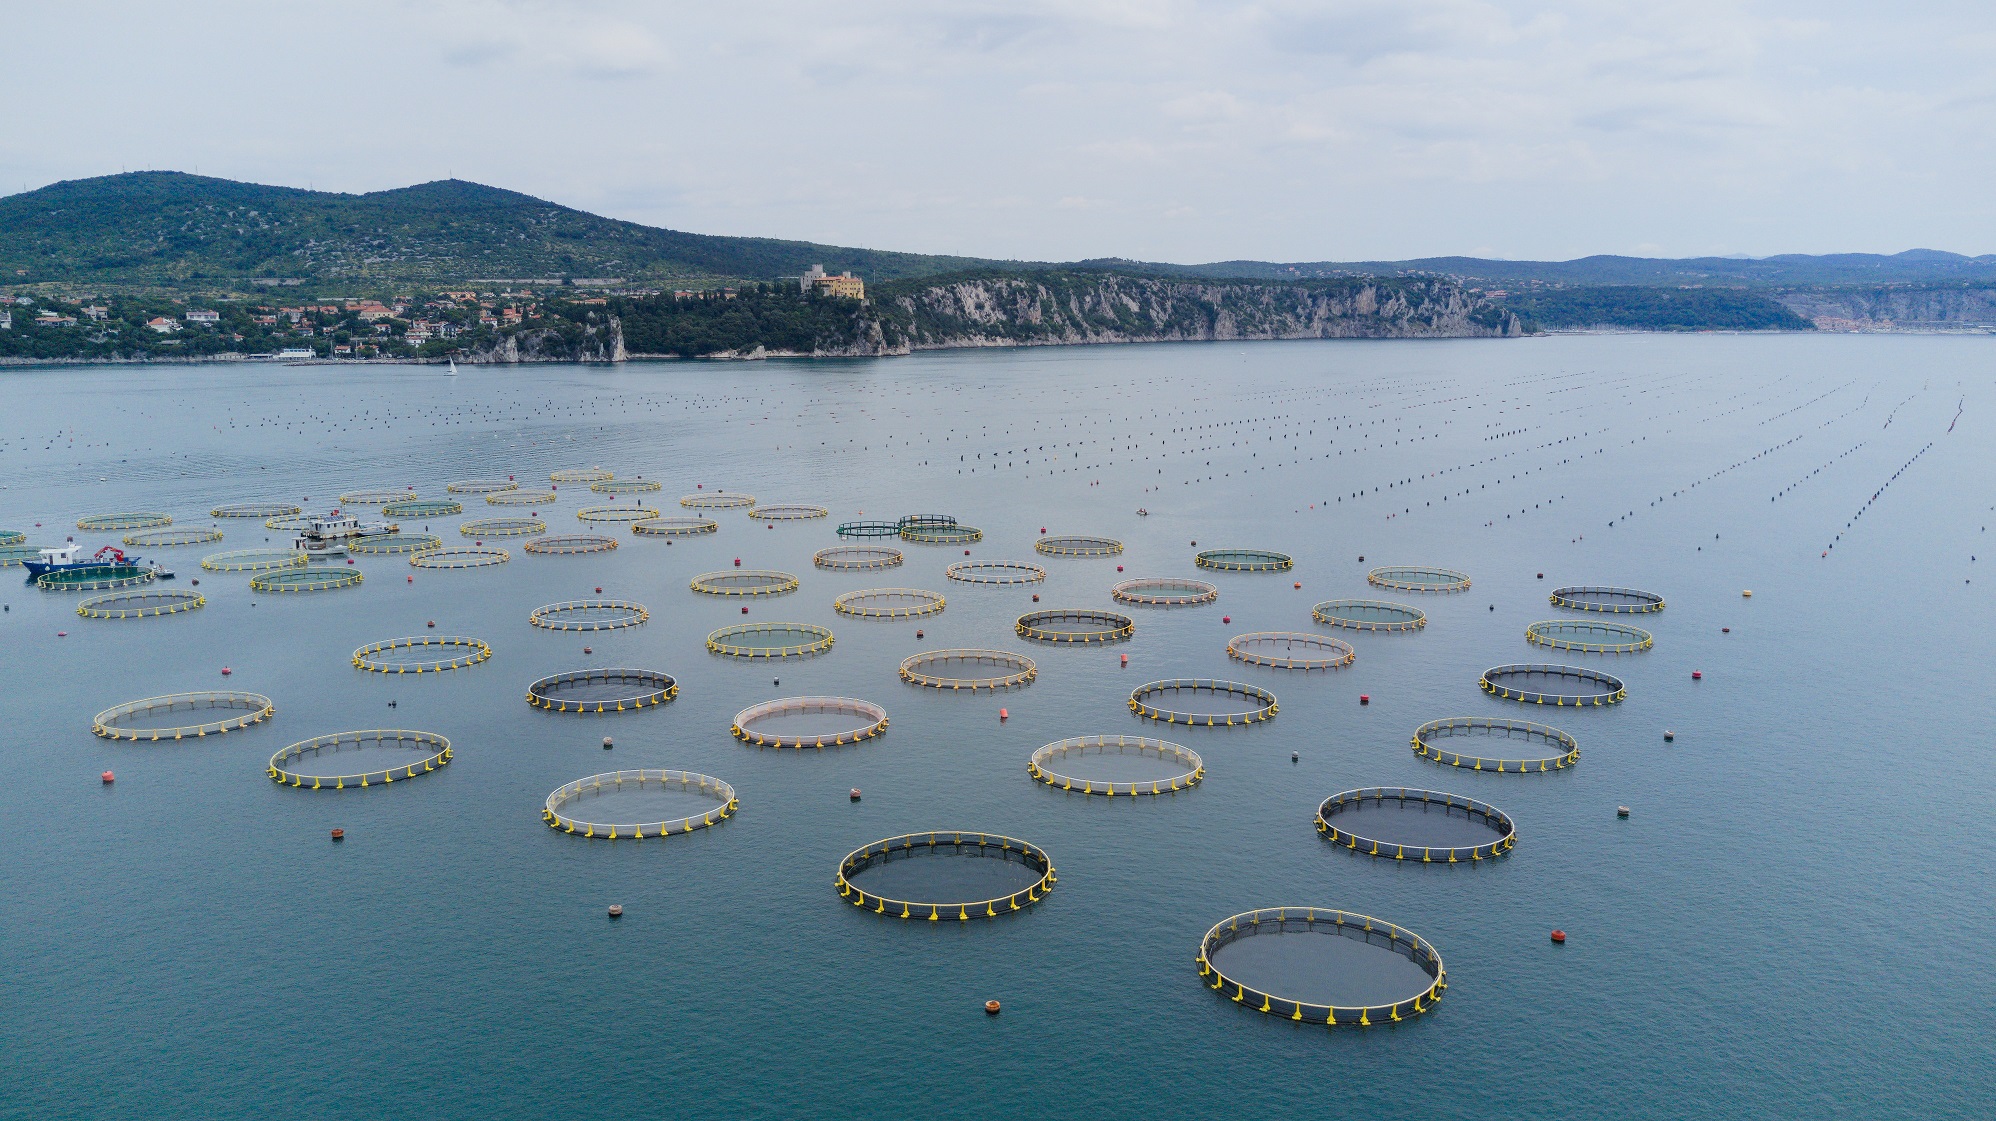
This indicator reports national scale data on the surface area and number of maritime state concession areas for aquaculture use as well as on Allocated Zones for Aquaculture (AZA). AZAs are designated by the competent authority as “Priority Areas for Aquaculture”, meaning areas free from conflicts with other uses and with environmental conditions suitable to ensure sustainable production while minimizing environmental impacts.
In Europe, identifying new marine areas for aquaculture is one of the main objectives of the Strategic Guidelines for a more sustainable and competitive EU aquaculture for 2021–2030 (COM/2021/236), of the National Strategic Aquaculture Plans 2014–2020 and 2021–2027, and of the corresponding EMFF and EMFAF Operational Programs, under Regulations 508/2014/EU and 1139/2021/EU.
The identification of AZAs is also part of the Maritime Spatial Planning (MSP) framework established by Directive 2014/89/EU, transposed into Italian law by Legislative Decree 201/2016, which supports the sustainable growth of maritime economies through a coordinated, integrated, and cross-border approach within Maritime Spatial Management Plans. These aquaculture planning processes are also relevant to climate change adaptation strategies needed to mitigate medium- and long-term sector impacts.
Italy’s maritime space, between the coastline and the 12-nautical-mile limit, covers approximately 14 million hectares. Of this area, only 20,250 hectares are currently occupied by state concessions for aquaculture use, with around 96% (19,445 ha) allocated to shellfish farming and only 3.9% (805 ha) to marine fish farming. As of April 2024, AZAs have been designated in Tuscany, Marche, Emilia-Romagna, Veneto, and Friuli-Venezia Giulia, for a total area of about 29,633 hectares. Within AZAs, 8,739 ha are occupied by shellfish farming and 665 ha by fish farming.
n 2023, organic farming in Italy covered 2,456,020 hectares, involving approximately 94,400 organic operators. Organic agriculture accounted for 7.4% of all farms and 19.8% of the utilised agricultural area (UAA), according to the 2021 ISTAT Census, falling 5.2 percentage points short of the 25% UAA target for organic farming.
Over the past 33 years, the trend has been upward in both the number of operators and cultivated area, countering the long-standing decline in utilised agricultural area in Italy.
At the European level, Italy ranks among the most virtuous Member States.