Giovanni Finocchiaro, Silvia Iaccarino, Mariangela Soraci
The indicator captures the evolution of low environmental impact technologies installed in newly constructed buildings in Italy from 2010 to 2023. Between 2010 and 2021, Italian buildings increasingly adopted photovoltaic systems and heat pumps, encouraged by EU incentives and regulatory obligations. However, installations decreased in 2022–2023, revealing the sector’s reliance on incentives. Uptake is highest in medium-sized municipalities, slower in large cities (roof constraints), and more limited in very small municipalities (weaker infrastructure). The use of condensing boilers collapsed, though it rebounded when incentives and hybrid systems were reintroduced. Stabilising the transition requires stable incentives for photovoltaics, upgraded electricity networks for heat pumps, and the definitive phase-out of gas boilers.
The indicator measures the diffusion of low environmental impact energy systems installed in new buildings for which a building permit was issued. These include photovoltaic systems, solar thermal systems, heat pumps, condensing boilers, geothermal systems, and other non-conventional solutions.
It aims to reflect the level of energy sustainability in the construction sector and to assess the degree of alignment with ecological transition and climate neutrality policies.
To monitor the penetration level of sustainable energy technologies in the construction sector, with a focus on their spatial distribution by urban density, in order to evaluate the effectiveness of energy and environmental policies supporting the ecological transition.
-
Directive 2010/31/EU – Energy Performance of Buildings Directive (EPBD)
-
Directive (EU) 2018/844 – Revision of the EPBD
-
Regulation (EU) 2021/1119 – European Climate Law (climate neutrality by 2050)
-
National Integrated Energy and Climate Plan (PNIEC) – Strategic plan for 2030
-
Long-Term Renovation Strategy (LTRS) – Pursuant to Directive 2018/844/EU
Istat
Istat – Statistiche sui permessi di costruire (vari anni) https://www.istat.it/tavole-di-dati/statistiche-sui-permessi-di-costruire-anno-2023/
National
2010 – 2023
The indicator considers the total number of new buildings equipped with each type of sustainable system reported by ISTAT. Both absolute values and percentages relative to the total number of newly constructed buildings per year can be calculated.
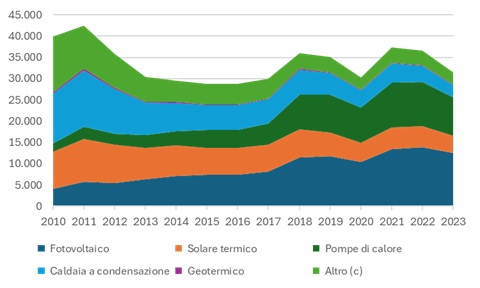
In 2023, there was a widespread decline in the adoption of sustainable energy systems in new buildings compared to 2022. Specifically, buildings with photovoltaic systems dropped from 13,852 to 12,482; those with heat pumps fell from 10,403 to 9,073. Solar thermal systems also declined significantly (from 5,024 to 4,056 buildings), as did condensing boilers (from 3,744 to 2,858), geothermal systems (–20 units), and “other” solutions (–525 units).
This generalized decrease across all technologies indicates a structural slowdown in the transition to sustainable building systems. It follows a positive period (2020–2022) heavily influenced by extraordinary incentives, particularly the Superbonus. The 2023 downturn confirms a systemic vulnerability: the adoption of sustainable technologies in new buildings is still highly dependent on the presence of public incentives. The simultaneous drop in all technologies suggests a lower impact of new constructions on improving the energy and environmental performance of the national building stock, justifying a negative evaluation.
Between 2010 and 2022, the indicator shows a generally positive trend in the adoption of sustainable technologies in new buildings, with steady growth in photovoltaic systems (from 492 to 1,492 units) and heat pumps (from 280 to 1,198 units – Table 1). The peak occurred in 2021–2022, driven by incentive policies like the 110% Superbonus.
However, 2023 saw a clear reversal: all major technologies—photovoltaic, heat pumps, solar thermal, and geothermal—declined compared to 2022. This slowdown reveals a structural fragility of a system still too dependent on temporary financial bonuses. While the long-term trend remains positive, the recent decline highlights a concerning discontinuity that could hinder environmental targets unless supported by stable and structural measures.
| Data |
|---|
Headline
Table 1: New residential buildings by type of system and municipality class Data source
ISPRA processing based on ISTAT data Data legend
(a) "Other" refers to systems not included among the listed types |
Thumbnail
Headline
Figure 1: New residential buildings by type of system Data source
ISPRA processing based on ISTAT data |
Thumbnail
Headline
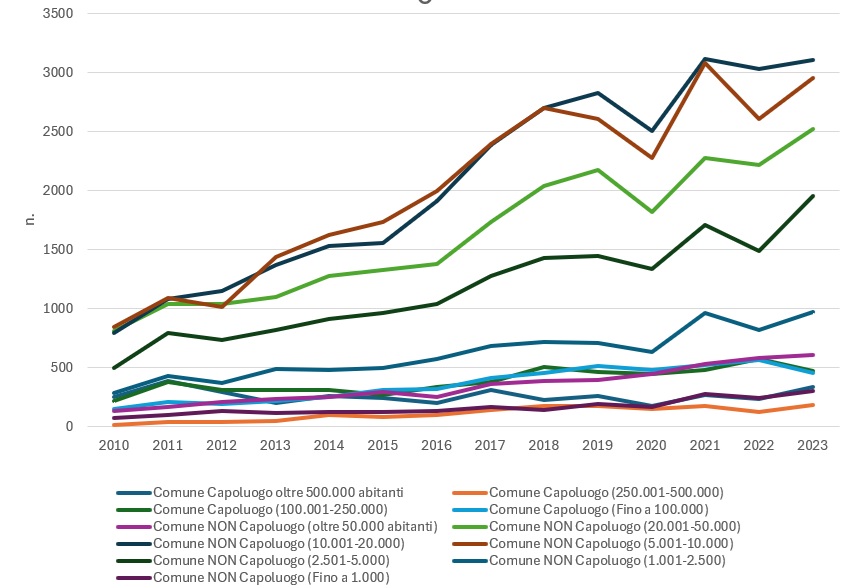
Figure 2: New residential buildings with photovoltaic systems by municipality class Data source
ISPRA processing based on ISTAT data |
Thumbnail
Headline
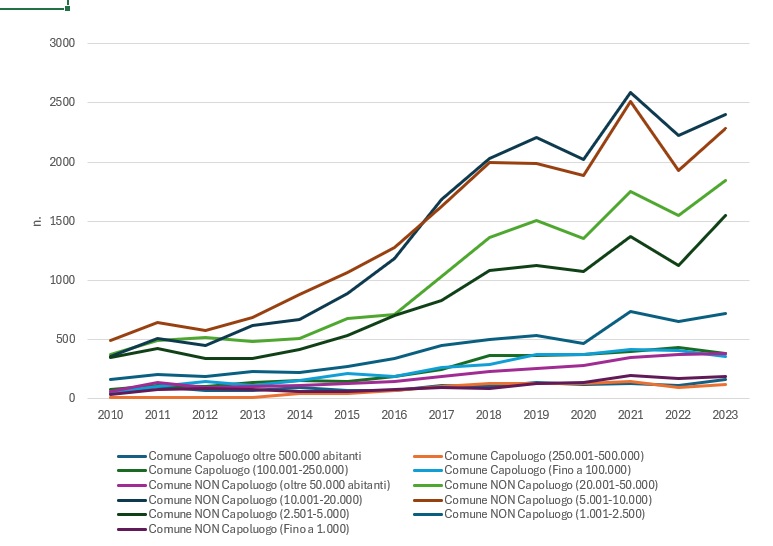
Figure 3: New residential buildings with heat pump systems by municipality class Data source
ISPRA processing based on ISTAT data |
Thumbnail
Headline
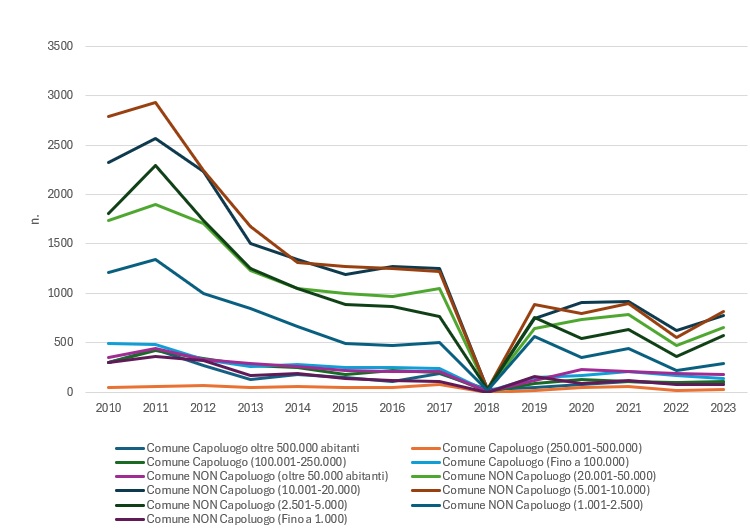
Figure 4: New residential buildings with condensing boiler systems by municipality class Data source
ISPRA processing based on ISTAT data |
Photovoltaics and heat pumps remain the most widely used sustainable systems in new constructions (Figures 1 and 2). Yet, 2023 data show a decline from the 2022 peak, confirming the unstable trajectory of this transition. The drop affects nearly all technologies and illustrates how heavily the building sector depends on the availability of incentive schemes.
In municipalities with over 500,000 inhabitants, 231 new buildings had photovoltaic systems in 2023, and 114 had heat pumps. In municipalities with 100,001 to 250,000 inhabitants, these figures were higher—572 and 435 respectively—indicating greater penetration in medium-sized urban areas. In smaller municipalities, although adoption is numerically relevant, it is more discontinuous and fragmented due to economic, infrastructural, or design capacity constraints (Table 1).
In terms of technologies, photovoltaic and heat pump systems form the most effective duo for reducing emissions in the building sector (Figure 3). However, their penetration varies significantly with municipal size. In large cities, there is a clear need for stable incentives and the phasing out of condensing boilers (Figure 4), still present as a transitional technology. In medium-sized municipalities, the shift from boilers to heat pumps is already well underway, while small municipalities require investments in electrical networks and local skills to fully utilise locally generated renewable energy.
In conclusion, the spatial distribution and temporal variation of systems confirm that the “energy transition” in buildings is ongoing but not yet structurally embedded. To consolidate it, differentiated and stable policies may be needed to effectively support territories with very diverse characteristics.