Angelo Santini, Fabio Tatti
The analysis of the data relating to 2023 shows a decrease in recycled/recovered quantities compared to the previous year. The causes can be found in the decline in annual radiation certified by the P. R. A. Registry. Of the Ministry of Transport, in the international situation which has generated delays in the supply of raw materials for the construction of cars and the consequent crisis in the sector, with large delays in both production and delivery. Overall, the supply chain achieves a reuse and recycling percentage equal to almost 86% of the average weight of the vehicle, above the 85% objective set for 2015 by the art. 7 paragraph 2 of Legislative Decree 209/2003.
The indicator measures the ratio between the quantity reused plus the quantity recycled and the total weight of end-of-life vehicles, according to the calculation methodology established by Decision 2005/293/EC.
Verify the achievement of the objective of preparation for reuse, recycling and recovery of end-of-life vehicles established by law.
Directive 2000/53/EC as amended by Directive 2018/850/EU
By January 1, 2015:
- percentage of reuse and recovery at least 95% of the average weight per vehicle
- reuse and recycling percentage equal to at least 85% of the average weight per vehicle and per year
ISPRA - Waste from Economic Activities Report (various editions)
ISPRA
The data derives from processing and estimates conducted starting from the information contained in the vehicles section of the single environmental declaration form (MUD).
National
2006-2023
The calculation methodology established by Decision 2005/293/EC is based on the analysis of the mass balance between the inputs and outputs of the end-of-life vehicle management systems located throughout the national territory, starting from the data declared by the managers in the vehicle sheet of the single environmental declaration form (MUD).
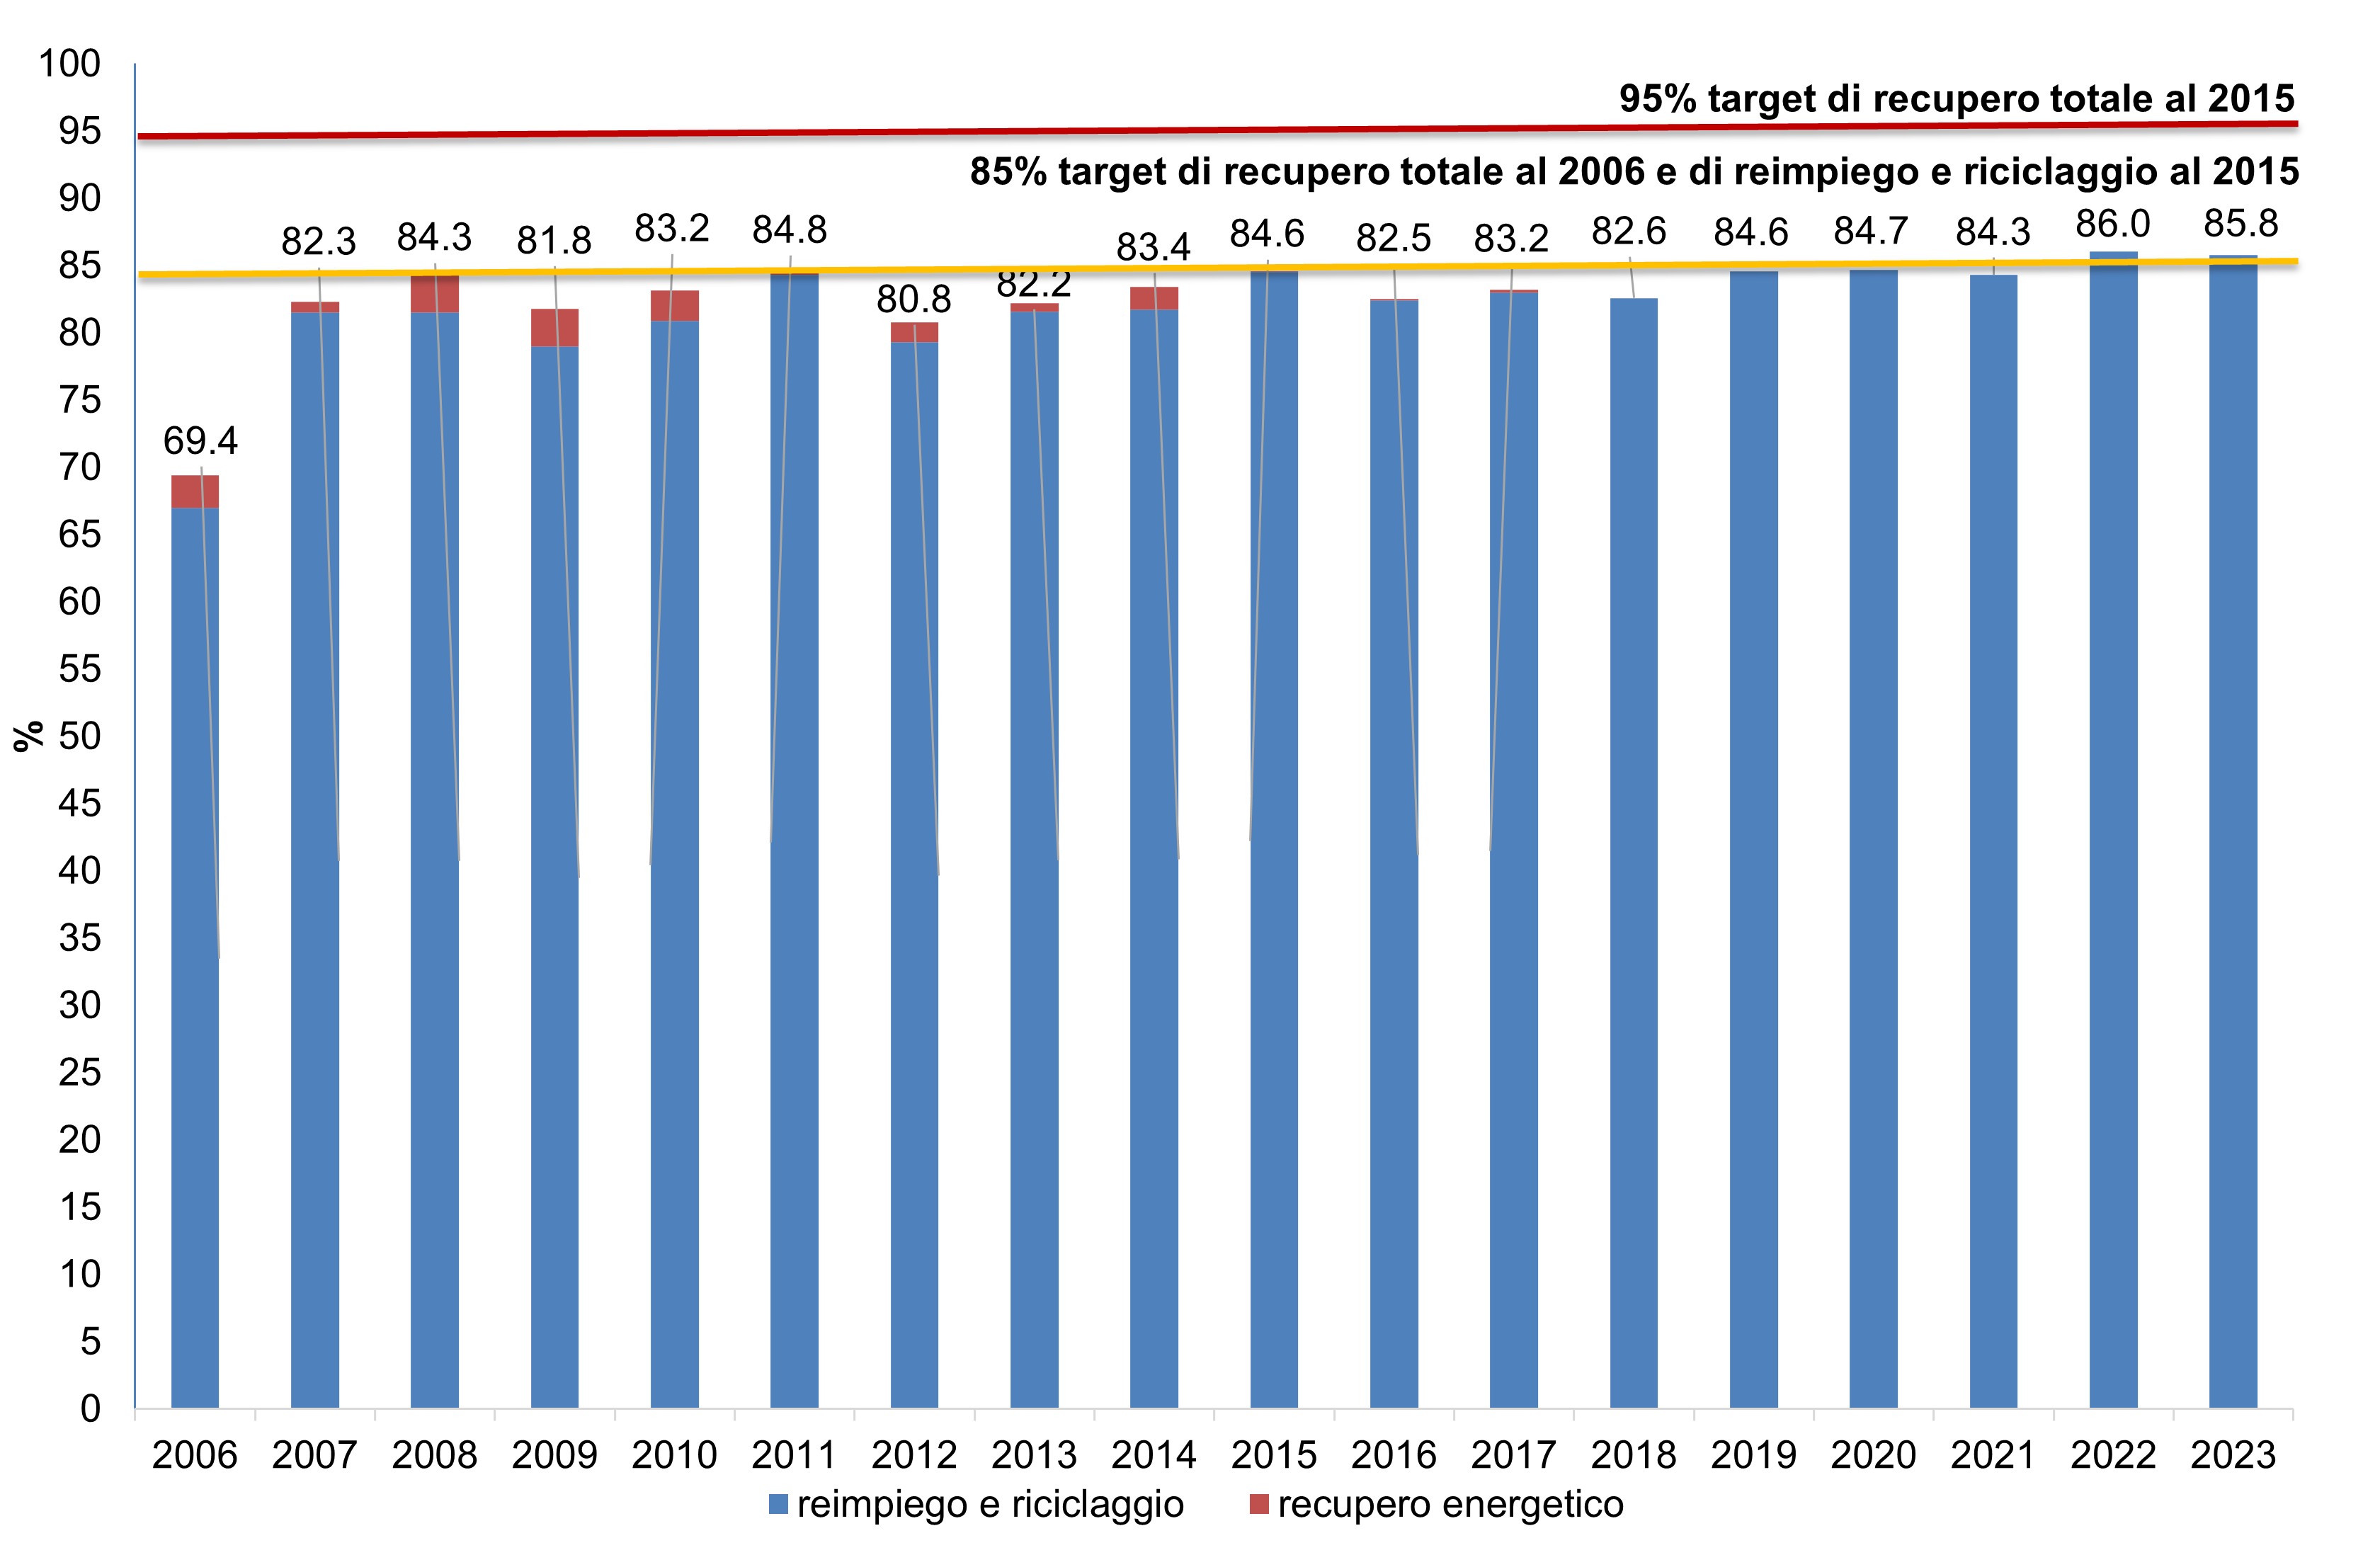
In 2023 the supply chain will reach a reuse and recycling percentage equal to almost 86% of the average weight of the vehicle, above the 85% objective set for 2015 by the art. 7 paragraph 2 of the Legislative Decree. 209/2003.
From the analysis of the trend in the percentages of reuse, recycling and recovery, starting from 2006 it emerges that, after the initial improvement perhaps due to a positive response of the entire supply chain to the new legislation and European targets, as well as to a phase of adaptation with respect to the method of declaration of information, in the following years there is substantial stability. In 2022, there is a slight increase (+1.7% percentage points) which allows us to reach and exceed the target set for 2015 (85%). In 2023 the percentage of reuse, recycling and recovery is substantially stable compared to the 2022 value.
| Data |
|---|
Thumbnail
Headline
Figure 1 – Recovery rate of end-of-life vehicles Data source
ISPRA |
The indicator aims to evaluate the effectiveness of the measures undertaken by Member States to verify the evolution of the transition towards the circular economy. The trend of the indicator values recorded from 2006 to today is substantially stable; however, there is a slight increase in the percentage calculated in 2022 compared to that of 2021, allowing the achievement of the 85% objective set for 2015 by the art. 7 paragraph 2 of Legislative Decree no. 209/2003.
Taking into account the absence of energy recovery treatments, the percentage of total recovery still stands at around 86%, a value that is still far, although less than in previous years, from the objective of 95% set by the legislation for 2015.
The fluff (light scrapping residue) produced by crushing plants is almost entirely sent for disposal. The difficulty in identifying valid destinations for the use of this waste constitutes one of the major problems of the entire supply chain. It should be noted that correct decontamination of vehicles, given the high calorific value that characterizes fluff, essentially made up of organic materials, would allow for effective energy recovery. The management difficulties recorded have therefore persisted over the years and no progress has been made in energy recovery, which is widely used in the other Member States.