Anna Maria Blumetti, Luca Guerrieri, Gabriele Leoni
The indicator provides an estimate of the level of exposure of urban areas to surface faulting hazards. For each seismogenic zone in the ZS9 zoning, the indicator measures the areal extension of urbanized areas exposed to surface faulting hazards due to their proximity to capable faults (ITHACA Catalog). These faults are delineated considering the predominant kinematics of the fault, with an extension that depends on the maximum expected displacements.
The most critical situations are confirmed in eastern Sicily, particularly in the Etna area. A comparison with the last assessment (in 2014) shows an increase attributable to the greater expansion of urban areas near capable faults, as well as to the higher number of capable faults included in ITHACA, due to the progressive improvement in knowledge about the recent tectonic activity of certain structures.
The indicator provides an estimate of the level of exposure of urban areas to surface faulting for each zone (Seismogenic Zoning ZS9). It is derived from an algorithm that considers the urbanized area falling within a region close to the linear trace of the capable fault, whose extension varies depending on the type of fault (whether predominantly normal, reverse, or strike-slip). Additionally, it factors in the Surface Faulting Coefficient (CFS), which indicates the maximum expected displacement in the seismogenic zone, and the total area of the seismogenic zone (ZS9 Area).
Recent advances in seismotectonics, particularly from paleoseismological studies, now allow for a more accurate and reliable characterization of capable faults in terms of location and expected surface displacements. Likewise, the progressive development of urban areas and infrastructure is monitored with high accuracy. Therefore, it is now possible, at least in initial approximation, to identify where urbanization near capable faults is most widespread and to detect the presence of critical infrastructure exposed to this phenomenon.
The 2021 update, compared to the last assessment (2014), considers the most recent data versions on capable faults (2021) and urbanized areas (2018). The ZS9 zones remain the same as in 2014.
-
Civil Protection Department (2008). Guidelines and criteria for seismic microzonation. Link
Civil Protection Department (2015). Seismic microzonation. Guidelines for land management in areas affected by active and capable faults (FAC). Link
Eurocode 8: Design of structures for earthquake resistance – Part 5: Foundations, retaining structures, and geotechnical aspects [Authority: The European Union, per Regulation 305/2011, Directive 98/34/EC, Directive 2004/18/EC]
Boncio P, Galli P, Naso G, Pizzi A (2012) Zoning surface rupture hazard along normal faults: insight from the 2009 Mw 6.3 L’Aquila, Central Italy, earthquake and other global earthquakes. Bull Seismol Soc Am 102(3):918–935. doi:10.1785/0120100301
Guerrieri L., Blumetti A.M., Di Manna P., Serva L. & Vittori E. (2009) - The exposure of urban areas to surface faulting hazard in Italy: a quantitative analysis. Proceedings of Conference “Rischio sismico nella Lombardia orientale”, Brescia, 4-5 Dicembre 2006. Boll. Soc. Geol. It. (Ital. J. Geosci.), vol. 128, pp. 179-189.
Guerrieri L., Blumetti A.M., Comerci V., Di Manna P., Michetti A.M., Vittori E. and Serva L. (2014). Surface Faulting Hazard in Italy: Towards a First Assessment Based on the ITHACA Database. Engineering Geology for Society and Territory - Volume 5, 2015, pp 1021-1025, Springer.
IAEA (2010). Seismic Hazards in Site Evaluation for Nuclear Installations. Specific Safety Guide. IAEA Safety Standards. Series SSG-9. https://www-pub.iaea.org/MTCD/publications/PDF/Pub1448_web.pdf.
IAEA (2015). The Contribution of Palaeoseismology to Seismic Hazard Assessment in Site Evaluation for Nuclear Installations, IAEA TECDOC 1767). https://www-pub.iaea.org/MTCD/Publications/PDF/TE-1767_web.pdf
ITHACA Working Group (2019). ITHACA (ITaly HAzard from CApable faulting), A database of active capable faults of the Italian territory. Version December 2019. ISPRA Geological Survey of Italy. Web Portal http://sgi2.isprambiente.it/ithacaweb/Mappatura.aspx
Spatial coverage inconsistencies in data/information on capable faults.
Time lag in ITHACA compared to the current state of knowledge on capable faults in Italy.
The indicator only refers to seismic zones within ZS9 and does not measure the exposure of urban areas near capable faults located outside these zones.
Paleoseismological analyses and survey campaigns.
New datasets on urban area monitoring, with more detailed qualitative information.
INGV (National Institute of Geophysics and Volcanology)
ISPRA (Superior Institute for Environmental Protection and Research)
ITHACA data can be accessed at http://sgi2.isprambiente.it/ithacaweb/Default.aspx
CORINE 2018 data can be accessed and downloaded at https://land.copernicus.eu/pan-european/corine-land-cover/clc2018
ZS9 data can be accessed and downloaded at http://zonesismiche.mi.ingv.it/
National (areas included in seismic zoning ZS9)
Urban area data is updated to 2018.
ITHACA data is updated to 2021.
The methodology used, as described in Guerrieri et al. (2014), provides a more precise definition of areas actually at risk around capable faults (Fault Displacement Hazard areas). Specifically, ITHACA faults have been grouped into three main categories based on predominant kinematics (normal, reverse, or strike-slip) and classified into different classes identified by specific magnitude intervals of the maximum associated earthquake.
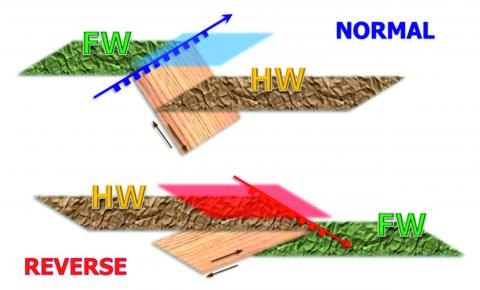
The distribution of at-risk areas is asymmetrical relative to the main trace of the capable fault:
- For normal faults, the affected area extends further into the hanging wall (downdropped block) and is reduced on the footwall (uplifted block).
- For compressive environments, surface faulting typically occurs not only at the emergence of the main thrust fault but also at the core of the growing anticline, sometimes even with normal faulting. This zone can be found several kilometers away from the main thrust in the hanging wall. As a result, the hazard zone in the hanging wall is much broader than for normal faults.
- For strike-slip faults, characterized by Flower Structures (Twiss and Moores, 1992), each fault segment should be treated as an independent source of surface faulting hazard, locally with a normal or reverse component. The hazard zone is preliminarily considered symmetrical, with a width proportional to the maximum expected displacements. However, segmentation should be well documented to assess hazard for each secondary element, taking into account its specific kinematics (normal or reverse).
A buffer was applied around the main trace of each tectonic element, as shown in Figure 3. The results of the spatial analysis were weighted with a Surface Faulting Coefficient (CFS), accounting for the maximum expected displacement in each ZS9 zone.
Given the nature of the phenomenon, it is not possible to objectively define a status.
The trend is negative since the exposure of urban areas near active and capable faults has increased compared to previous measurements. However, it should be noted that in two areas (Friuli-Venezia Giulia and Emilia-Romagna), the trend is positive due to a careful revision of the ITHACA catalog, which led to the exclusion of some faults previously cataloged in earlier versions.
| Data |
|---|
Thumbnail
Headline
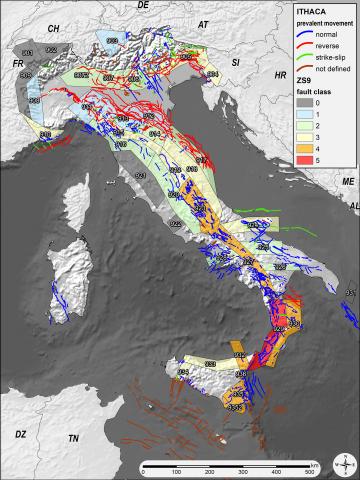
Figura 1: Catalogo ITHACA sulla zonazione sismica ZS9 suddivisa in 5 classi di rigetto Data source
ISPRA |
Thumbnail
Headline
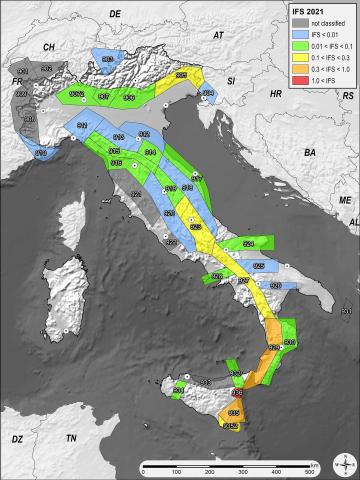
Figura 2: Classificazione delle zone sismogenetiche in funzione dell'indice IFS Data source
ISPRA |
Thumbnail
Headline
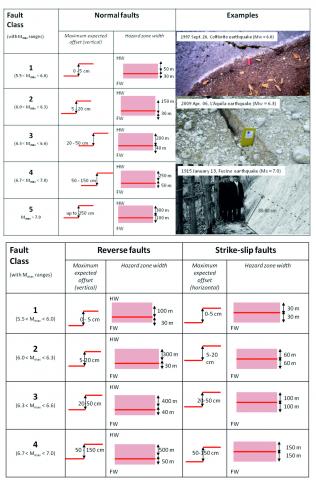
Figura 3: Modello di classificazione delle faglie capaci di ITHACA in 5 classi in funzione degli intervalli di Magnitudo del massimo terremoto atteso Data source
ISPRA |
Thumbnail
Headline
Figura 4: Distribuzione delle aree a rischio rispetto alla traccia principale della faglia capace Data source
ISPRA |
Thumbnail
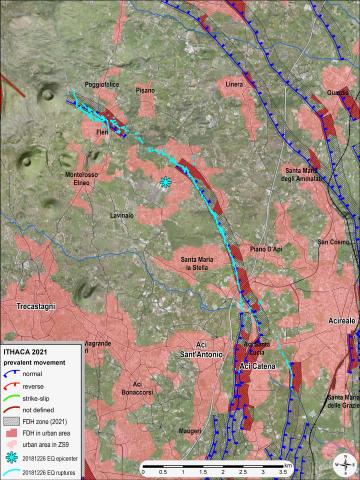
Headline
Figura 5: Focus sul versante orientale dell'Etna, nell'area colpita dal terremoto di Fiandaca del 26.12.2018 (Mw=4,9) Data source
ISPRA Note
La fagliazione superficiale (in celeste) ha interessato un'area fortemente urbanizzata anche all'interno delle zone a rischio (FDH zone). |
Thumbnail
Headline
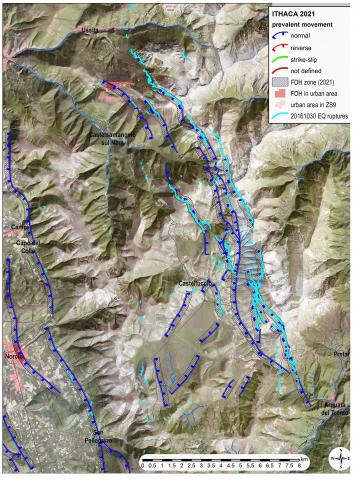
Figura 6: Focus sul versante occidentale del Monte Vettore interessato da circa 30 km di fagliazione superficiale prodottasi in occasione dei terremoti del 2016 Data source
ISPRA Note
In questo caso, pur essendo molto elevata la pericolosità (dislocazioni anche superiori al metro), le zone a rischio risultano urbanizzate solo in minima quantità. |
Headline
Tabella 1: Indice di fagliazione superficiale IFS per ciascuna zona sismica ZS9 aggiornato al 2021 Data source
Elaborazione ISPRA su dati INGV e ISPRA Note
L'ultima colonna evidenzia la variazione dell'indicatore rispetto al 2015 |
In Table 1, for each ZS9, the following elements are represented:
It should be noted that for some zones, the index could not be calculated due to the absence of known capable faults or because the ITHACA database was not considered sufficiently complete.
In Figure 1, the ZS9 seismotectonic zoning is classified into five categories based on the maximum expected displacement, which was used to define the CFS coefficient. This value was incorporated into the IFS calculation to ensure that the assessment of hazard also accounts for the expected displacement magnitude.
Across all ZS9 zones, where input data was deemed reliable for this type of analysis, 7.3% of the hazardous territory is urbanized (Figure 2). However, this result is underestimated due to gaps in input data, both in the distribution of capable faults and in certain types of lifelines that are not reflected in the CORINE Land Cover dataset.
The Surface Faulting Index highlights critical areas, particularly in eastern Sicily and the Tyrrhenian coast of Calabria, confirming the findings of previous analyses. The interaction between urbanization and capable faults is less critical in areas where hazard zones are smaller and the expected surface displacements are minimal (e.g., the northern and southern margins of the Po Plain).
In Figure 3, a simplified zoning of surface faulting susceptibility areas for the Italian territory is presented. The ITHACA capable faults are classified into five categories based on maximum expected surface displacements (ranging from a few centimeters to several meters). Each class also defines the extent of the surface faulting susceptibility zone, which is asymmetrical—more limited on the footwall and wider on the hanging wall (Guerrieri et al., 2014). For normal faults, the right side of the figure includes images documenting surface faulting events of varying magnitudes that have occurred in Italy in recent or past years.
In Figure 4, a schematic representation of the potential surface faulting hazard zone for dip faults (normal and reverse) is shown. The strong asymmetry is evident, as the hazard area is significantly more extensive on the hanging wall block.
In Figure 5, a focus on the Etna region (eastern Sicily) is provided, highlighting a surface faulting event along with the Fiandaca fault, which occurred during the December 26, 2018 earthquake (linear ruptures mapped in blue). The fault was already cataloged in ITHACA, but a significant portion of the surrounding area is urbanized. The 2018 event confirmed previous knowledge, producing centimetric to decimetric displacements, which in some locations exceeded several tens of centimeters, affecting buildings and other man-made structures.
In Figure 6, a focus on the Monte Vettore – Monte Bove area is presented. This area was affected by surface faulting during the 2016 seismic sequence, with displacements reaching up to 2 meters. In this case, urbanized areas were mostly outside the immediate proximity of capable faults, except for the Frontignano district in the municipality of Ussita.