Daniela Paganelli, Raffaele Proietti, Marina Pulcini, Laura Sinapi, Andrea Strollo
Physical loss defines the seabed surface lost due to permanent changes to the substrate and/or morphology of the seabed induced by anthropogenic activities and/or works, such as coastal defense works, port infrastructures, wind farms, cables and pipelines, etc. It helps to define the level of integrity of the seabed (Descriptor 6), as defined pursuant to the Marine Strategy Framework Directive 2008/56/EC (MSFD) and Decision 2017/848/EC.
The "physical loss" indicator measures the extent and impact of the different types of works and/or activities on the seabed in total and by type of habitat. These data allow us to populate Criterion D6C1 (total physical loss) and Criterion D6C4 physical loss by habitat types ( Broad Habitat Types ), sensu MSFD.
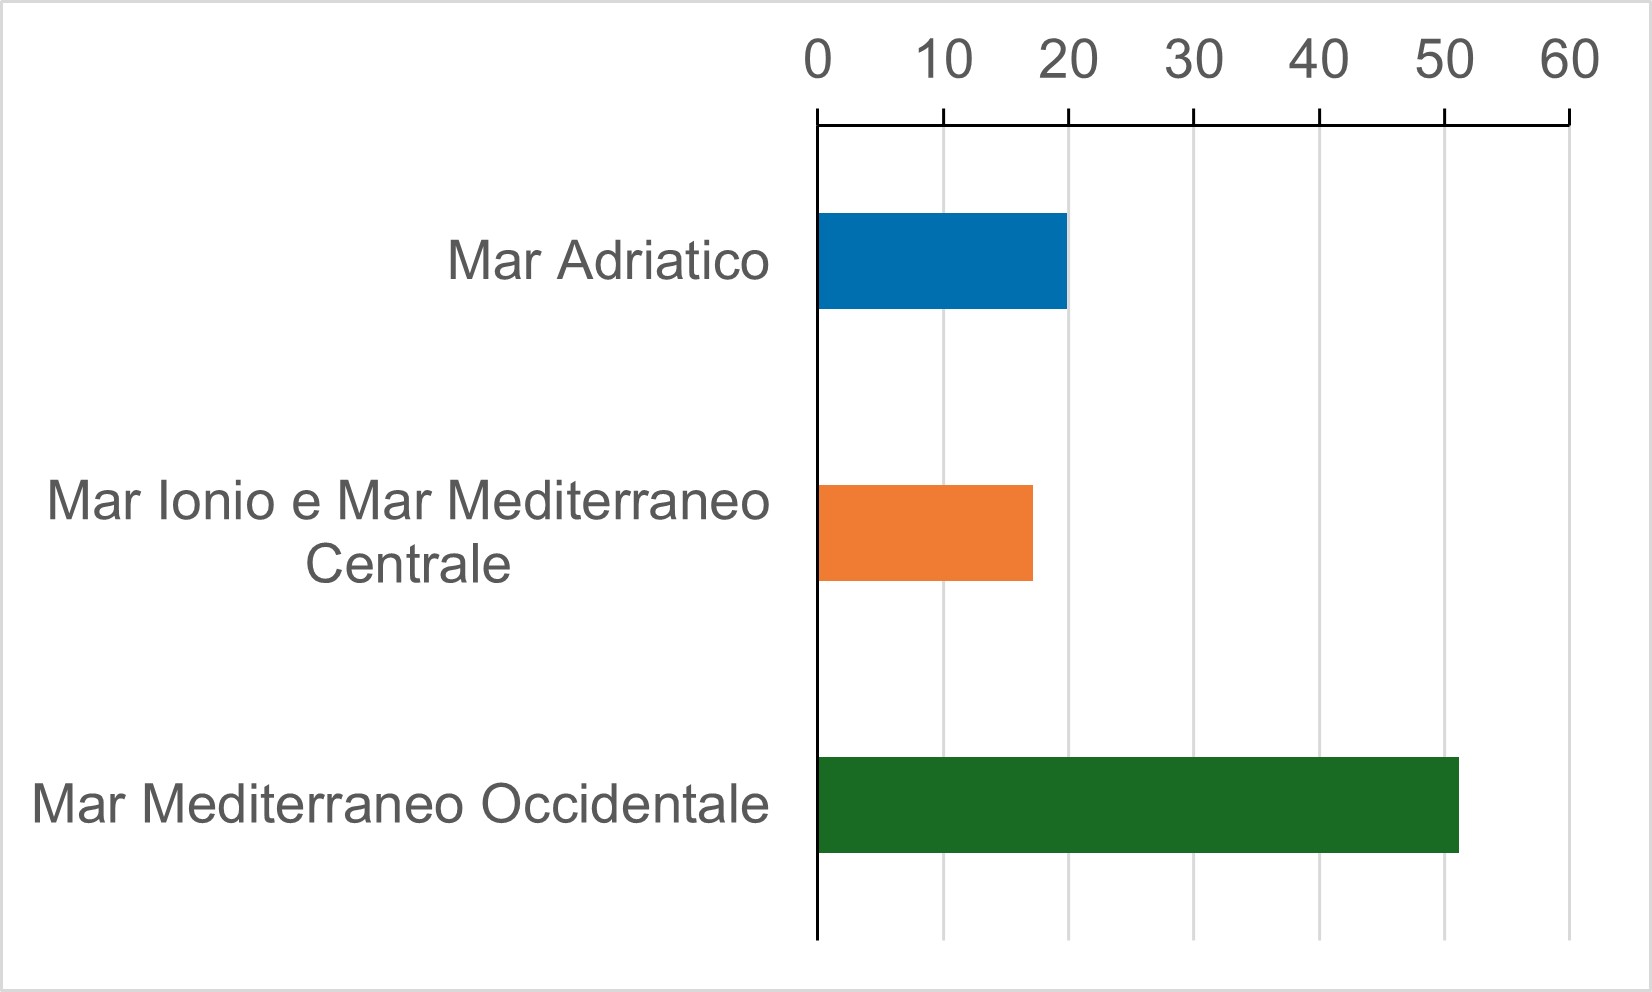
In Italian seas the physical loss has values between 19-34 km 2, detected in the Ionian Sea and Central Mediterranean Sea MRU and in the Adriatic Sea MRU, respectively 19.9 km 2 and 34 km 2 in extension, and approximately 51 km 2 observed in the MRU western Mediterranean Sea.
The physical loss indicator allows to quantify the extension of the seabed affected by permanent modifications due to alterations in the morphology and/or nature of the substrate, attributable to anthropic activities and/or works, such as: coastal defense works, port infrastructures, cables and pipelines, platforms offshore , wind farms, wells for the extraction and exploration of hydrocarbons (hereinafter wells ), LNG regasifiers and relict sand quarries subjected to dredging activities (below relict sand quarries ). The calculation is carried out using the real surface area for coastal defense works and port infrastructure; in all other cases, the footprint , defined on the basis of specifications buffer associated with points and lines representative of the elements considered (Foden et al ., 2011; Paganelli et al , 2017; HELCOM, 2018, ICES 2019).
For each category of work, the most recent available data was considered: for ports and coastal defense works the data is updated to 2018, for cables and pipelines the data, provided by IIM, is updated to 2020, while in the remaining cases (offshore platforms and wells, wind farms, LNG regasifiers, relict sand quarries) the data is updated to 2025, updating for some elements also the buffer . The areas affected by the dredging of relict sands (relict sand quarries) were included, while those affected by the sinking of the wrecks were not considered.
Physical loss by activity type and habitat type is also calculated, using i Broad Habitat Types (BHT) and, limited to the habitat Posidonia beds, the Other Habitat Types (OHT) (EUSeaMap, 2023).
The calculation is carried out for the three Marine Reporting Units (MRU) under the responsibility of the Italian State: “Adriatic Sea”, “Ionian Sea and Central Mediterranean Sea” and “Western Mediterranean Sea”.
Evaluate the extension of the seabed affected by permanent modifications associated with anthropic activities (laying of infrastructures and dredging) in order to populate the D6C1 criteria ( territorial extent and distribution of physical loss (permanent modification) of the natural seabed ) and D6C4 ( the extent of loss of the habitat type due to anthropogenic pressures does not exceed a certain percentage of the natural extent of the habitat type in the assessment area ), as defined in EU Decision 848/2017.
In general, the indicator allows us to evaluate the variations over time in the physical loss, total, by activity and by type of habitat, in the three MRUs present on Italian territory.
- Framework Directive 2008/56/EC on the strategy for the marine environment, implemented in Italy with Legislative Decree 190/2010 and Decision (EU) 2017/848,
- DM Ministry of the Environment, Land and Sea Protection 02/15/2019 “ Update of the determination of the good environmental status of marine waters and definition of environmental goals".
- European Commission, 2022. MSFD CIS Guidance Document No. 19, Article 8 MSFD, May 2022. https://circabc. europa. eu/ui/group/326ae5ac-0419-4167-83ca-e3c210534a69/ library/d2292fb4-ec39-4123-9a02-2e39a9be37e7/details
- Legislative Decree no. 190 of 13 October 2010
- Prime Ministerial Decree 10 October 2017
- Ministerial Decree of 15 February 2019
- Ministerial Decree of 2 February 2021
- Prime Ministerial Decree of 7 July 2022
In particular, the calculation of the physical loss, which involves the population of the D6 C1, D6 C4 and D6 C5 criteria (not considered in this work) falls among the obligations for the implementation of the MSFD Directive (Legislative Decree no. 190/2010). The Directive provides that, to prevent degradation and restore damaged marine ecosystems, each country must implement the measures necessary to achieve (or maintain) a good environmental status (Good Environmental Status or GES), i. e. A state capable of preserving the ecological diversity and vitality of clean, healthy and productive seas and oceans, as well as the use of the marine environment at a sustainable level. The GES is determined on the basis of 11 qualitative descriptors of the marine environment which refer to multiple aspects of marine ecosystems; physical loss is one of the elements that contributes to the definition of the fund Integrity Descriptor (D6).
AAVV, Monitoring Programs for the Marine Strategy Art. 11, Legislative Decree 190/2010 – Methodological SHEETS 2021
Evans D., Condé S. & Royo Gelabert E. (2014). Crosswalks between European marine habitat typologies - A contribution to the MAES marine pilot. ETC/BD report for the EEA.
Evans D., Aish A., Boon, A., Condé, S., Connor, D., Gelabert, E. Michez, N., Parry, M., Richard, D., Salvati, E. & Tunesi, L., 2016. Revising the marine section of the EUNIS Habitat classification - Report of a workshop held at the European Topic Center on Biological Diversity, 12 & 13 May 2016. ETC/BD report to the EEA
Foden J., Rogers S. I. And Jones A. P. (2011) Human pressures on UK seabed habitats: a cumulative impact assessment. Marine Ecology Progress Series 428, 33–47
HELCOM (2018): Thematic assessment of cumulative impacts on the Baltic Sea 2011-2016. Baltic Sea Environment Proceedings No. 159. Available at: http://www. helcom. fi/baltic-sea-trends/holistic-assessm
ICES. 2019. Workshop on scoping of physical pressure layers causing loss of benthic habitats D6C1–methods to operational data products (WKBEDLOSS). ICES Scientific Reports. 1:15. 49 pp. http://doi. org/10.17895/ices. pub.5138
ICES. 2019. Workshop to evaluate and test operational assessment of human activities causing physical disturbance and loss to seabed habitats (MSFD D6 C1, C2 and C4) (WKBEDPRES2). ICES Scientific Reports. 1:69. 87 pp. Http://doi. org/10.17895/ices. pub.5611
Paganelli D., P. La Valle, M. Pulcini, R. Proietti, L. Nicoletti, B. La Porta, L. Lattanzi, A. Pazzini, M. Targusi and M. Gabellini (2017). Towards an evaluation of physical loss pressure in the Italian seas for the implementation of the marine strategy framework directive. Journal of the Marine Biological Association of the United Kingdom1-9. Marine Biological Association of the United Kingdom, 2017 doi:10.1017/S002531541700091
Paramana Th., Dassenakis M., Paraskevopoulou V., Papadopoulou N., Smith C, Reizopoulou S, Raicevich S., Pulcini M., Ronchi Fr., Penna M., Nguyen Xuan A, Proietti R., Maltese S., Lauria V., Garofalo G., Mavrič B. Klančnik K., Kaučič R., Caserman H., Russo T., Vrgoc N., Isajlovic I., Streftaris N., Pagkou P. Screening and assessing physical pressures compromising sea - floor integrity in the Adriatic subregion and Greece. Ocean & Coastal Management 251, 2024, 107046. Https://doi. org/10.1016/j. ocecoaman.2024.107046
SNPA, Methodological sheets used in the monitoring programs of the second cycle of the Marine Strategy Directive (Ministerial Decree 2 February 2021), SNPA technical publications, 2024 ISBN 978-88-448-1236-2 © SNPA technical publications 2024 https://www. snpambiente. it/notizie/snpa/schede-metodologico-utilate-nei-programmi-di-monitoraggio-del-secondo-ciclo-della-direttiva-strategia-marina-d-m-2-febbraio-2021/
Vasquez M., Manca E., Inghilesi R., Marti, S., Agnesi S., Al Hamdani Z., Annunziatellis A., Bekkby T., Pesch R., Askew A., Bentes L., Castle L., Doncheva V., Drakopoulou V., Gonçalves J., Laamanen L., Lillis H., Loukaidi V., McGrath F., Mo G., Monteiro P., Muresan M., O'Keeffe E., Populus J., Pinder J., Ridgeway A., Sakellariou D., Simboura M., Teaca A., Tempera, F., Todorova V., Tunesi L. And Virtanen E. EUSeaMap 2019, A Euro pean broad-scale seabed habitat map, Technical Report, 2019 EUSeaMap 2019, A European ad-scale seabed habitat map, technical report
- absence of evaluation criteria;
- different sizes and shapes of reference geographical areas (MRUs).
MASE (Ministry of the Environment and Energy Safety).
Ministry of Defense - Navy Hydrographic Institute
Accessibility varies depending on the type of data:
- BHT (EUNIS, level 3): https://www. emodnet-seabedhabitats. eu/; https://www. eea. europa. eu/data-and-maps/data/eunis-habitat-classification
- defense works and port infrastructures: ISPRA processing (digitalisation in a GIS environment) on AGEA orthophotos (data distributed by gn. mase. gov. it )
-Wind farms and LNG regasifiers at the VAS-VIA-AIA Environmental Assessments and Authorizations Portal https://va. mite. gov. it/it-IT
- Offshore platforms, hydrocarbon wells: data provided by https://emodnet. ec. europa. eu/en/human-activities
for all other basic data provided by the Ministry of Defense (Hydrographic Institute of the Navy);
National (I)
October 2025
The physical loss indicator is calculated, for each MRU, as the algebraic sum of the physical loss measured for each anthropic activity; physical loss by habitat type is also calculated – BHT OHT, EUSeaMap 2023, EUNIS level 3.
The indicator is expressed in km 2 (corresponding to the extent of lost seabed).
The physical loss is represented, for each MRU, as: - physical loss (in km 2) - physical loss by activity type (in %) - physical loss by habitat type (km2) - for each habitat type, as physical loss by activity type (%).
In Italian seas the physical loss has values between 19-34 km 2, detected in the Ionian Sea and Central Mediterranean Sea MRU and in the Adriatic Sea MRU, which measure, respectively, 19.9 km 2 and 34 km 2 in extension, and approximately 51 km 2 observed in the MRU western Mediterranean Sea (Figure 1). It is generated by the following categories of works: cables, pipelines, port infrastructures, coastal defense works, offshore platforms and wells, relict sand quarries, LNG regasifiers, wind farms (Figure 2). In direct relation with the nature and characteristics of the works that generate it, the physical loss presents a more uniform distribution near the coast, becoming irregular and sporadic as it proceeds offshore.
It is not possible to describe/evaluate the trend as the parameters linked to the first population have changed
| Data |
|---|
Thumbnail
Headline
Figure 2: Physical loss by activity Data source
ISPRA processing on data:
|
Headline
Dati per Figura 2 Data source
Elaborazione ISPRA su dati:
|
Thumbnail
Headline
Figure 1: Physical loss Data source
ISPRA processing on data:
|
Headline
Table 1: Physical loss by habitat type Data source
ISPRA processing on data:
Data legend
A3 Infralittoral rock and other hard substrate A4.26 or A4.32 Mediterranean Coralligenous Communities Moderately Exposed to Hydrodynamic Action or Mediterranean Coralligenous Communities Sheltered from Hydrodynamic Action A4.26D Coralligenous platforms A4.27 Faunal communities on deep moderate energy circalittoral rock A4 Circalittoral rock and other hard substrate A5.13 Infralittoral coarse sediment A5.14 Circalittoral coarse sediment A5.23 Infralittoral fine sands A5.25 Circalittoral fine sand A5.26 Circalittoral muddy sand A5.33 Infralittoral sandy mud A5.34 Infralittoral fine mud A5.35 Circalittoral sandy mud A5.36 Circalittoral fine mud A5.38 Mediterranean biocoenosis of muddy detrital bottoms A5.39 or A5.46 or A5.38 Mediterranean biocoenosis of coastal terrigenous muds or Mediterranean biocoenosis of coastal detrital bottoms or Mediterranean biocoenosis of muddy detrital bottoms A5.39 or A5.47 Mediterranean biocoenosis of coastal terrigenous muds or Mediterranean communities of shelf-edge detrital bottoms A5.39 Mediterranean biocoenosis of coastal terrigenous muds A5.46 Mediterranean biocoenosis of coastal detrital bottoms A5.47 Mediterranean communities of shelf-edge detrital bottoms A5.535 [Posidonia] beds A5.5353 Facies of dead "mattes" of [Posidonia oceanica] A6.11 Deep-sea bedrock A6.2 Deep-sea mixed substrate A6.3 Deep-sea sand A6.4 Deep-sea muddy sand A6.51 or A6.511 or A6.4 Mediterranean communities of bathyal muds or Facies of sandy muds with Thenea muricata or Deep-sea muddy sand A6.51 Mediterranean communities of bathy muds A6.511 Facies of sandy muds with Thenea muricata A6.52 Communities of abyssal muds |
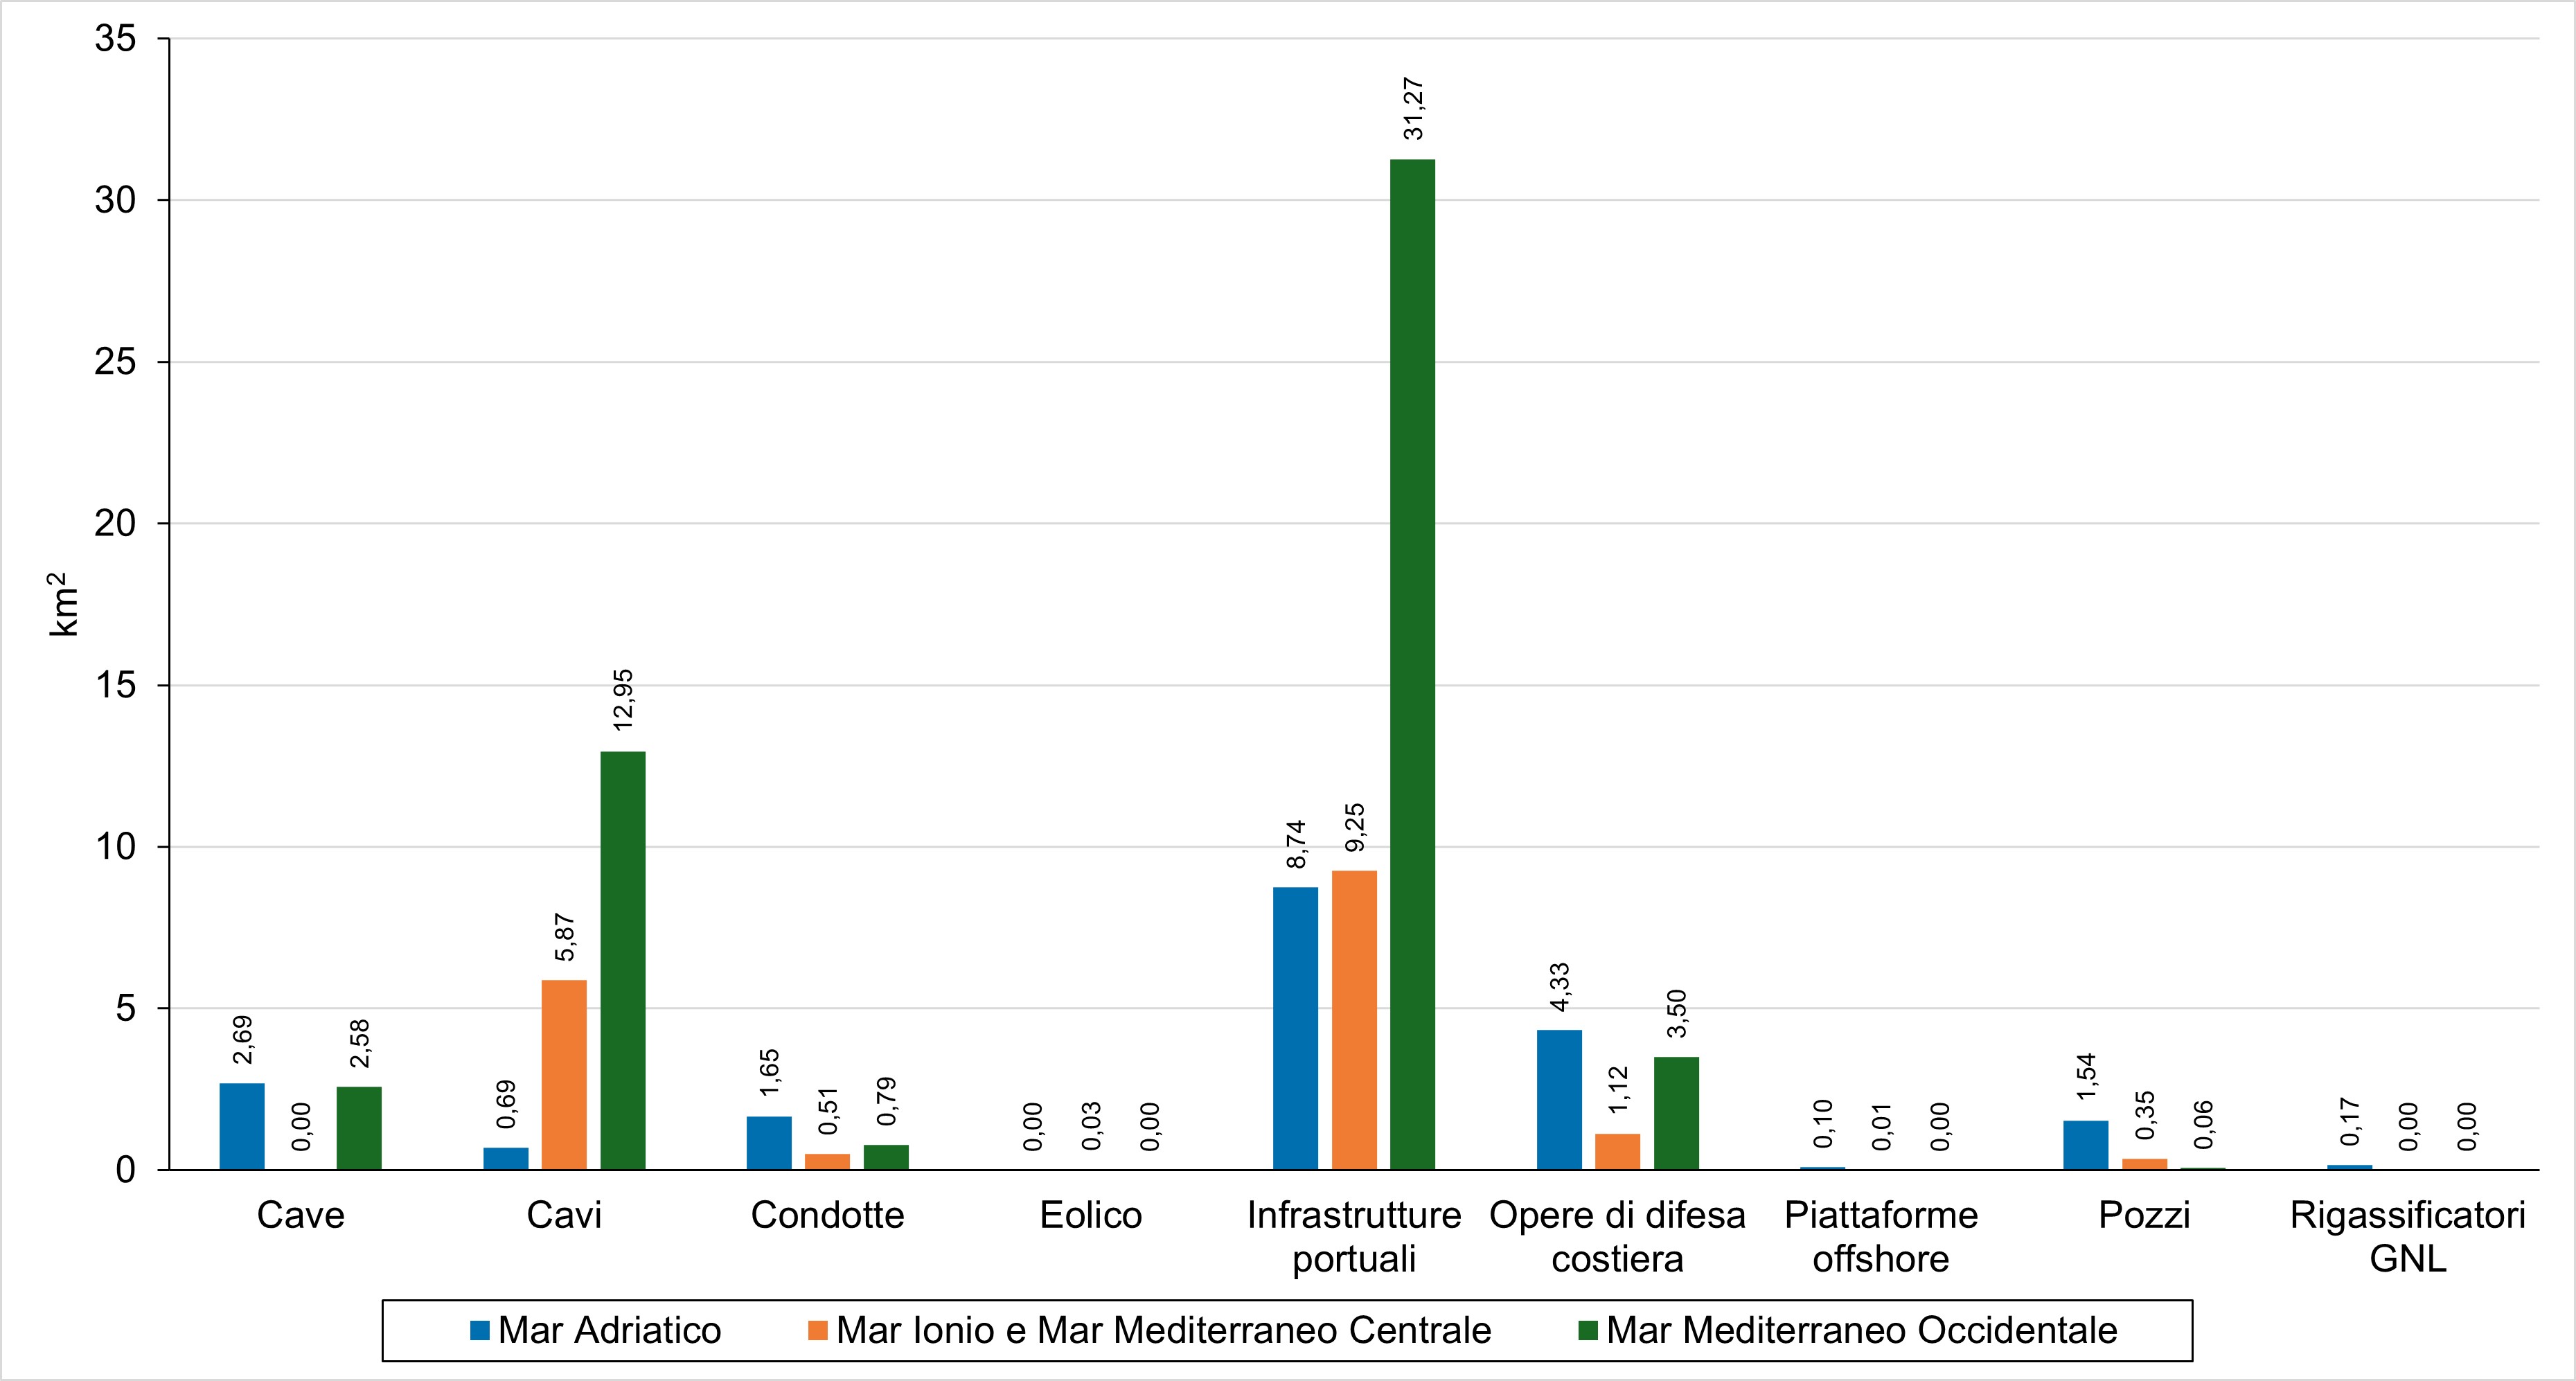
In all the MRUs, the category of works that affects physical loss more than any other is that of port infrastructure, with values ranging between 31,268 m 2 in the MRU Western Mediterranean Sea and 9,253 m 2 in the MRU Ionian Sea and central Mediterranean Sea. In the Adriatic Sea MRU the greatest physical loss is always attributable to the port infrastructure with 8,739 m 2 followed by the coastal defenses (4,326 m 2) and the quarries with 2,693 m 2.
In particular, Figure 2 (MRU Adriatic Sea) shows how the physical loss, which in total takes on the value of 19.9 km 2, is mainly due to port infrastructures (8.7%), coastal defense works (4.3%) and quarries (2.7%).
In the MRU Ionian Sea and central Mediterranean Sea (Figure 2), the physical loss is attributable to port infrastructure for an extension of 9.26 km 2 and cables for an extension of 5,868 km 2; in this MRU there is the only wind farm installed to date in Italian waters with an extension of 0.028 km 2.
Finally, the physical loss observed in the Western Mediterranean Sea MRU (Figure 2), although presenting greater extension values than that found in the other MRUs, also in agreement with the greater extension of the MRU, confirms a distribution by category of works similar to what was observed for the Ionian Sea and Central Mediterranean MRU, with the greater incidence of port infrastructures with an extension of 31.27 km 2, and cables for 12.96 km 2.
To calculate the physical loss with respect to habitat type, BHTs were examined ( Broad Habitat Type ) and OHTs ( Other Habitat Type ), EUSeaMap 2023, EUNIS level 3. In particular, for the OHTs the habitat was taken into consideration Posidonia beds , a priority habitat also protected under the Habitats Directive.
As can be seen in Table 1, in the Adriatic Sea MRU the physical loss mainly affects the habitats of the infralittoral planes ( Infralittoral sands ), with values of 4.5 km respectively 2; high values of physical loss were also detected on habitats Circalittoral sandy mud, Circalittoral fine mud and Mediterranean biocoenosis of coastal detrital bottoms where with extension values of 1.6, 1.4 and 1.9 km, respectively 2. In this MRU the works that most affect the habitats of the infralittoral plane are the port infrastructures and defense works; the habitats of the circalittoral plane are mostly dominated by pipelines and port infrastructures; finally, as far as the bathyal plane is concerned, cables are predominant.
In the MRU Ionian Sea and central Mediterranean Sea, the physical loss affects the habitat most Infralittoral fine sands with extensions of 3.25 km 2, the Mediterranean biocoenosis habitat of coastal detrital bottoms with 1.46 km 2, Mediterranean communities of bathy muds with an extension of 1.88 km 2 and Mediterranean communities of bathy muds with 2.11 km 2 of extension to confirm the bathyal regime already highlighted in 2021. As regards biogenic substrates, the physical loss mainly concerns the habitats of the infralittoral plane ( Posidonia Beds and Infralittoral rock and biogenic reef ) with values of 0.29 and 0.33 km respectively 2. Port infrastructures and defense works are predominant in the infralittoral habitats, while the presence of cables dominates in the other floors. Given that this MRU is the only one in which there is a wind farm, it is worth pointing out that it occupies the habitats Infralittoral fine sands (0.013km 2), the habitat Mediterranean bioceoenosis of detrital bottoms and Mediterranean communities of shlf-edge detrital bottoms with respectively 0.002 and 0.011 km extension 2.
Finally, in the Western Mediterranean Sea MRU the highest values of physical loss were found on the Infralittoral fine sands (9.93km 2) and on deep habitats ( Bathyal mudst) with 5.05 km 2
Regarding biogenic substrates sensu MSFD, physical loss is of greater concern to habitat Posidonia beds (0.12km 2) And Infralittoral rock and Biogenic reef (0.14km 2).
In this MRU, for almost all habitats, the largest contributor to physical loss is port infrastructure and cables.