Panel 1
Riccardo De Lauretis

The indicator relates the total atmospheric emissions generated by the production and processing of non-ferrous metals to the total quantities produced, in order to assess the specific emissions per unit of product. Between 1990 and 2020, data analysis shows a significant reduction in specific emissions for all substances, with the exception of NMVOCs, which increased. This macrotrend is reflected in the year-over-year change: in 2020 compared to 2019, while the specific emissions of CO, NOx and SOx decreased, those of NMVOCs slightly increased.
The indicator compares total atmospheric pollutant emissions from the production and processing sector of non-ferrous metals to the total quantities produced. The air pollutants observed are: SOx (sulfur oxides); NOx (nitrogen oxides); CO (carbon monoxide); and NMVOCs (Non-Methane Volatile Organic Compounds). The emissions used in the calculation are estimated using appropriate methodologies in accordance with EMEP/EEA guidelines. The annual update of emissions includes the revision of the entire historical series based on improved information and the latest methodological developments. This revision methodology may cause even significant variations in historical data. Given the selected level of aggregation, the indicator provides information on the environmental performance of the entire sector, rather than individual production processes.
The purpose is to assess unit-generated emissions in the non-ferrous metals industry.
Specific environmental emissions from the industrial sector are regulated by Directive 2010/75/EU of 24 November 2010, transposed into Italian law with Legislative Decree of 4 March 2014, No. 46, which amended Legislative Decree 152/06, and subsequent amendments. The regulation sets out the obligations for each industrial sector in terms of pollution prevention and reduction, including the adoption of Best Available Techniques (BATs). It also ensures information exchange within the European Community, including emissions data for activities subject to Integrated Environmental Authorization (AIA).
Panel 2
Rapporto ISPRA 361/2022 - Italian Emission Inventory, 1990-2020. Informative Inventory report 2022
Data quality assessment
Industry Associations, ISPRA (Italian Institute for Environmental Protection and Research), ISTAT (Italian National Institute of Statistics)
The activity data and emissions are documented in the National Atmospheric Emission Inventory and in particular in "ISPRA Report 361/2022, Italian Emission Inventory, 1990-2020. Informative Inventory report 2022" and in the tables with emission data by category officially reported by Italy under the UNECE/CLRTAP Convention.
National
1990-2020
Indicator assessment
Ratio between the atmospheric emissions estimated by ISPRA as part of the National Air Emission Inventory and the production volumes from the non-ferrous metals industry that generate emissions into the air.
Compared with 2019, specific emissions of SOx (466.75 g/t), NOx (215.46 g/t) and CO (2,315.46 g/t) decreased in 2020, by 5.2 percent, 12.9 percent and 12.2 percent, respectively. In contrast, specific emissions of NMVOC (1,171.73 g/t) increased by 5.2%.
Over the period 1990-2020, in general, there is a large decrease in specific emissions of SOx (-89.8%), NOx (-72.9%) and CO (-80.2%), and a marked increase in specific emissions of NMVOC (+71.1%). More specifically, from 2013 onward, the values of specific emissions of SOx, NOx and CO do not show significant reductions or reversals: the trend for these three parameters can be called stable. Overall, the indicator trend is “not definable” due to the opposite direction taken by NMVOCs.
Data
Table 1: Specific emissions in the non-ferrous metals industry.
ISPRA elaboration based on data from ISTAT and Trade Associations
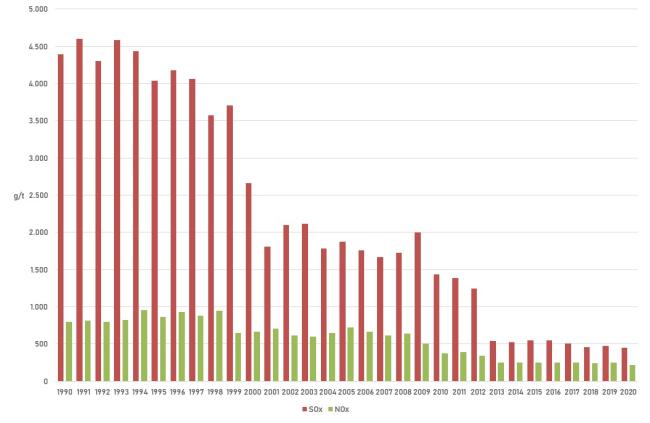
Figure 1: Specific SOx and NOx emissions in the nonferrous metals industry.
ISPRA elaboration on data from ISPRA, ISTAT and Trade Associations.
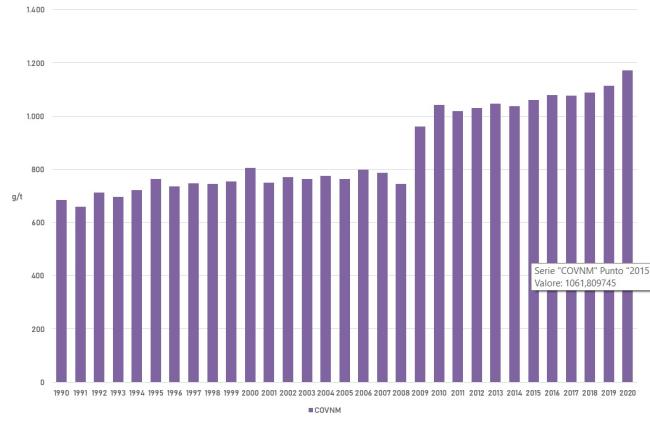
Figure 2: Specific emissions of NMVOCs in the non-ferrous metals industry.
ISPRA elaboration on data from ISPRA, ISTAT and trade associations.
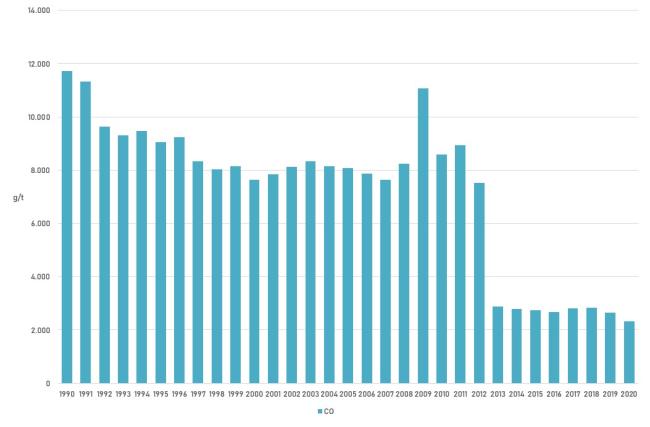
Figure 3: Specific CO emissions in the non-metallic minerals industry.
ISPRA elaboration on data from ISPRA, ISTAT and Trade Associations.
L'analisi della serie storica evidenzia una consistente riduzione delle emissioni specifiche di SOx, NOx e CO nel periodo tra il 1990 e il 2020 (cfr. Tabella 1 e Figure 1, 2 e 3), in controtendenza all’andamento marcatamente crescente dei COVNM. IPiù nel dettaglio, la grossa parte della riduzione delle emissioni specifiche di SOx, NOx e CO è avvenuta tra il 1990 e il 2013, mentre negli anni successivi l’andamento dei tre parametri si è mantenuto complessivamente stabile, non essendo intervenute ulteriori significative riduzioni o inversioni di tendenza. L'andamento annuale delle emissioni è determinato per ciascun inquinante dall'andamento delle produzioni che tipicamente emettono le sostanze stesse.