Panel 1
Riccardo De Lauretis

The indicator relates the total emissions into the atmosphere generated by production processes in the chemical and petrochemical sectors to the total quantity produced, in order to evaluate the specific emissions generated by the production of a single unit of product. In 2020, compared to 2019, the specific emissions of NOx decreased by 16%, SOx emissions increased by 58%, while specific emissions of NMVOCs and CO showed reductions of 3% and 8% respectively.
The indicator relates total atmospheric emissions generated by production processes in the chemical and petrochemical sectors to the total quantity produced. The pollutants considered are: SOx (sulfur oxides); NOx (nitrogen oxides); NMVOCs (non-methane volatile organic compounds), and CO (carbon monoxide). The emissions used to calculate the indicator are estimated using appropriate methodologies according to EMEP/EEA guidelines and are updated annually. The annual update of emissions leads to the revision of the entire historical series based on improved information and recent methodological developments. This revision methodology may lead to changes, even significant ones, in the historical data presented. Given the level of aggregation chosen, the indicator provides information on the environmental performance of the entire sector and not of individual production processes.
Valutare le emissioni specifiche generate dalla produzione di un'unità di prodotto nell'industria chimica.
The purpose is to evaluate the specific emissions generated by the production of one unit of product in the chemical industry.
The chemical and petrochemical sectors fall under the industrial activity categories defined in Directive 96/61/EC of 24 September 1996 (IPPC Directive). This Directive was repealed by Directive 2010/75/EU, transposed into Italian law through Legislative Decree no. 46 of March 4, 2014, which amended Legislative Decree 152/06 and subsequent amendments. The legislation defines, for each industrial sector, the obligations to be met in terms of pollution prevention and reduction, also through the adoption of Best Available Techniques (BATs). It also prescribes the exchange of information within the European Community, including emission data for activities subject to the Integrated Environmental Authorization (AIA).
Panel 2
Rapporto ISPRA 361/2022 - ”Italian Emission Inventory, 1990-2020. Informative Inventory report 2022”
Data quality assessment
Industry associations, ISPRA (Italian National Institute for Environmental Protection and Research), ISTAT (Italian National Institute of Statistics)
The activity data and emissions are documented in the National Emission Inventory and, in particular, in the ISPRA Report 342/2021 – “Italian Emission Inventory, 1990–2020. Informative Inventory Report 2022”, as well as in the emission data tables by category officially reported by Italy under the UNECE/CLRTAP Convention.
National
1990-2020
Indicator assessment
The ratio between atmospheric emissions estimated by ISPRA within the framework of the national atmospheric emissions inventory and the production outputs of organic and inorganic chemistry that result in air emissions.
In 2020, compared to 2019, the specific emissions of NOx (1,012.68 g/t) decreased by 16.4%, SOx emissions (1,012.68 g/t) increased by 58.3%, while emissions of NMVOCs (402.52 g/t) and CO (3,013.15 g/t) decreased by 3.0% and 8.4% respectively.
In general, between 1990 and 2020, there was a decrease in the specific emissions of SOx by 92%, NOx by 84.7%, and NMVOCs by 63.4%, while CO emissions increased by 61.6%. For SOx, NOx, and NMVOCs, the most significant emission reductions occurred between 1990 and 2010, with no further notable reductions or trend reversals in the following years, thus considered stable. Conversely, CO has shown an overall increasing trend since 1990: the trend is therefore considered negative.
Data
Specific emissions in the chemical industry
ISPRA elaboration based on data from ISPRA, ISTAT, and Trade Associations
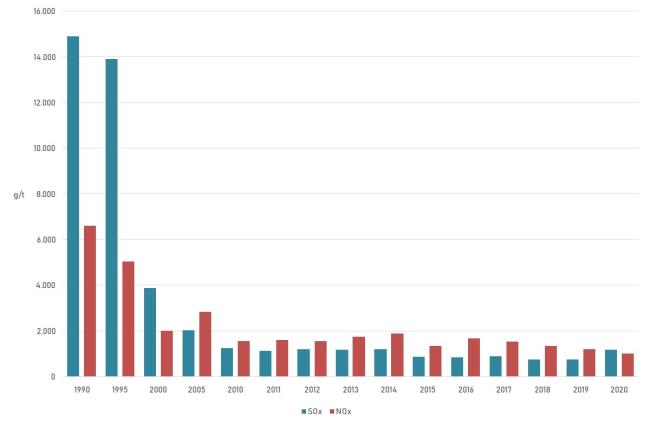
Figure 1: Specific emissions of SOx and NOx in the chemical industry
ISPRA elaboration based on data from ISPRA, ISTAT, and Trade Associations
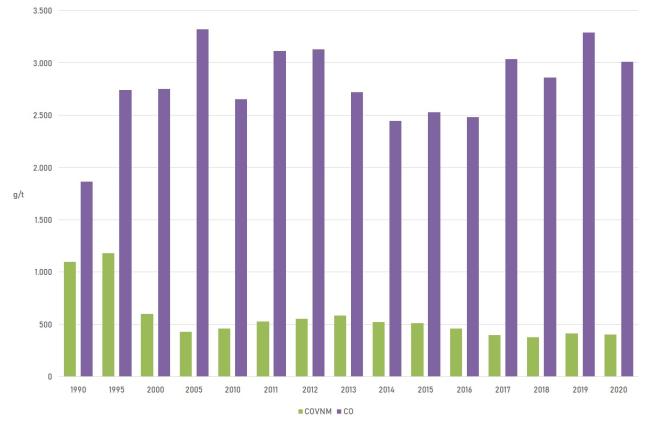
Figure 2: Specific emissions of NMVOCs and CO in the chemical industry
Elaborazione ISPRA su dati ISPRA, ISTAT e Associazioni di categoria
ISPRA elaboration, using information from ISPRA, ISTAT, and Trade Associations
The analysis of the historical series shows that the most significant reductions in the values of specific emissions of NOx, SOx, and NMVOCs—compared to the peak values recorded in 1995—occurred between 1990 and 2010. In general, the reduction was more pronounced for SOx than for NOx and NMVOCs. From 2011 to 2020, the trends for the three pollutants show no further significant reductions or reversals. In contrast, CO has steadily increased over the entire historical series, nearly increasing by half of its initial value between 1990 and 1995 (+47.0%), fluctuating around an average of 2,800 g/t, with a further increase in the last four years observed (see Table 1 and Figures 1 and 2). The annual emission trends for each pollutant are determined by the production trends of the respective polluting processes.