Gabriele Bellabarba, Francesca Sacchetti
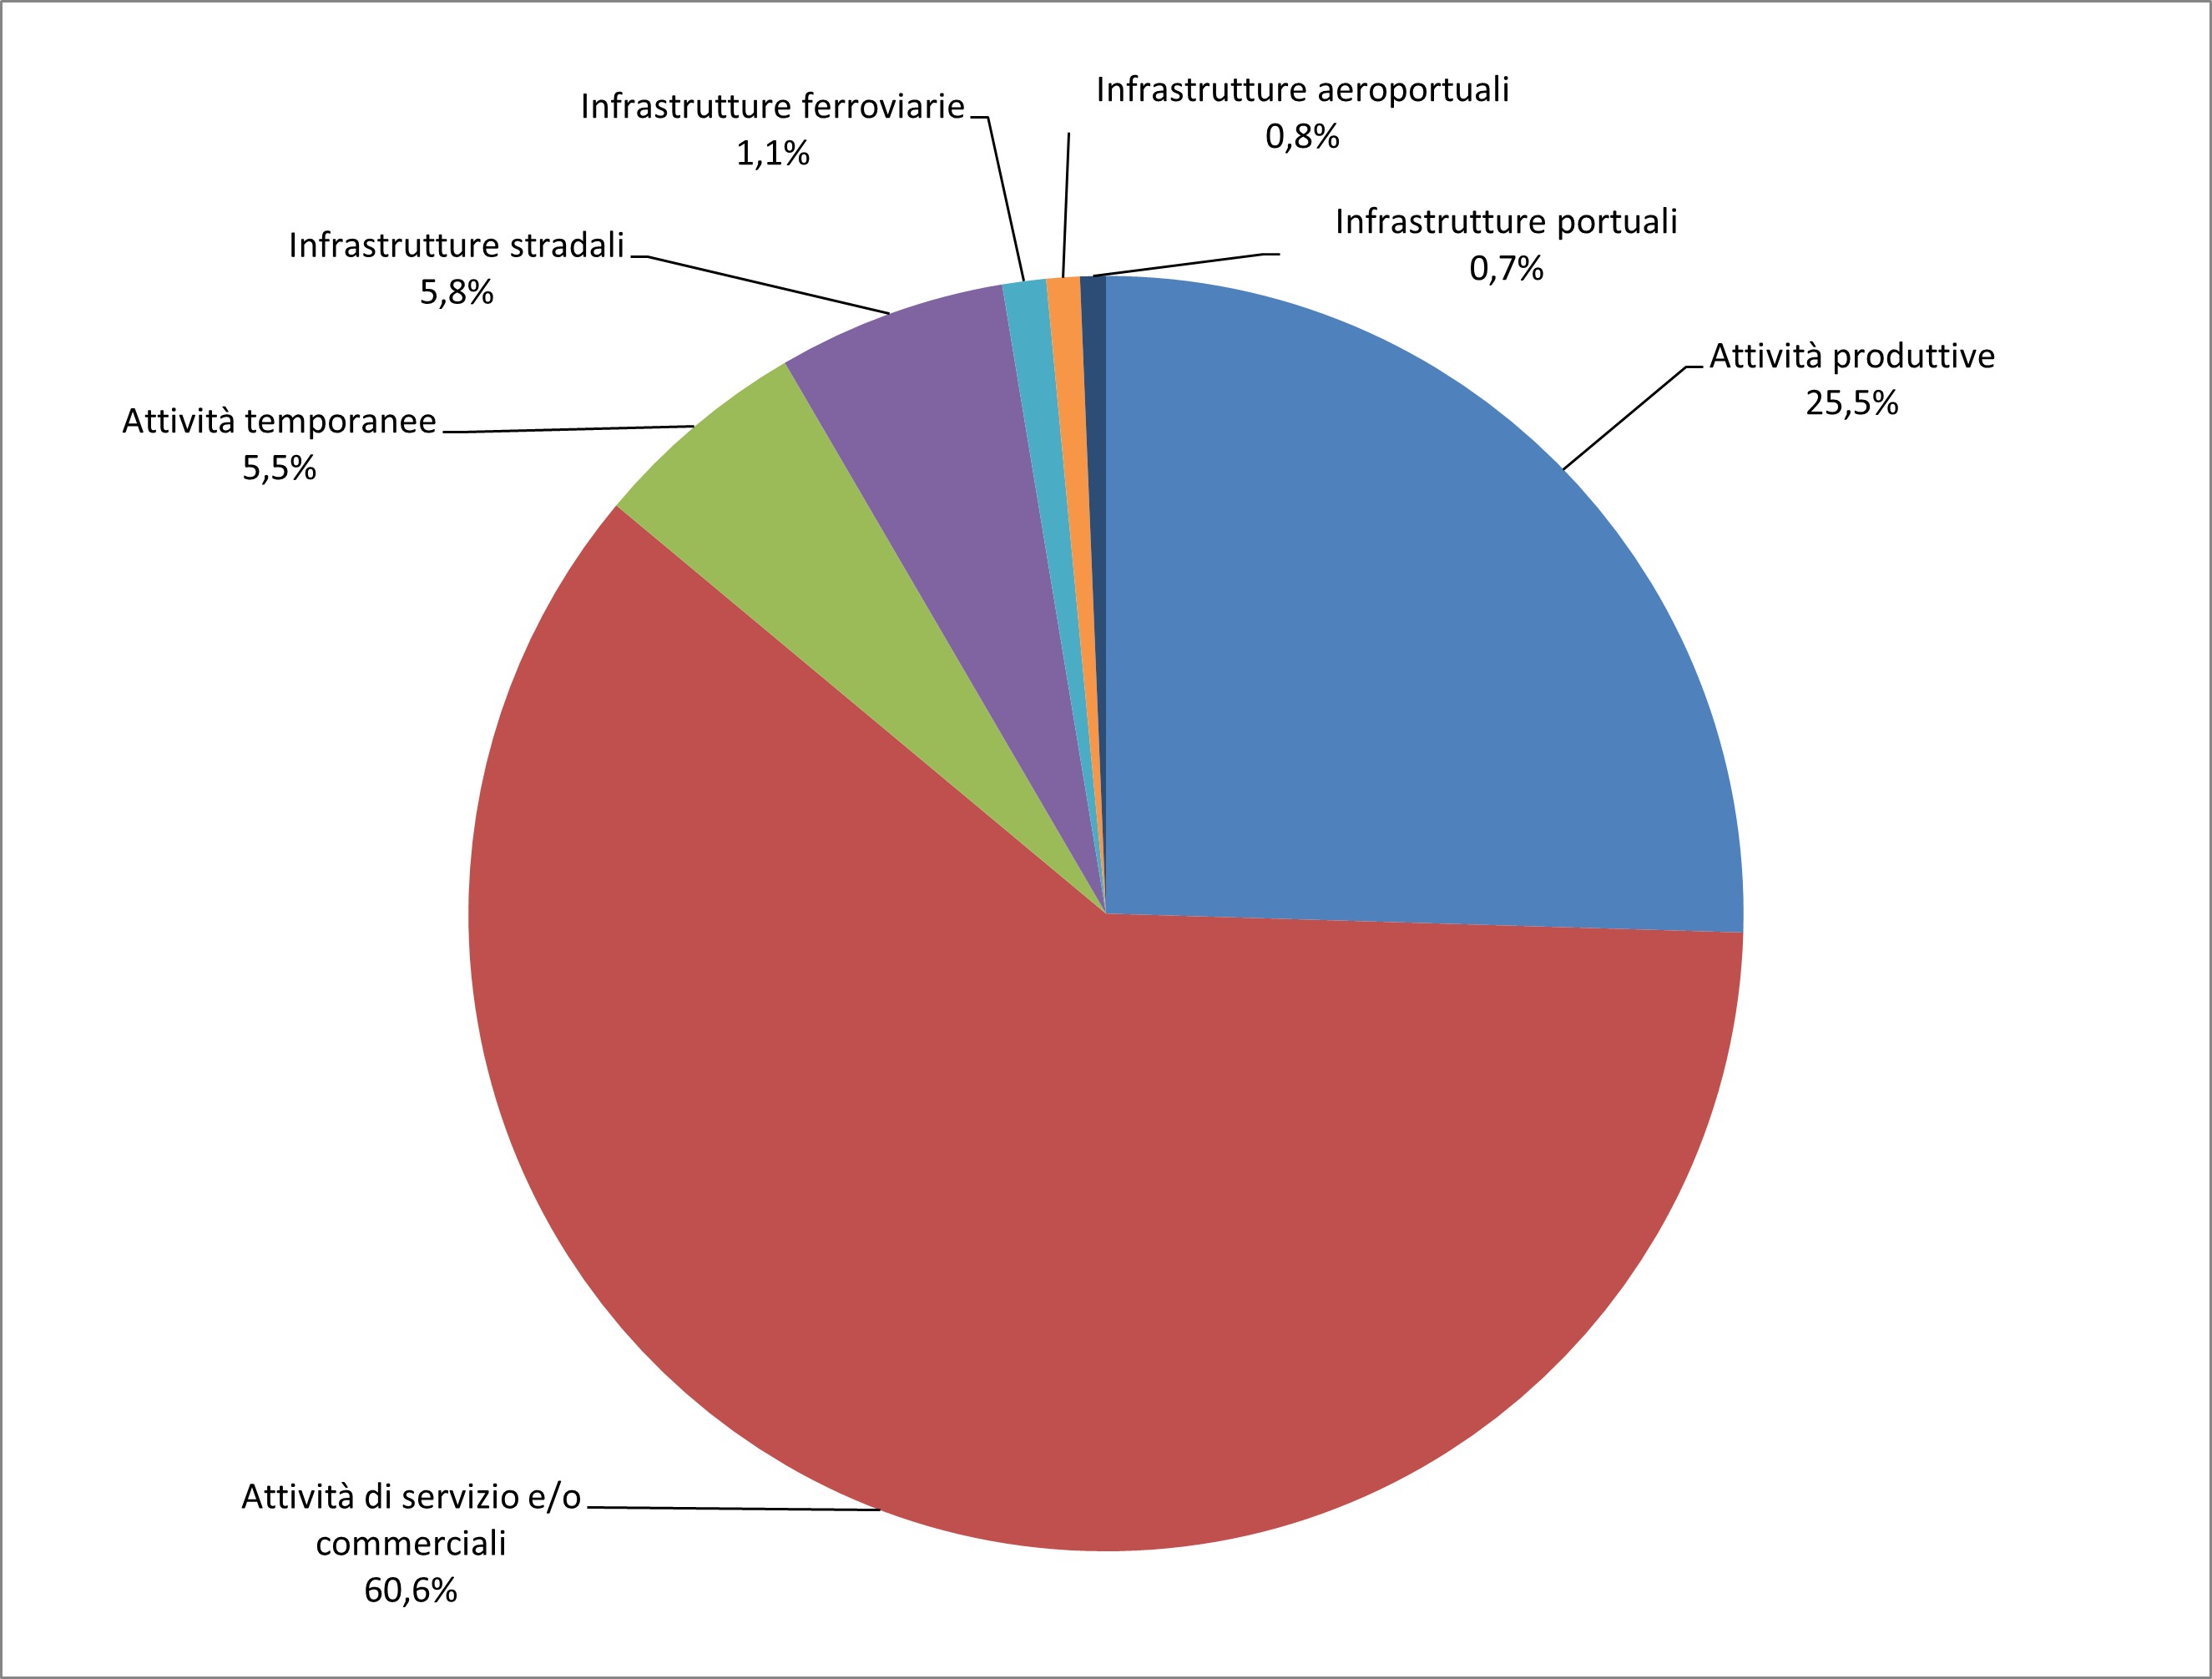
The noise produced by transport, industries and other human activities constitutes one of the main environmental problems and can cause various disturbances to the population. For the containment of noise pollution and therefore the regulation of noise sources, the national legislation on noise (LQ 447/95 and implementing decrees) has defined limit values for the different types of sources, divided into limits for the external environment (absolute immission and emission limits), in relation to the provisions of the acoustic classification of the municipal territory, and into limits within living environments (differential immission limits). The indicator describes the control activity with measurements of compliance with the limit values in force, in the external environment and/or inside living environments, carried out by ARPA/APPA, with a distinction between the different types of sources (production activities, service and/or commercial activities, construction sites and temporary events, road, railway, airport and port infrastructures). The most controlled sources, also for 2024, are service and/or commercial activities (60.6% of the total controlled sources), followed by production activities (25.5%). Among transport infrastructures, which represent 8.4% of controlled sources, roads are the most controlled (5.8%).
The indicator highlights which noise sources are most controlled by the ARPA/APPA and to what extent they present situations of non-compliance, through the definition of the percentage of controlled sources for which at least one exceedance of the limit values set by the legislation has been found.
Evaluate in qualitative and quantitative terms the noise pollution produced by the different types of noise sources.
In Table C of the Prime Ministerial Decree of 14/11/97 the absolute limit values for entry are identified, based on the six acoustic classes of the territory (I - VI) and the reference periods of the day, daytime (06:00 - 22:00) and night (22:00 - 06:00). The absolute emission limit values are defined as the maximum noise levels that can be emitted by the set of sources into the external environment, measured in proximity to the receptors. The emission limit values, which refer to the individual sound sources, are structured in a very similar way to the input ones, but are 5 dBA lower. The decree also establishes the differential release limit values, which apply within living environments; the differential criterion requires compliance with the difference of 5 dBA between the environmental noise (noise with the presence of the specific disturbing source) and the residual noise (noise in the absence of the specific disturbing source) during the daytime period, a difference which is reduced to 3 dBA during the night period; this criterion does not apply in class VI areas and to the noise produced by road, railway, airport and maritime infrastructures, by activities or behaviors not connected with production, commercial and professional needs, by services and fixed systems of the building used for common use, limited to the disturbance produced within the same. In municipalities in which a noise classification plan has not been approved, the limits identified by the Prime Ministerial Decree of 1 March 1991 apply on a transitional basis. For transport infrastructures, the immission limit values within the bands pertaining to the infrastructures themselves are set with specific implementing decrees, while outside the relevant bands the transport infrastructures contribute to achieving the absolute immission limit values set out in Table C of the Prime Ministerial Decree. 14/11/1997, defined in the territory by the municipalities in their acoustic classification plans. To date, the following decrees have been issued: Ministerial Decree 31/10/97 for airport noise, Presidential Decree 18/11/98 n. 459 for railway noise and Presidential Decree 30/03/2004 n. 142 for road noise; while the decree identifying limits for port infrastructures has not yet been issued (in the absence of which the limits established by the acoustic classification of the territory apply).
-
The data collected relates solely to the control activities carried out by ARPA/APPA through phonometric measurements.
-
ARPA/APPA (Regional and Autonomous Province Agencies for Environmental Protection)
ISTAT
The data used to develop the indicator are present in the Osservatorio Rumore database, populated by ARPA/APPA representatives and consultable, also by the public, on the website https://agentifisici. isprambiente. it/associazionetoriorumore_public/home. php
National, Regional (19/20)
2000-2003; 2006-2024
The indicator highlights the percentage distribution of the sources subject to control into the different types (activities/infrastructures) and the percentage of sources for which regulatory limits have been exceeded, evaluated as the ratio of the number of controlled sources for which an exceedance has been highlighted to the total of controlled sources, broken down by type of source. The indicator also reports the number of controlled sources per 100,000 inhabitants.
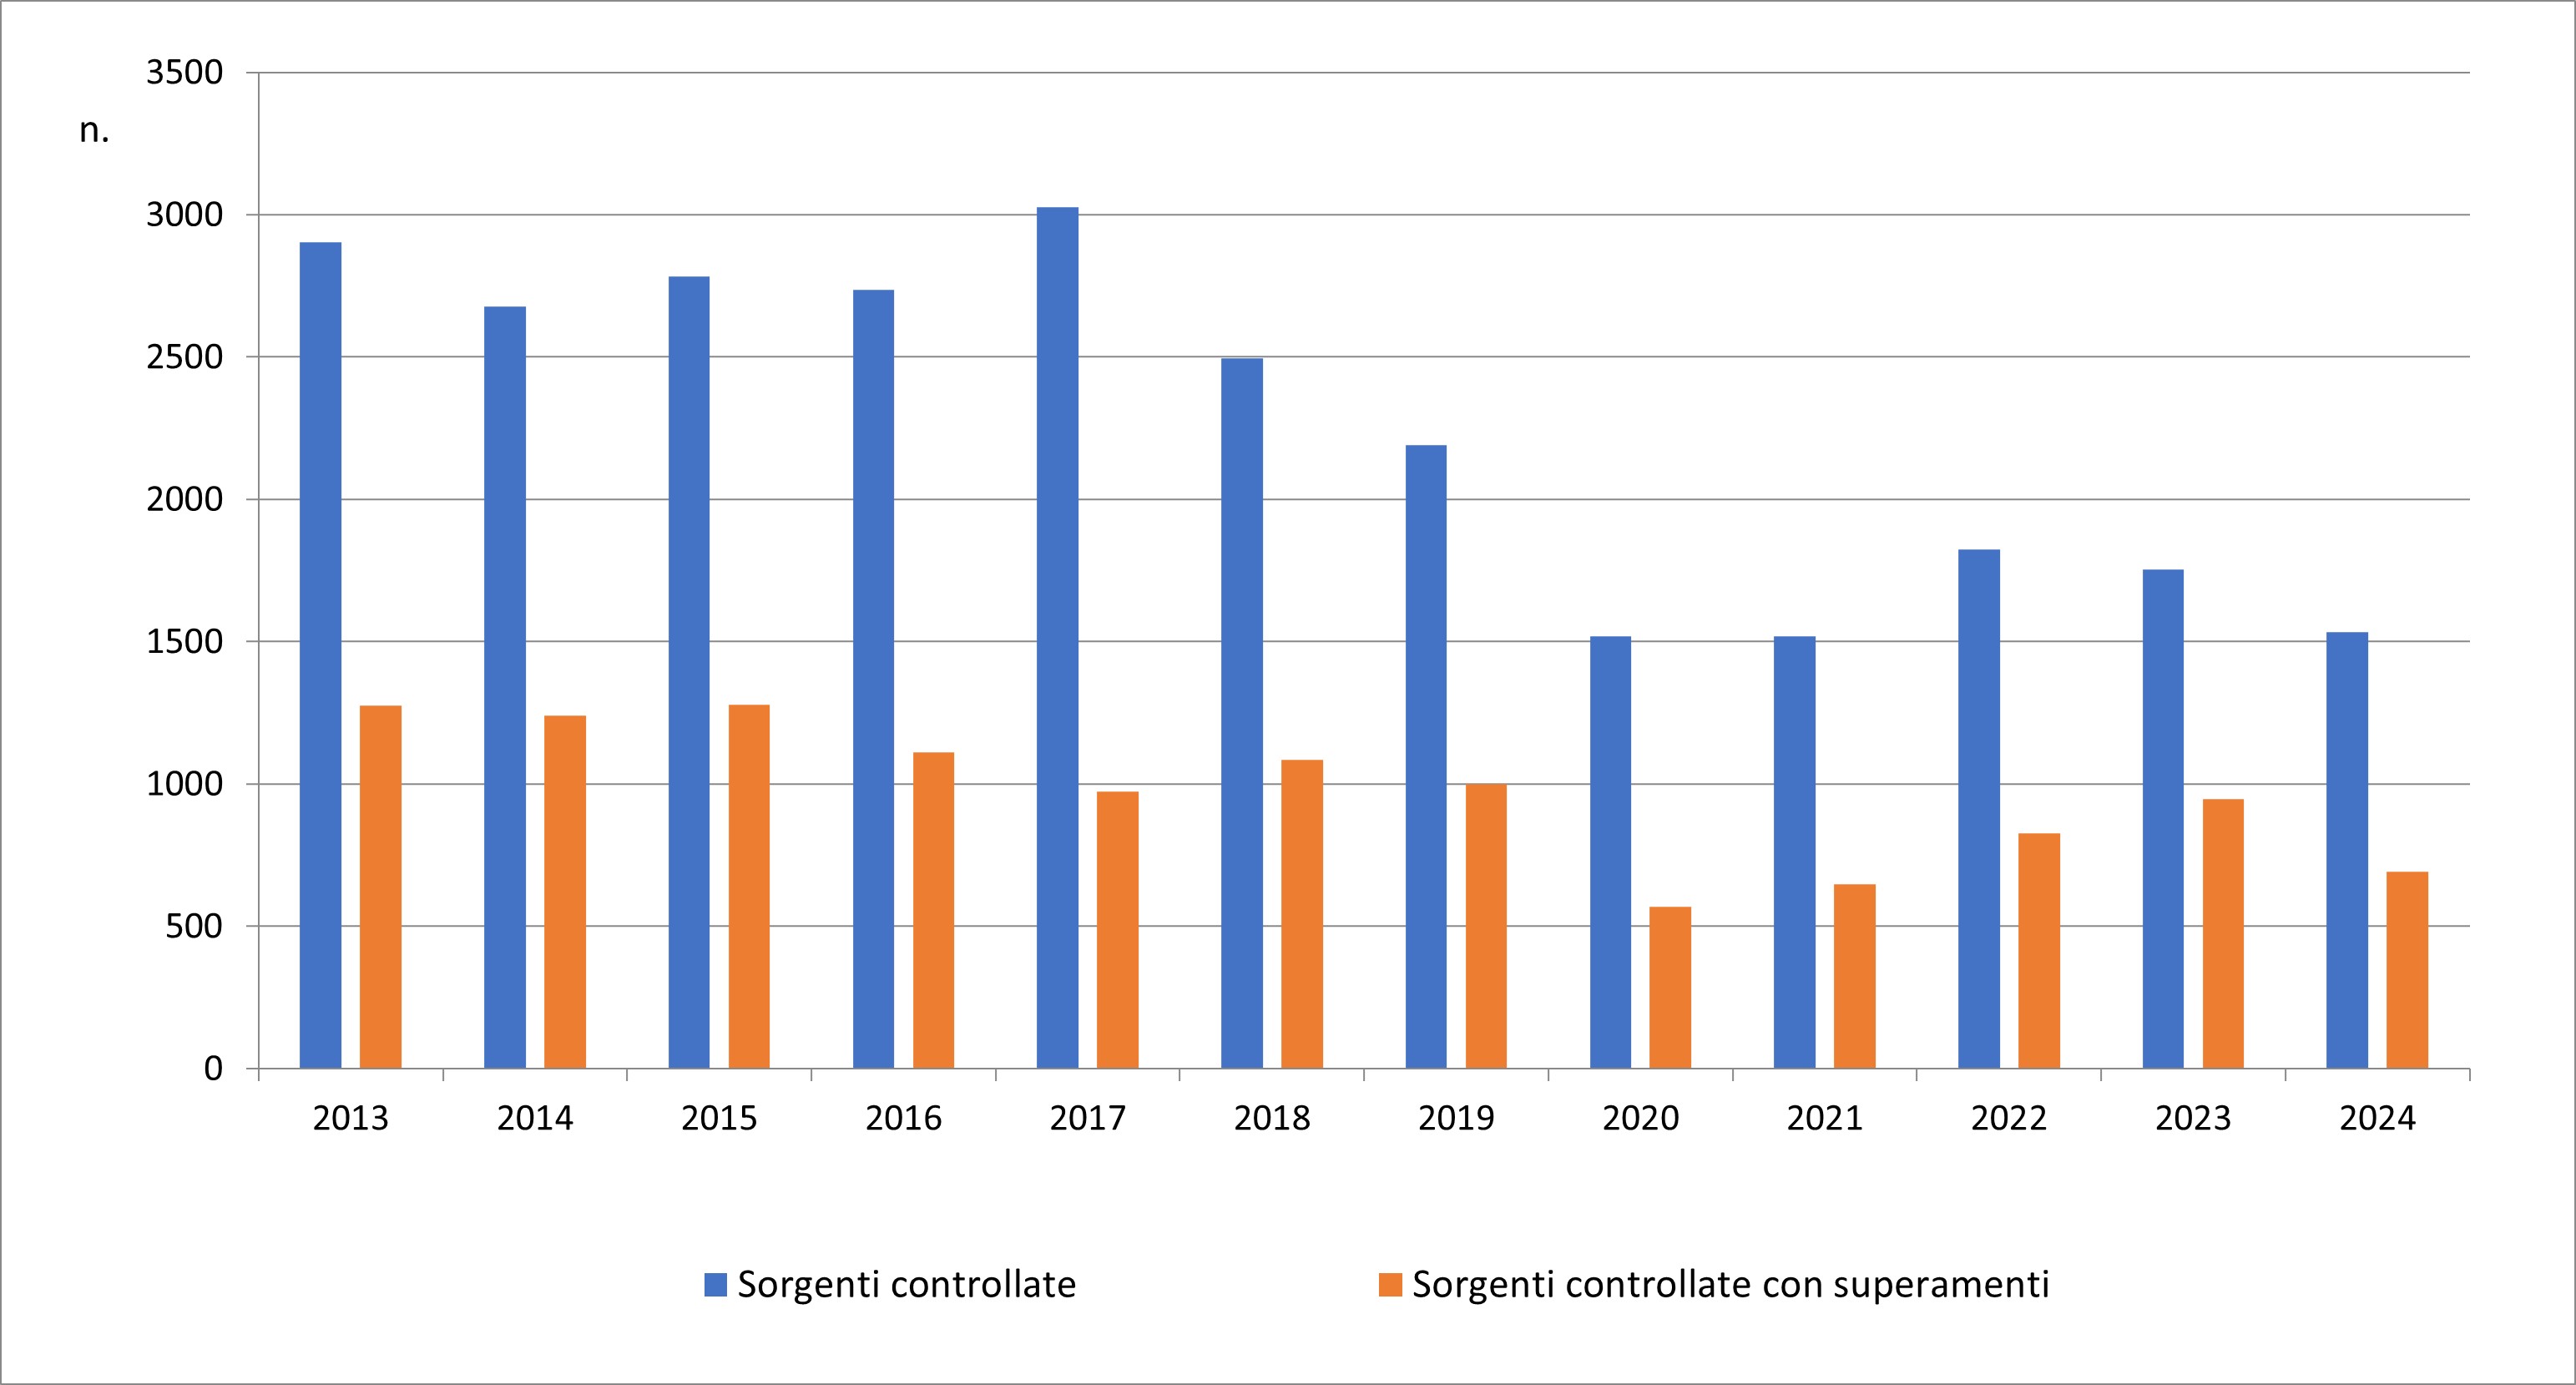
From the available data, in 2024, 1,535 noise sources were checked by the ARPA/APPA (Table 1), of which 1,443 were checked following a complaint; in 45.1% of the controlled sources at least one exceedance of the regulatory limits was detected, which highlights how noise pollution is a non-negligible environmental problem (Figure 4).
Analyzing the incidence on the national territory (Figure 3), it can be seen that 2.6 sources per 100,000 inhabitants were controlled; out of 1.2 controlled sources (per 100,000 inhabitants), at least one exceedance of the regulatory limits was found, a lower incidence than that found in 2023 (1.6 controlled sources with exceedance per 100,000 inhabitants).
In 2024, the percentage of sources for which at least one exceedance of regulatory limits was detected is still significant (45.1%), lower than that found in 2023 (-8.8 percentage points compared to 2023), but comparable with that of 2022 (45.4%).
The incidence on the territory of controlled sources per 100,000 inhabitants in 2024, equal to 2.6, is lower than that of 2023 (3.0), but in line with that recorded in 2022 and 2021 (2.6)
| Allegati |
|---|
Thumbnail
Headline
Figure 1: Percentage of controlled sources (2024) Data source
Processing by ISPRA based on ARPA/APPA data |
Thumbnail
Headline
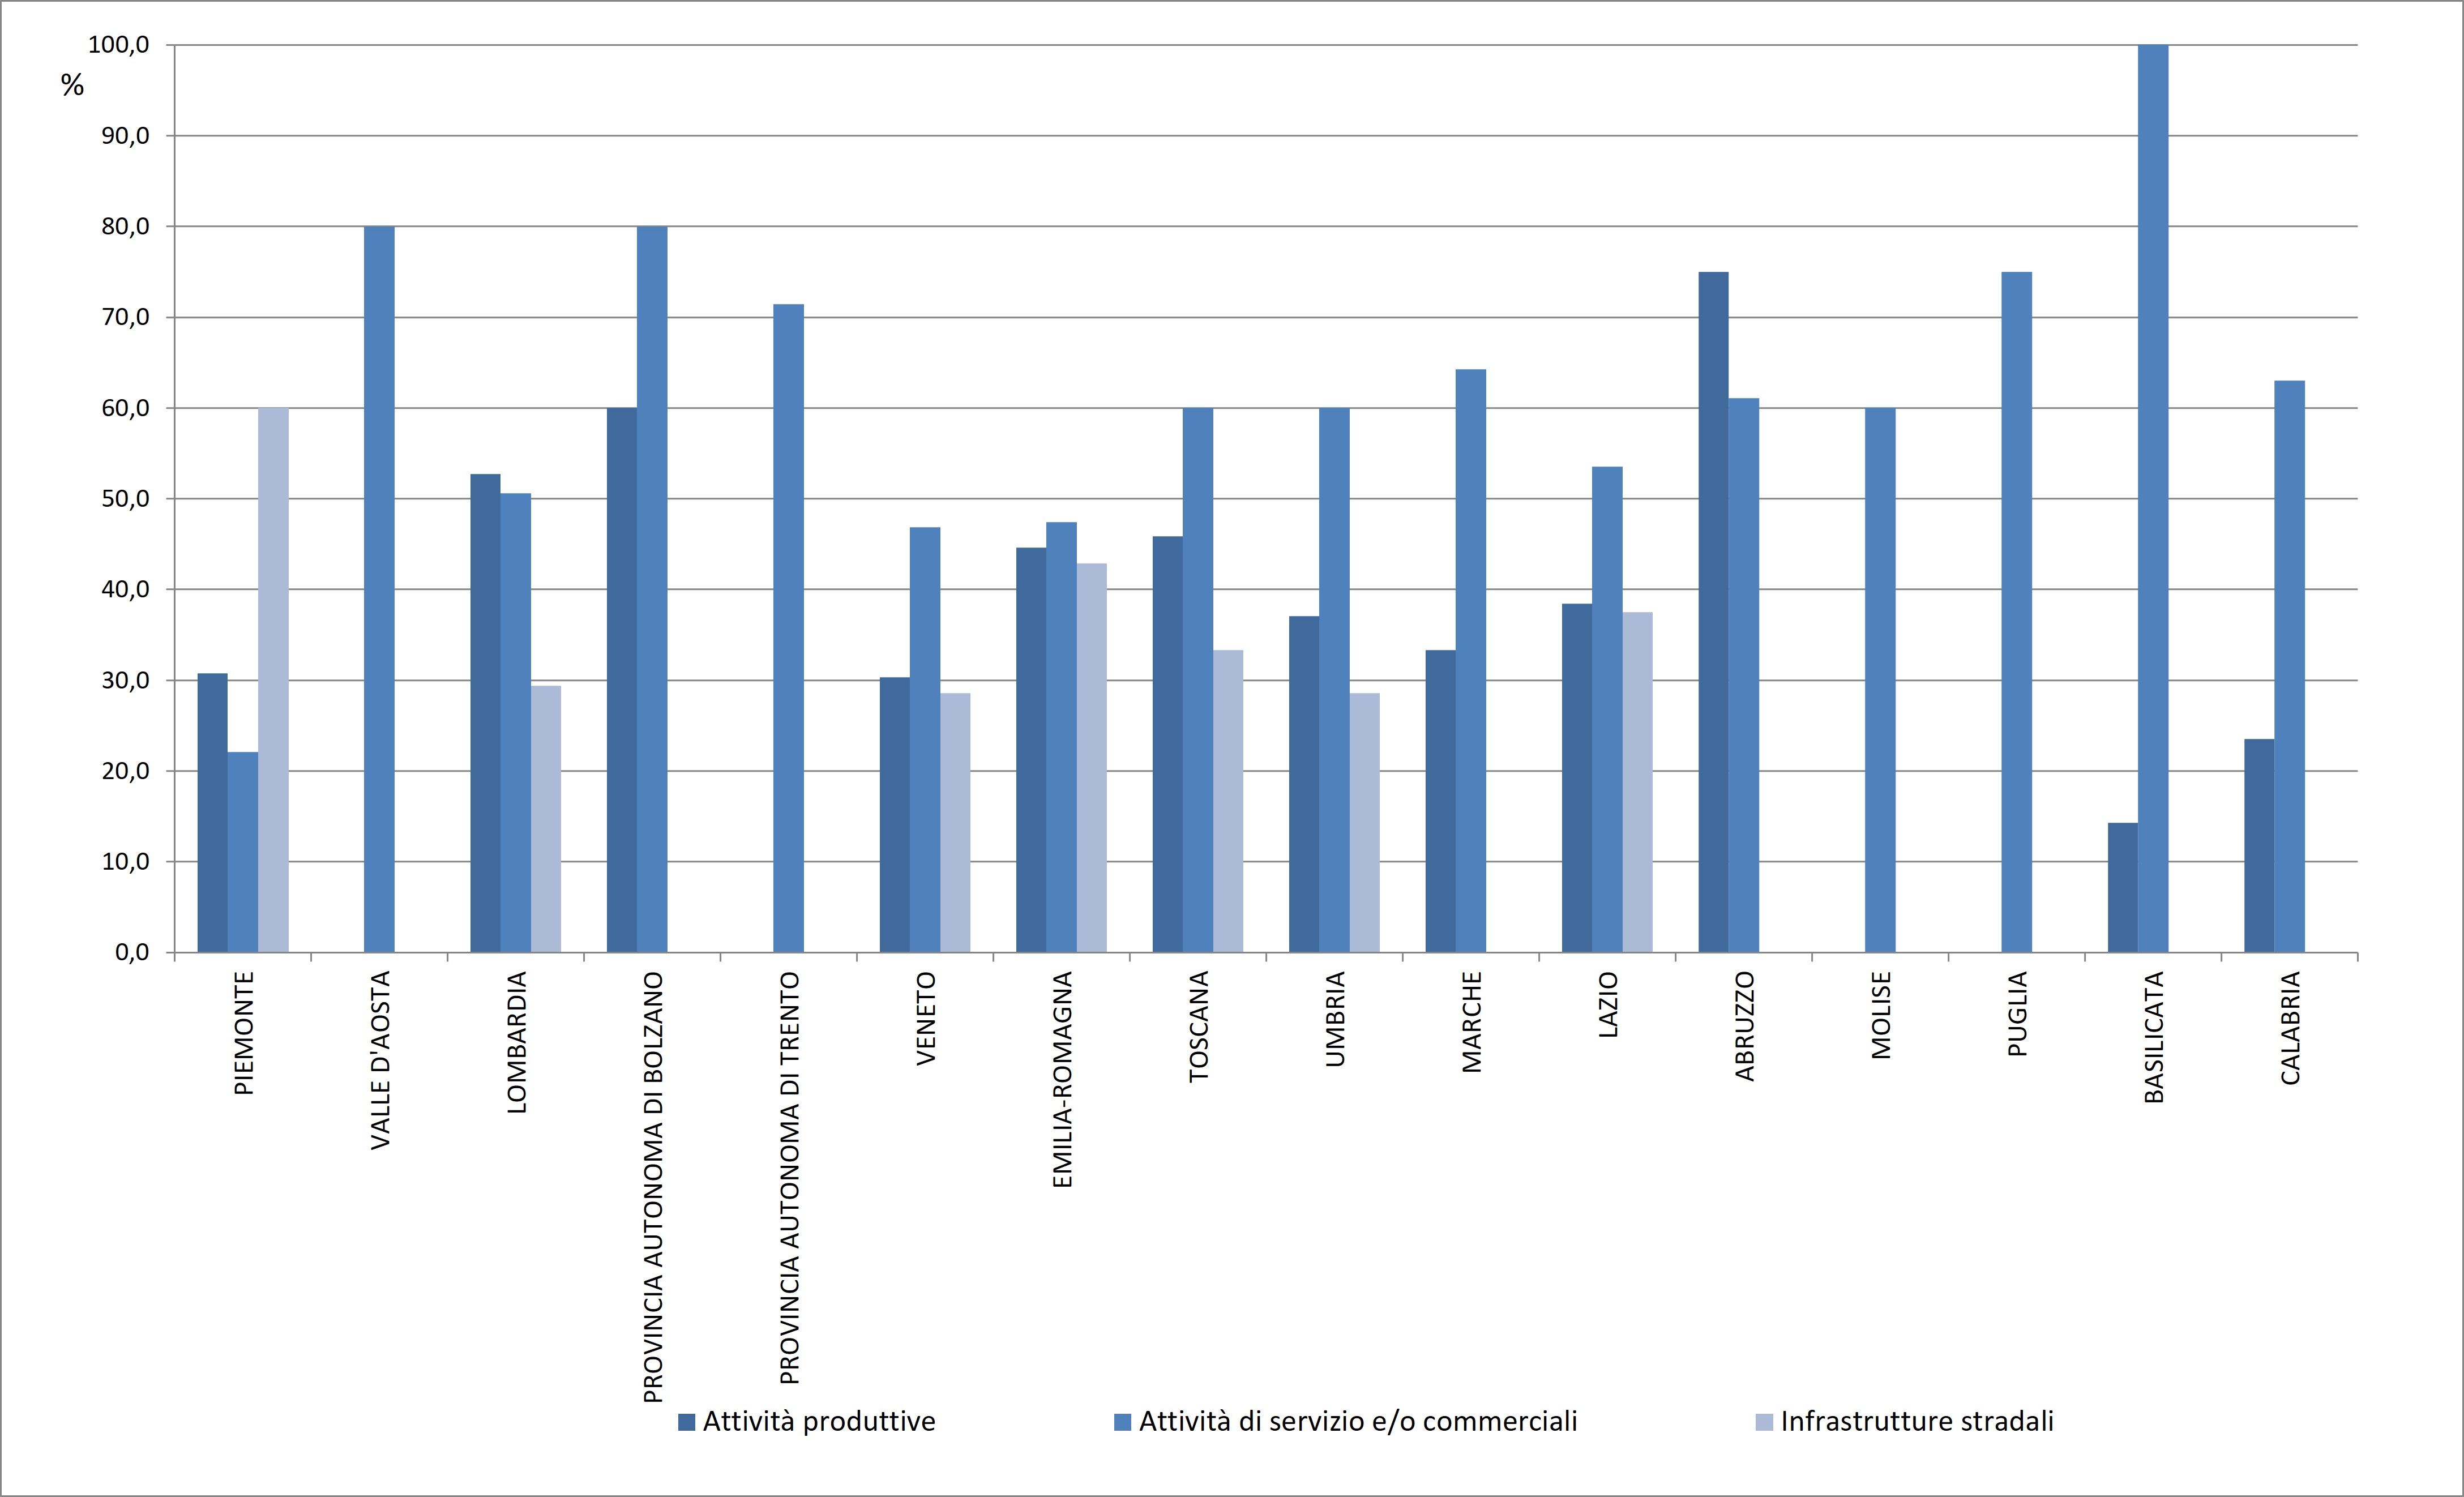
Figure 2: Percentage of exceedances of limit values (2024) Data source
Processing by ISPRA based on ARPA/APPA data |
Thumbnail
Headline
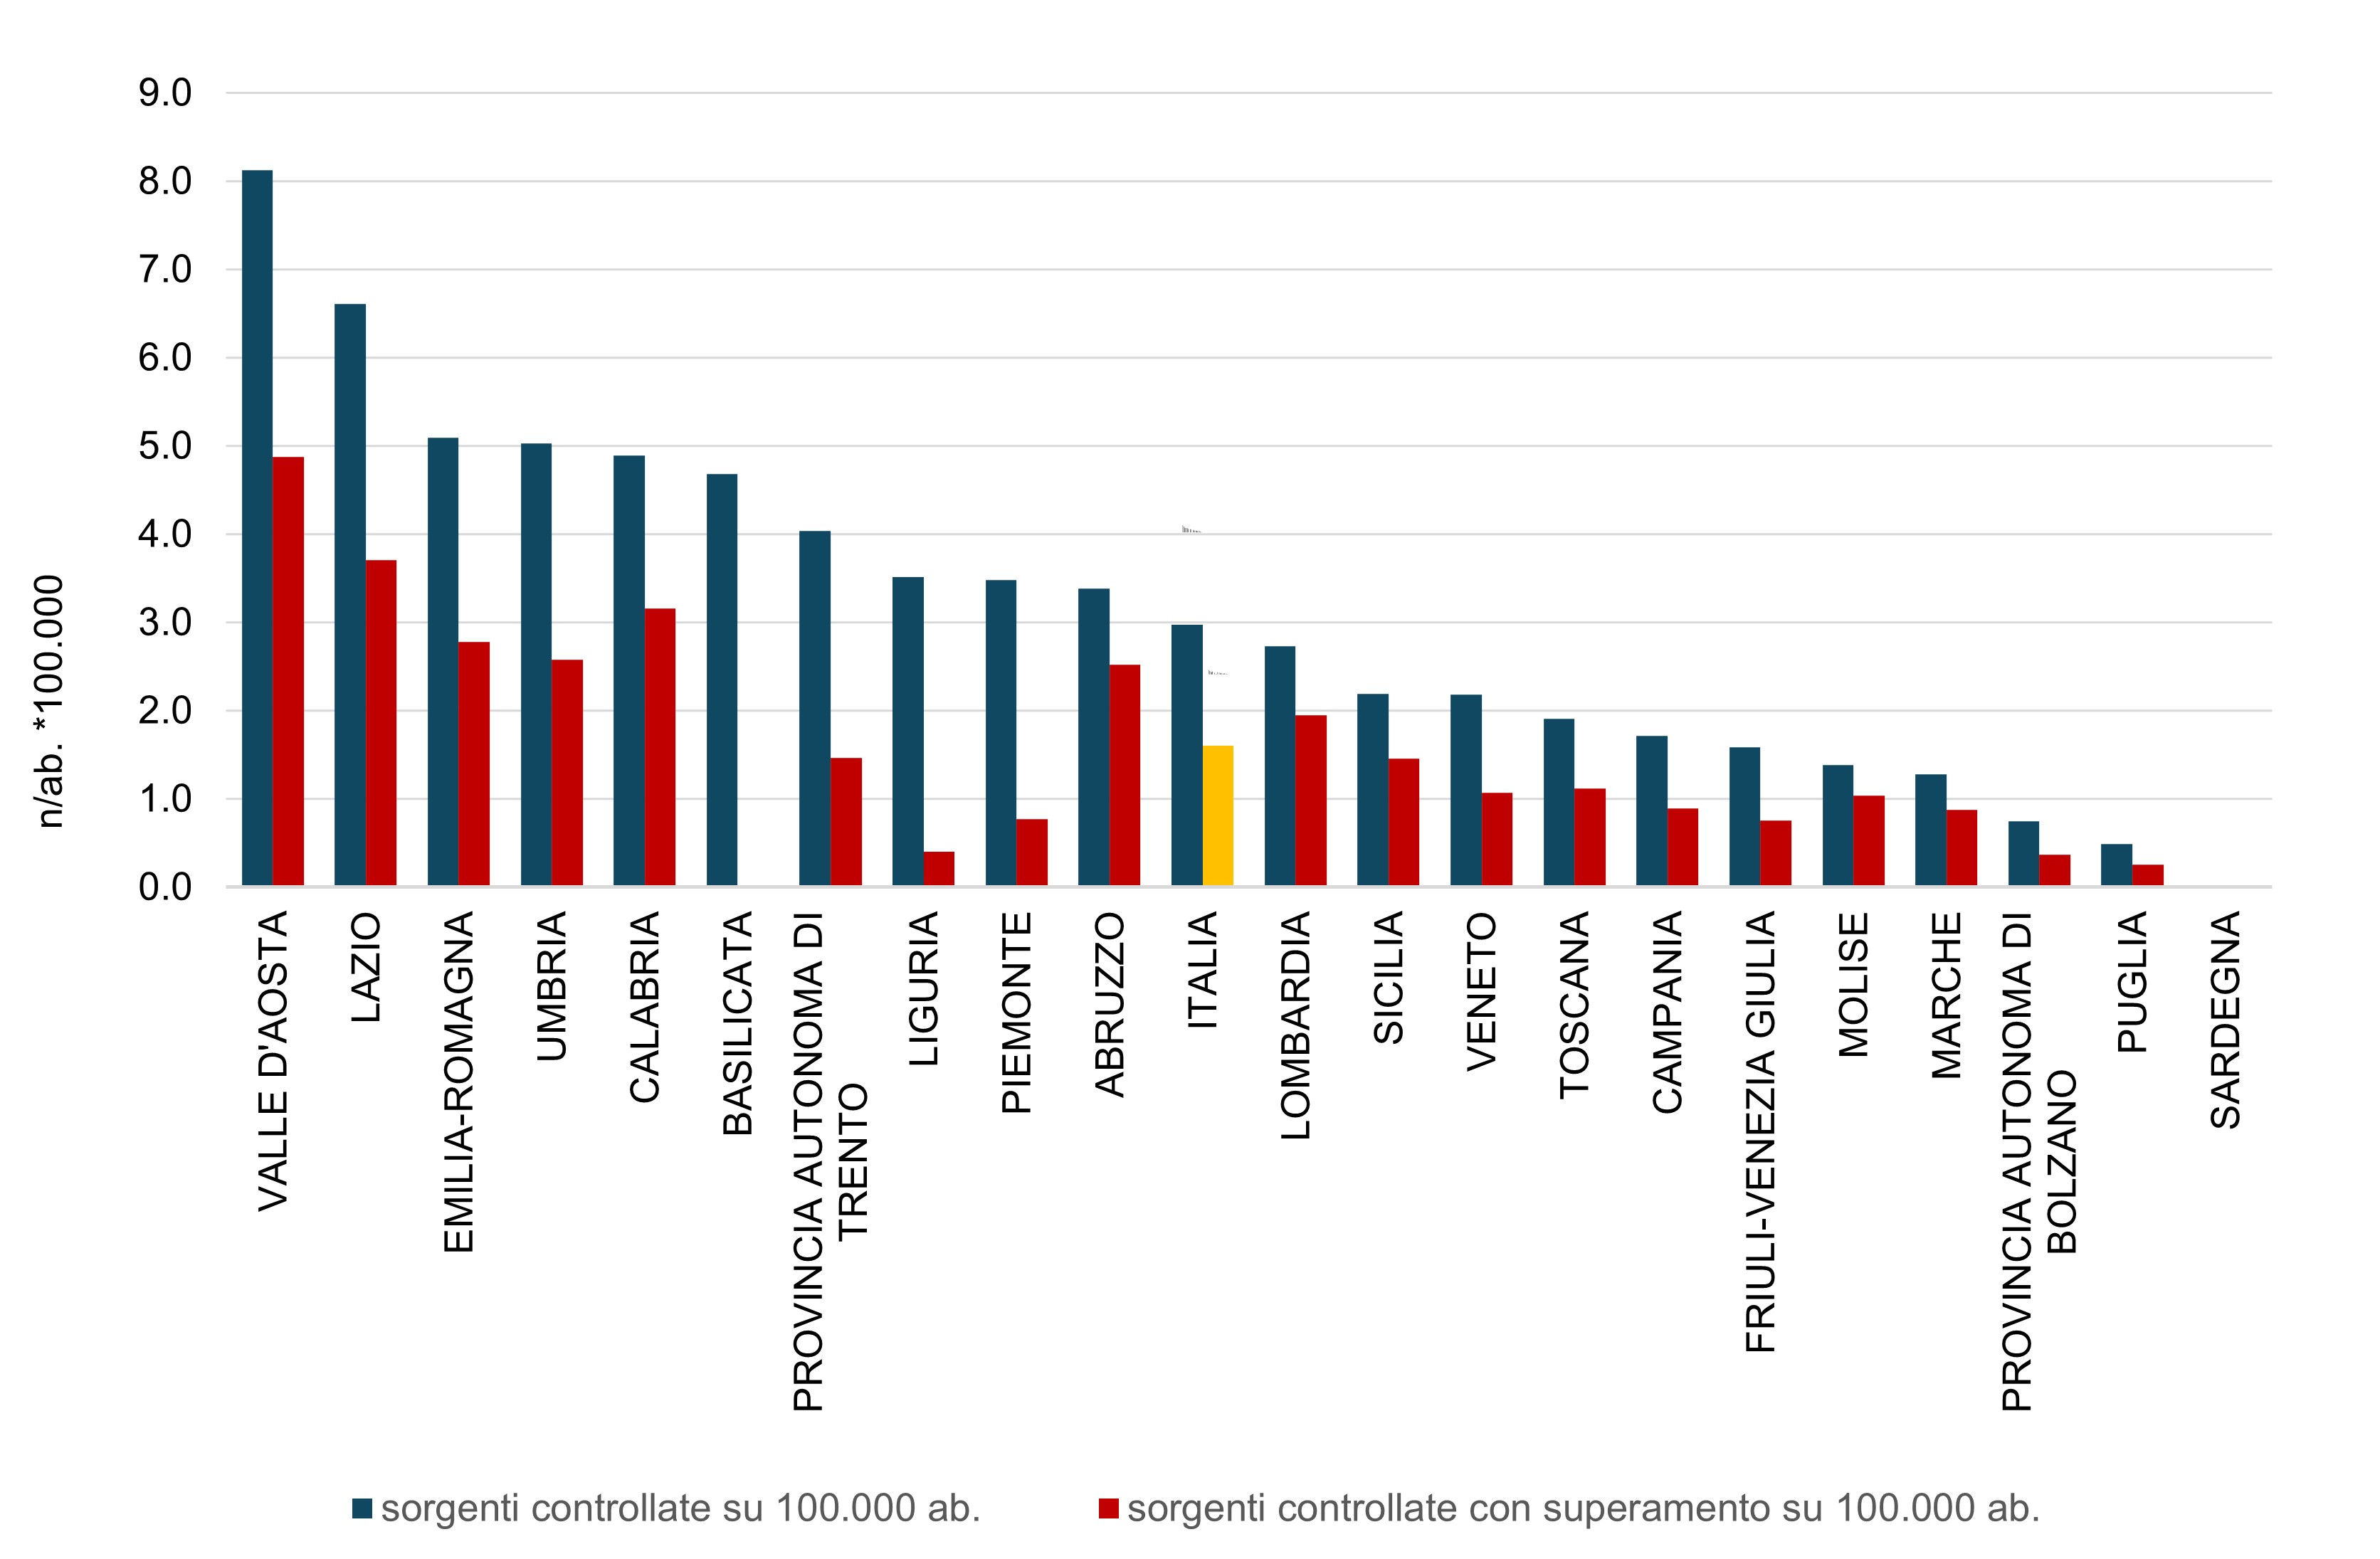
Figure 3: Incidence of controlled sources and controlled sources with exceedances per 100,000 inhabitants (2024) Data source
Processing by ISPRA based on ARPA/APPA data |
Thumbnail
Headline
Figure 4: Trends in controlled sources and sources with exceedances Data source
Processing by ISPRA based on ARPA/APPA data |
Headline
Table 1: Number of controlled sources by Region/Autonomous Province Data source
Processing by ISPRA based on ARPA/APPA data |
Headline
Table 2: Percentage of controlled sources for which exceedances of limit values were identified (2024) Data source
Processing by ISPRA based on ARPA/APPA data |
Also in 2024, service and/or commercial activities, in line with what has been found in past years, are the most controlled sources, equal to 60.6%, followed by production activities (25.5%). Among the transport infrastructures, which represent 8.4% of the controlled sources, roads, as in past years, are the most controlled infrastructures (5.8% of the total) (Figure 1).
The control activity is carried out mainly following reports/complaints from citizens, representing globally 94% of the controlled sources in 2024 (1,443). Service and/or commercial activities are also the sources for which the highest percentage of exceeding regulatory limits is found, equal to 53.4%, followed by road infrastructures (36%) and production activities (35.3%); significant exceedances are also found for road infrastructures (29.4%) and for temporary activities (24.7%). (Table 2 - Figure 2).
In 2024, we report an incidence on the national territory of 2.6 controlled sources per 100,000 inhabitants and for 1.2 controlled sources (per 100,000 inhabitants) at least one exceedance of the regulatory limits was found. The Regions in which the incidence of controlled sources is higher than the national average are: Valle d'Aosta (7.3), Umbria (5.8), Emilia-Romagna (5.6), Calabria (3.8), Piedmont (3.5), Province of Trento (3.3), Lazio (3.2) and Lombardy (2.9); while those with significantly lower values are Puglia (0.3), Campania (1.1), Marche (1.4) and Abruzzo (1.8) (Figure 3).
Data relating to the Sardinia region have not been received.