Giovanni Finocchiaro, Mariangela Soraci
The indicator measures the number of active industrial enterprises (industry in the strict sense), their operating local units, and the employees engaged in them, providing a snapshot of the national production structure and its evolution. In 2023, the number of active enterprises in industry amounted to 385,093, representing a slight decrease compared with 2022 (-1.4%). The territorial distribution remains highly concentrated, with more than half of all enterprises located in Northern Italy. Employment reached 4,206,762 persons, an increase of 1.7% over the previous year. Overall, manufacturing continues to be the dominant industrial sector, accounting for more than 90% of total industrial employment.
The indicator measures the number of industrial enterprises (industry in the strict sense) operating during the reference year, together with their production local units and the persons employed. According to the ATECO 2007 Classification – 2022 Update, industry in the strict sense comprises Sections B (Mining and quarrying), C (Manufacturing), D (Electricity, gas, steam and air conditioning supply), and E (Water supply; sewerage, waste management and remediation activities). Pursuant to Article 2 of Regulation (EU) 2019/2152, an enterprise is the smallest combination of legal units that constitutes an organisational unit producing goods or services and benefiting from a certain degree of autonomy in decision-making, particularly regarding the allocation of its current resources. Each enterprise may carry out one or more economic activities at one or more locations; each production site is defined as a local unit. The number of persons employed is calculated as the annual average of both employees and self-employed workers.
Quantify the industrial companies, the local production units present in the area and the number of employees. This descriptive and contextual information gives a representation of the state and demographic evolution of one of the anthropic (economic) determinants with the greatest impact on the environment and health.
Introduce a further layer of analysis of companies based on their size.
Istat (National Institute of Statistics)
Istat, Statistical register of active companies (Asia-Businesses) accessible to the database http://dati. istat. it/ under the headings: Companies/Structure/Companies and employees and Local units and employees.
National
Regional
2012-2023
The basic data are presented as is or following minimal mathematical processing (e.g. year-on-year percentage changes, geographical percentage distribution, and sectoral composition).
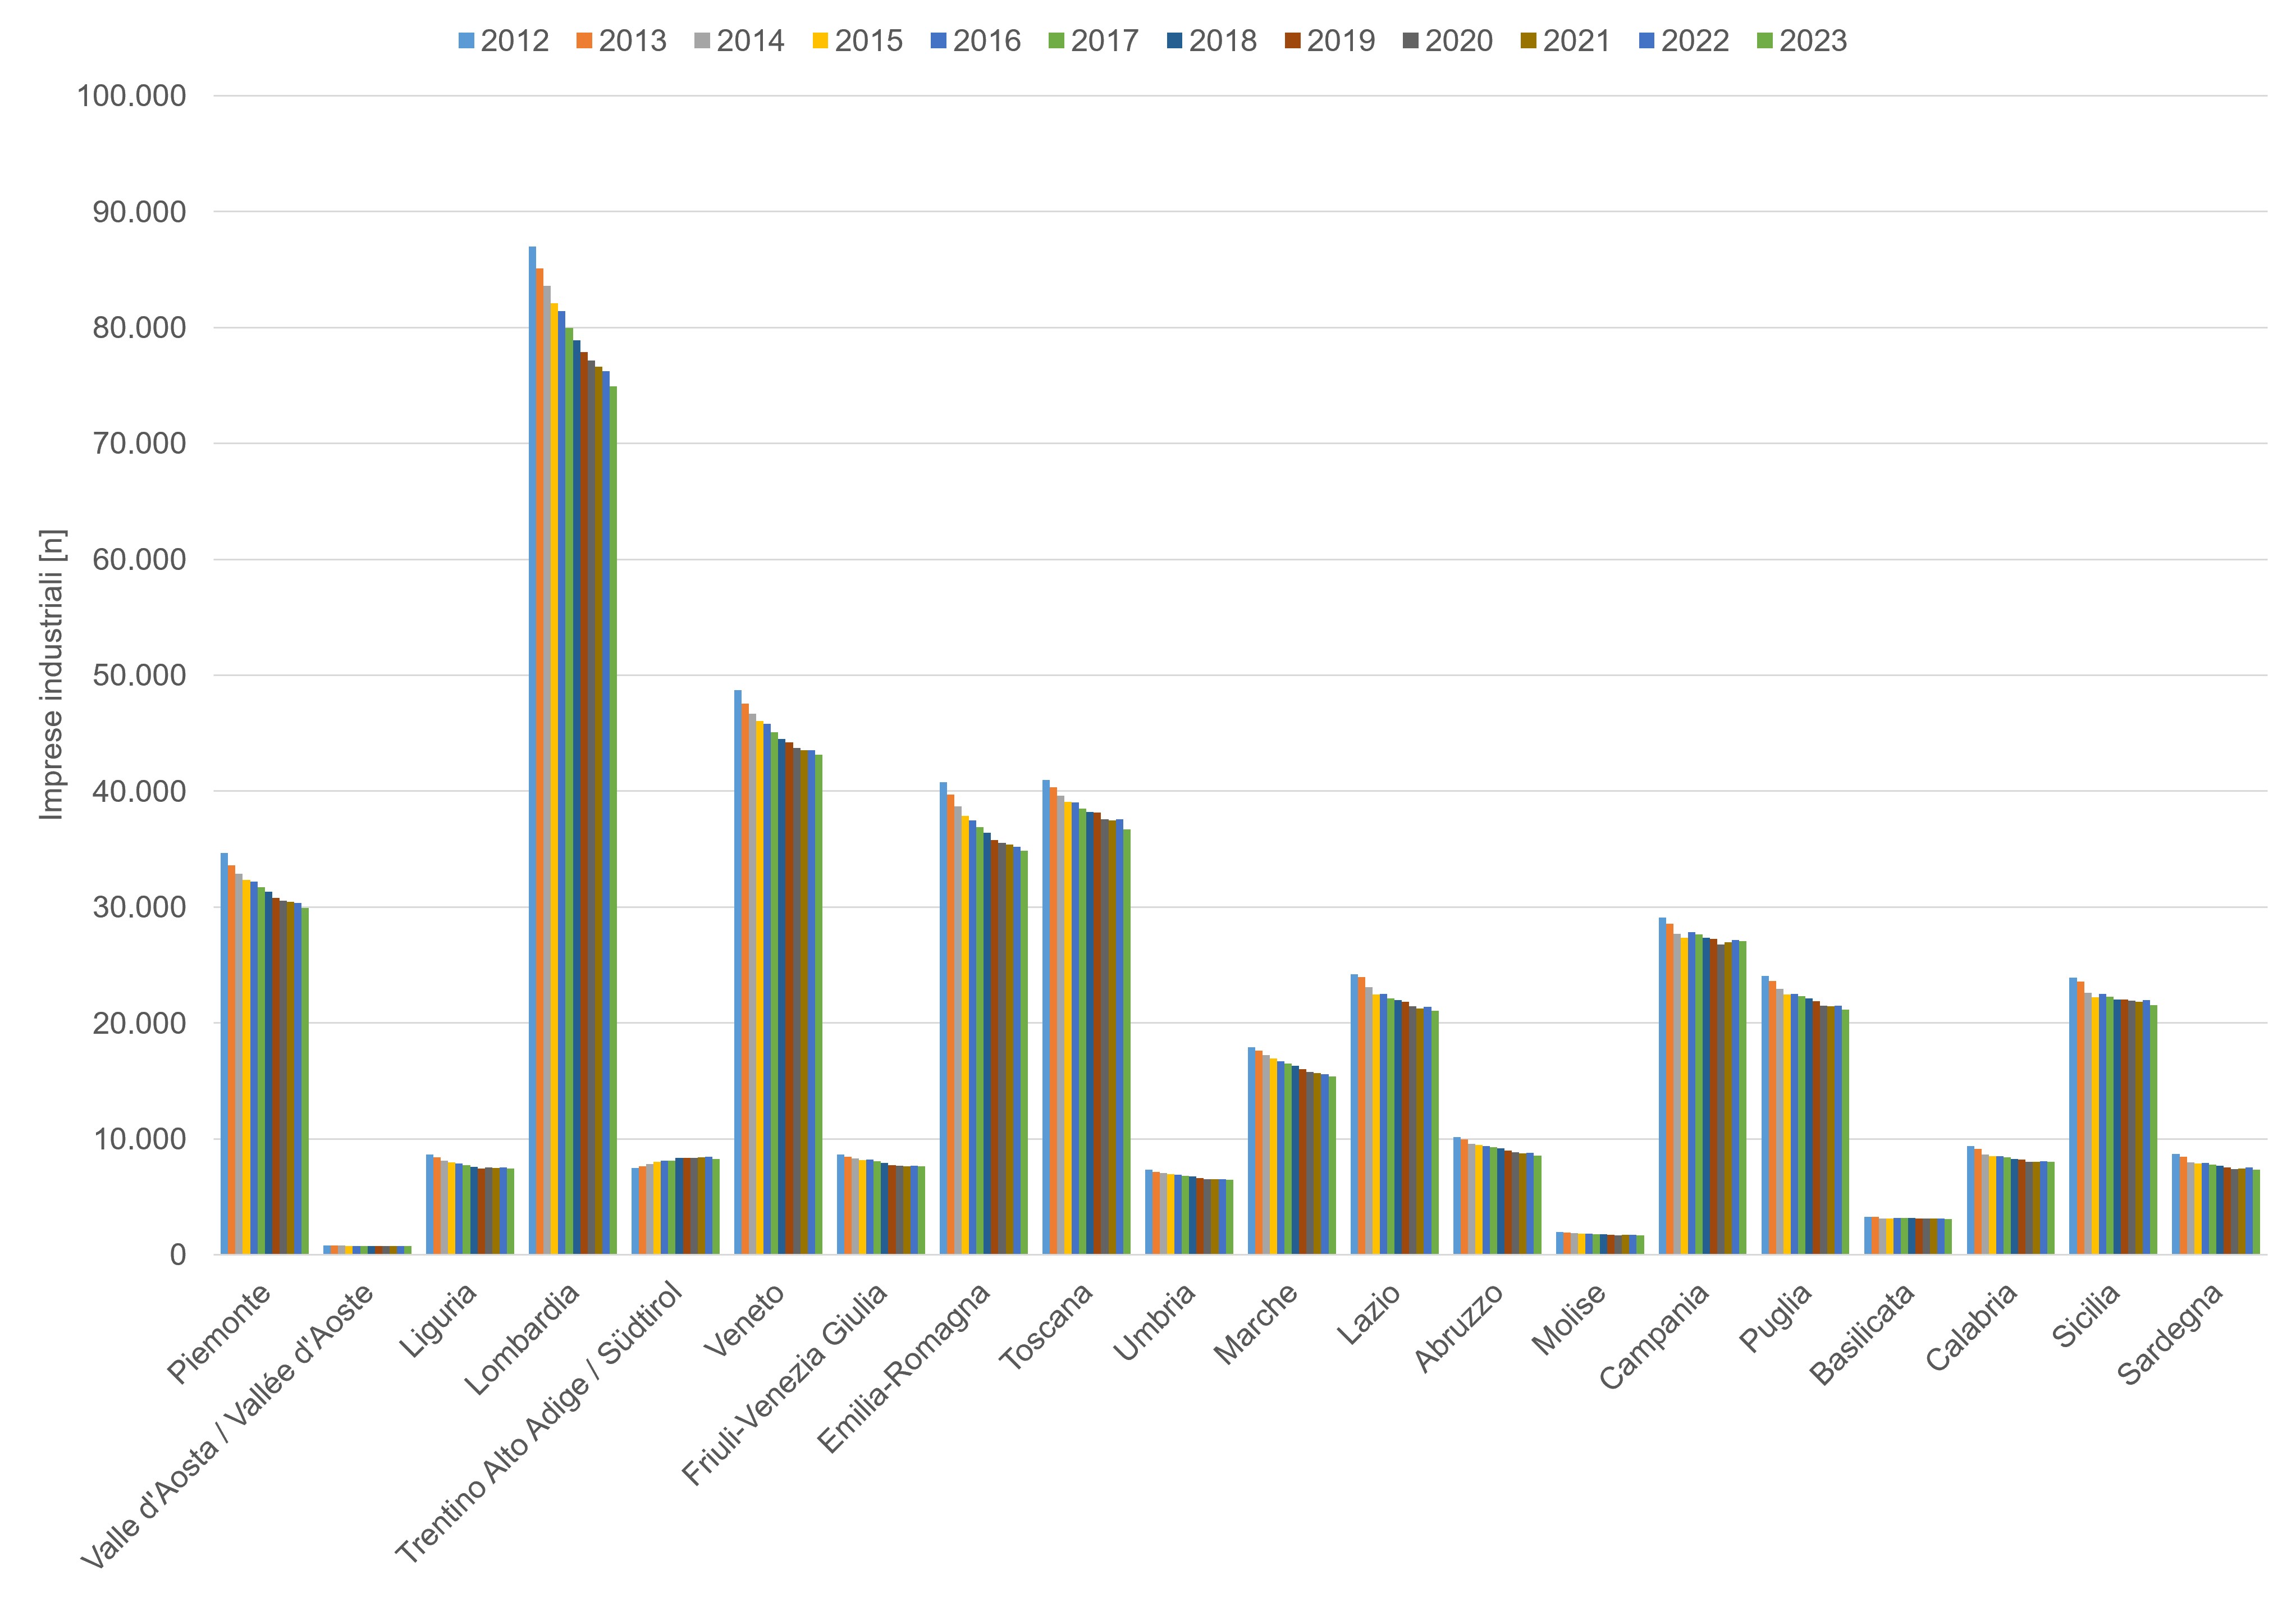
In 2023, the Italian industrial production system showed positive signs overall. While the number of enterprises declined slightly (Figure 1, Table 1), employment increased by approximately 60,000 persons (Table 2). The North-West of Italy accounts for 29.4% of enterprises and 36.61% of employment, followed by the Northeast (24.4% of enterprises and 30% of employment) and Central Italy (20.7% of enterprises and 18.3% of employment). Southern Italy and the Islands together account for just over one quarter of all enterprises and approximately 15% of total industrial employment (Tables 1 and 2). The average number of employees per local unit reached 9.7 (Table 3), confirming the gradual increase in average enterprise size observed over the last decade. From an environmental perspective, however, this overall stability does not yet indicate a clear shift towards production models with lower environmental impacts. Consequently, the current situation can still be regarded as broadly neutral, with improvements mainly confined to the most innovative industrial sectors.
Between 2012 and 2023, the Italian industrial base contracted by 12% (Table 1), while the number of local units declined by 12.3% (Table 3). In contrast, industrial employment increased by 1.9%, reflecting the recovery recorded in recent years (Table 3). Although the number of manufacturing local units fell by 14.3% (Table 3), employment in manufacturing recorded a slight increase (+0.92%). Meanwhile, the energy supply sector experienced significant structural expansion, with local units increasing by 43.02% over the 2012–2023 period. Overall, the ratio of employees to local units rose moderately, increasing from 8.35 to 9.7 employees per local unit (Table 3). From an environmental standpoint, the overall trend remains essentially neutral, as the slight reduction in the number of enterprises and the expansion of some more energy-efficient sectors have not yet translated into a measurable reduction in overall environmental pressures.
| Allegati |
|---|
Headline
Table 1: Number of industrial enterprises (industry in the strict sense) by region Data source
ISPRA elaboration on Istat data |
Headline
Table 2: Employees in industrial enterprises (industry in the strict sense) by economic activity section, region, and regional aggregate (2023) Data source
ISPRA elaboration based on Istat data |
Headline
Table 3: Local units and employees by economic activity section, industry in the strict sense (ATECO 2007 2-digit level) (2012–2023) Data source
ISPRA elaboration based on Istat data |
Headline
Table 4: Local units and employees of active enterprises by regional aggregate (2022–2023) Data source
ISPRA elaboration based on Istat data |
Headline
Figure 1: Number of industrial enterprises (industry in the strict sense) by region (2012–2023) Data source
ISPRA elaboration based on Istat data |
Thumbnail
Headline
Figure 1: Number of industrial enterprises (industry in the strict sense) by region (2012–2023) Data source
ISPRA elaboration based on Istat data |
The 2023 data confirm the predominance of manufacturing, which accounts for approximately 92% of total industrial employment (Table 2). The sectors with the largest number of local units remain the manufacture of fabricated metal products (76,956 enterprises), food manufacturing (53,036), and the repair and installation of machinery and equipment (38,553) (Table 3). Although the electricity supply and waste management sectors together account for just over 7% of all enterprises (Table 2), they recorded the highest structural growth rates over the last decade. The geographical distribution (Table 2) continues to show Lombardy as the leading region, with more than 74,000 enterprises and just over one million employees, followed by Veneto and Tuscany. In 2023, however, Southern Italy recorded the highest annual relative increase in the number of enterprises (+3.06%), suggesting a possible gradual rebalancing of the geographical distribution of industrial activities. The average enterprise size (Table 3), measured as the ratio of employees to local units, continued to increase, reaching 9.7 employees per local unit in 2023. This confirms the ongoing processes of business consolidation and integration, which have also been supported by investments under the National Recovery and Resilience Plan (NRRP).