Martina Bussettini, Barbara Lastoria
The indicator provides information on the flood hazard conditions for the entire national territory, updated to 2020. Areas with high hydraulic hazard, prone to flooding with a return period between 20 and 50 years, account for 5.4% of the national territory (16,224 km²). Areas with medium hydraulic hazard, prone to flooding with a return period between 100 and 200 years, represent 10% (30,196 km²). Areas with low hydraulic hazard, prone to flooding during rare or extreme events, make up 14% of the national territory (42,376 km²).
The indicator provides information on flood hazard conditions for the entire national territory, evaluated based on the ISPRA 2020 mosaic of flood-prone areas for different probability scenarios. ISPRA created this mosaic in 2021 based on hydraulic hazard areas delineated by the Basin Authorities and updated to 2020. The mosaic was prepared for the three hazard scenarios identified by Legislative Decree 49/2010 (which transposes the Flood Directive 2007/60/EC):
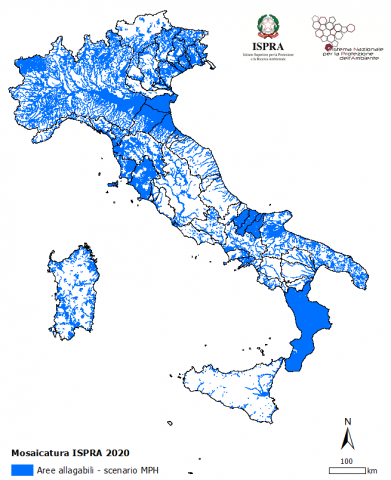
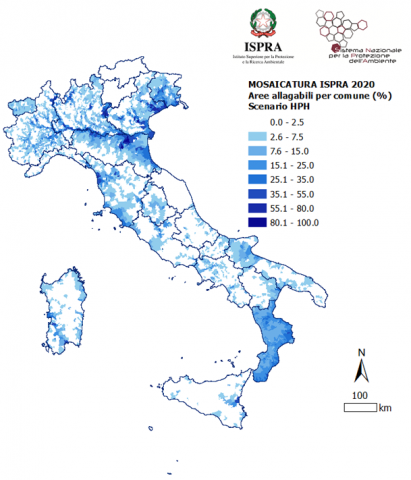
High Probability Hazard (HPH) with a return period between 20 and 50 years (frequent floods),
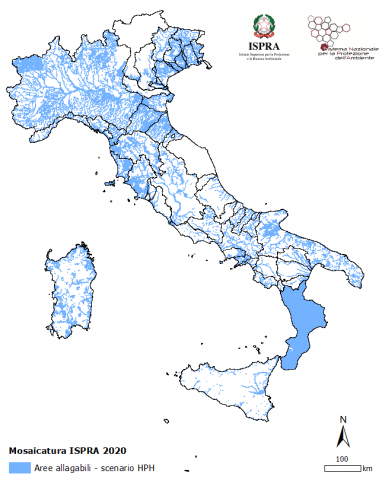
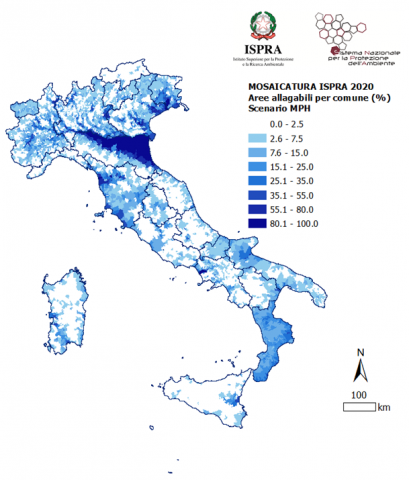
Medium Probability Hazard (MPH) with a return period between 100 and 200 years (infrequent floods),
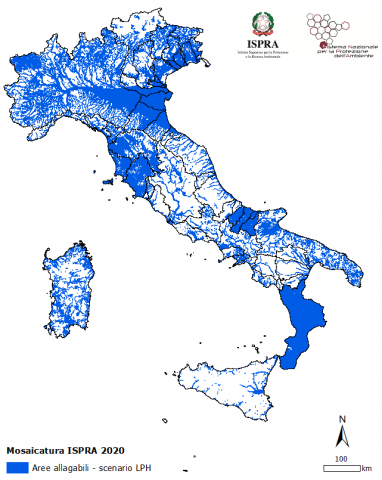
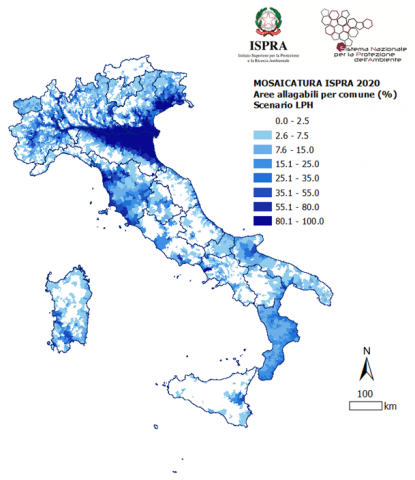
Low Probability Hazard (LPH) (low probability of floods, scenarios involving rare or extreme events).
To provide an updated and unified picture of the flood hazard conditions across Italy at different territorial scales: national, regional, provincial, and municipal.
Flood Directive 2007/60/EC
Legislative Decree 49/2010
The objective set by the legislation is to provide an updated overview of flood hazard conditions across the entire national territory.
Lastoria B., Bussettini M., Mariani S., Piva F., Braca G., 2021: Rapporto sulle condizioni di pericolosità da alluvione in Italia e indicatori di rischio associati. Istituto Superiore per la Protezione e la Ricerca Ambientale, Rapporti 353/21, Roma
The indicator provides a national-level overview of flood hazard, detailed down to the municipal scale, based on data updated to 2020. It should be noted that these data undergo continuous updates over time by the Basin Authorities. Therefore, for purposes other than those intended by the indicator, it is advisable to refer to the most recent publications from the relevant competent authorities.
There is a need to improve the level of spatial coverage of hazard areas especially for high probability scenarios and make better use of information from post-event analyses as part of the Preliminary Risk Assessment.
Basin Authority
MiTE (Ministry of Ecological Transition)
Cartography published on the sites of the District Basin Authorities;
National Geoportal of the Ministry of Ecological Transition: http://www.pcn.minambiente.it/mattm/
National, Regional, Provincial, Municipalities
2020
The information layers produced by the Basin Authorities in the context of updating the maps for flood hazard and flood risk, in compliance with Article 6 of the European Directive 2007/60/EC, were used to obtain a unified national overview of flood-prone areas for various probability scenarios. The surface areas of high hydraulic hazard (HPH), medium hydraulic hazard (MPH), and low hydraulic hazard (LPH) were then calculated at different territorial scales: national, regional, provincial, and municipal.
The increase in flood-prone areas is due to new studies, modeling, the use of data from past flood events, and future scenarios that consider the effects of climate change.
The analysis based on data produced by the District Basin Authorities in the context of updating the flood hazard and risk maps for the second management cycle of the European Directive 2007/60/EC revealed that:
- 5.4% of the national territory (16,224 km²) is at high hazard/probability (HPH).
- 10% of the national territory (30,196 km²) is at medium hazard/probability (MPH).
- 14% of the national territory (42,376 km²) is at low hazard/probability (LPH).
Compared to the ISPRA 2017 mapping, there has been an increase in areas with high hazard/probability (HPH) by 1.3 percentage points, medium hazard/probability (MPH) by 1.6 percentage points, and low hazard/probability (LPH) by 3.1 percentage points. This increase in surface areas is mainly attributed to the acquisition of more detailed information on previously mapped areas or areas not included in earlier surveys.
| Data |
|---|
Thumbnail
Headline
Figure 1: Floodable areas by High Probability Hazard (HPH) scenario Data source
ISPRA processing of data from District Basin Authority |
Thumbnail
Headline
Figure 2: Floodable areas by Medium Probability Hazard (MPH) scenario Data source
ISPRA processing of data from District Basin Authority |
Thumbnail
Headline
Figure 3: Floodable areas by Low Probability Hazard (LPH) scenario Data source
ISPRA processing of data from District Basin Authority |
Thumbnail
Headline
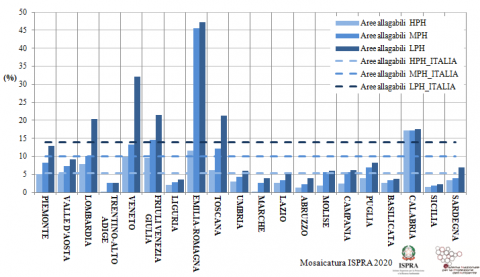
Figure 4: Percentage of regional territory affected by floodable areas for the three flood probability scenarios and values calculated at the national scale Data source
ISPRA processing of data from District Basin Authority |
Thumbnail
Headline
Figure 6: Percentages of floodable municipal area by High Probability Hazard (HPH) scenario Data source
ISPRA processing of data from District Basin Authority |
Thumbnail
Headline
Figure 7: Percentages of floodable municipal area by Medium Probability Hazard (MPH) flood hazard scenario Data source
ISPRA processing of data from District Basin Authority |
Thumbnail
Headline
Figure 8: Percentages of floodable municipal area by Low Probability Hazard (LPH) scenario Data source
ISPRA processing of data from District Basin Authority |
Headline
Table 1: Values of floodable area in Italian provinces for different flood probability scenarios expressed in absolute terms (km2) and percentage (%) of the total area of each province (Area Prov.) Data source
ISPRA processing of data from District Basin Authority Data legend
ID = Istat code of the province |
The ISPRA 2020 mosaic, produced in 2021 with updated data from 2020, provides a map of areas potentially subject to flooding for the various flood probability scenarios defined by Legislative Decree 49/2010, which transposes the Floods Directive 2007/60/EC.
The Italian regions that show higher percentages of flood-prone territory compared to the national average for all three hazard/probability scenarios include Lombardy, Veneto, Friuli-Venezia Giulia, Emilia-Romagna, Tuscany, and Calabria. The highest percentages of potentially flood-prone territory are recorded as follows:
In Lombardy, the province with the largest flood-prone area is Mantua. In Veneto, the provinces of Venice, Padua, and Rovigo (with almost 100% of the area prone to flooding in the rare hazard scenario) have the largest areas at risk. In Friuli-Venezia Giulia, it is Gorizia, while in Emilia-Romagna, Ravenna and Ferrara stand out, with percentages reaching 80% and almost 100% for flood scenarios with medium and low probabilities, respectively. In Tuscany, the provinces of Pisa and Livorno are particularly vulnerable, while in Calabria, the province of Crotone is among the most exposed.
Throughout Italy, the number of municipalities with at least 20% of their municipal area in flood-prone areas is:
7.4% of municipalities (587 out of 7,904) in the case of a high probability scenario (HPH).
12.8% of municipalities (1,014 out of 7,904) in the case of a medium probability scenario (MPH).
20.0% of municipalities (1,577 out of 7,904) in the case of a low probability scenario (LPH).
These data highlight an increasing exposure to flood risk, with a significant number of municipalities and regional areas vulnerable, particularly in those already identified as high-risk areas.