Panel 1
Valeria Donadelli, Stefania Chiesa
The indicator estimates the size of national aquaculture in terms of the number of active facilities and production volumes, as well as production trends in relation to the objectives set in the Strategic Aquaculture Plan 2014-2020 and the Operational Program of the European Maritime and Fisheries Fund (EMFF OP) 2014-2020.
In 2020, Veneto remained the leading region in Italy in terms of the number of facilities (26%), while Emilia-Romagna was the largest producer by volume (26%). Five regions (Veneto, Emilia-Romagna, Friuli-Venezia Giulia, Puglia, and Sardinia) host 71% of Italy’s aquaculture facilities. Emilia-Romagna, Veneto, and Friuli are confirmed the main producers, and together with Marche and Tuscany, they account for 69% of national production.
Most coastal regions, depend on marine aquaculture, with facilities located in transitional, coastal, and marine environments.
The year 2020 was negatively impacted by the Covid-19 pandemic: the Italian aquaculture production was 122,760 tons, of which 61% were bivalve shellfish and 39% were fish. Crustacean farming remains a minor sector, with a production of only 0.5 tons. Alien species account for 49% of national production. Due to the production decline recorded in 2020, overall aquaculture production between 2013 and 2020 decreased by 13%, failing to meet the growth projections set by the Ministry of Agricultural, Food and Forestry Policies (MiPAAF).
The indicator estimates the size of national aquaculture, considering the number of active facilities and the production volume of fish and shellfish. Production data are analyzed by main commercial species and alien species as well as by the type of water resource used for farming (freshwater or salt/brackish water).
The indicator is developed based on data collected by the Ministry of Agricultural, Food, and Forestry Policies (MiPAAF) under Regulation (EC) No. 762/2008, which mandates annual collection and transmission of statistical data on aquaculture (EUROSTAT) by EU Member States.
FTo provide useful insights into the size and status of Italian aquaculture, in order to assess the achievement of growth and sustainable development goals set in the Strategic Aquaculture Plan 2014-2020 (PSA, MiPAAF 2015) and the Operational Program (OP) of the European Maritime and Fisheries Fund (EMFF 2014-2020), in accordance with European Commission Decision C(2015) 8452. The indicator also aims to estimate the potential environmental impacts of aquaculture activities.
The Common Fisheries Policy (CFP) (Regulation 1380/2013/EU) sets the objectives for the sustainable development of aquaculture activities, aiming to promote growth, increase aquaculture production in Member States, reduce Europe’s dependence on fish product imports (-70%), and foster aquaculture development in coastal and rural areas.
At the national level, the objectives for the sustainable development of aquaculture activities are established by the Strategic Aquaculture Plan 2014-2020 (PSA), drafted under Article 34 of the CFP, and by the Operational Program for the European Maritime and Fisheries Fund (EMFF, Regulation 508/2014/EU), approved by the European Commission in November 2015 (Decision C(2015)8452).
The Ministry of Agricultural, Food and Forestry Policies (MiPAAF), Directorate General for Fisheries and Aquaculture, has projected a 38% increase in production by 2025 compared to 2013 (PSA 2014-2020), reaching a total volume of over 190,000 tons of farmed fishery products (EMFF OP Priority 2, Objective 4, Indicator 2.1). Additionally, a 44% increase in corresponding value is expected, exceeding 560 million euros (Indicator 2.1).
Growth is expected through:
- Diversification of production processes and products
- Modernization and expansion of existing facilities
- Development of new production sites
- Improved use of marine and coastal space
- Identification of new Allocated Zones for Aquaculture (AZA)
The indicator is increasingly relevant in relation to new blue growth strategies (COM (2012) 494 final), energy transition and sustainable development policies promoted by the European Commission (Green Deal, 2019; Farm to Fork Strategy, 2020).
The use of alien species (non-native, non-indigenous, exotic) in aquaculture is an important means of diversifying production, regulated at the European level by:
- Reg. (EC) No. 708/2007
- Reg. (EC) No. 535/2008
- Reg. (EC) No. 506/2008
- Reg. (EU) No. 304/2011
- Reg. (EU) No. 1143/2014
Under these regulations, the Italian Competent Authority (MiPAAF) has established the National Register of Alien Species in Aquaculture (http://www.registro-asa.it/it), managed by ISPRA within the SINANet cloud. This platform allows operators to apply for the introduction of alien species for aquaculture purposes.
European regulations also govern the translocation of locally absent species, although a tracking system for these movements is still lacking at both national and European levels.
Non - indigenous species are also addressed under Descriptor 2 of the Marine Strategy Framework Directive (Directive 2008/56/EC). The new criteria and methodological standards related to Good Environmental Status (GES) and Environmental Targets emphasize introduction pathways rather than impacts (Decision 2017/848/EU; Italian Ministerial Decree (DM MATTM) of February 15, 2019).
Panel 2
COM (2020) 381 final – A “Farm to Fork” Strategy for a fair, healthy, and environmentally-friendly food system.
FAO (2020) – The State of World Fisheries and Aquaculture 2020: Sustainability in Action. Rome.
FAO (2022) – The State of World Fisheries and Aquaculture 2022: Towards Blue Transformation. Rome.
ISPRA (Various Years) – Environmental Data Yearbook
Marino G., Petochi T., Cardia F. (2020) – Assignment of Marine Zones for Aquaculture (AZA). Technical Guide, 214 p., ISPRA Technical Documents 2020. https://www.isprambiente.gov.it/it/pubblicazioni/documenti-tecnici/assegnazione-di-zone-marine-perlacquacoltura-aza-guida-tecnica
MiPAAF (2014) – Strategic Plan for Aquaculture in Italy (2014-2020), 282 p. https://pofeamp.politicheagricole.it/documents/17/2_Programma_operativo_Feamp.pdf.
-
Implement digital and innovative systems for the transmission of production data from farms to relevant administrations, saving resources and improving the reliability of data obtained for the census on aquaculture technical-productive data. Implement monitoring activities related to aquaculture introductions, the second largest introduction vector in Europe and the world, including the Marine Strategy Monitoring Program, and develop a traceability system for bivalve shellfish movements.
Data quality assessment
EUROSTAT (Statistical Office of the European Communities)
MiPAAF (Ministry of Agricultural, Food and Forestry Policies)
The indicator uses MiPAAF data surveyed under Regulation (EC) No. 762/2008, and data published by the Statistical Office of the European Union (EUROSTAT) https://ec.europa.eu/eurostat/data/database.
National, Regional (20/20)
1994-2020
Indicator assessment
The data collection for the 2019-2020 period (Reg. (EC) No. 762/2008) used aquaculture companies as the reference unit (legal entities officially registered with the Chamber of Commerce, Industry, Handicraft, and Agriculture) —and aquaculture facilities as the unit of analysis, representing the production units associated with a company. Each aquaculture company may consist of one or more facilities.
The 1994-2020 production trend was developed using data collected for MiPAAF by:
- ICRAM (1994-2002)
- Idroconsult (2002-2006)
- UNIMAR (2007-2014)
- GRAIA (2015-2016)
- CREA (2017-2020)
For the 2015-2018 period, ISPRA revised the data collected by GRAIA and CREA, integrating additional data provided by national producer associations API and AMA.
The data reports on:
- Production volumes (t) by sector (fish farming, shellfish farming, and crustacean farming) and by region
- Production volumes (t) of the main farmed species
- Production volumes (t) of farmed alien species
- Number of active facilities by aquatic environment (freshwater or brackish/marine) and by region
Total aquaculture production in 2020 was 122,760 tons, including:
74,990 tons of shellfish (61%)
47,770 tons of fish (39%)
0.5 tons of crustaceans
Total economic value: €392 million (Table 1)
Compared to 2018, production decreased by 30,000 tons
Sector-Specific Observations (2013-2020)
Overall aquaculture production declined by 13%
The decline affected all three production sectors
The decline was attributed to the global COVID-19 pandemic, in addition to pre-existing sectoral challenges
Shellfish Farming
Remains the main productive segment of Italian aquaculture (74,990 tons, valued at €187 million)
Production declined by 16% between 2013 and 2020, contradicting expected growth trend.
After a production drop in 2018, further declines were recorded in 2019 (-20,222 tons) and 2020 (-9,553 tons)
Factors affecting shellfish farming decline:
Climate change (e.g., rising sea temperatures, extreme marine weather events)
Environmental degradation in farming areas due to anthropogenic impacts (e.g., microbial contamination) and climate events (e.g., algal blooms)
Administrative and bureaucratic challenges in obtaining or renewing maritime concessions
Freshwater and Marine Fish Farming:
Freshwater aquaculture ranked second in production in 2020 (36,483 tons, 30% of total production)
Marine fish farming produced 11,287 tons, with 97% consisting of seabass and gilthead seabream
Production declined by 4,000 tons since 2013 and by: 12,200 tons (2018); 5,903 tons (2019)
Challenges facing fish farming:
Marine aquaculture faces obstacles in obtaining new maritime concessions
Freshwater aquaculture is impacted by:
Water scarcity due to climate change
New Water Protection Plans affecting water resource management
Crustacean Farming
Remains a minor sector with only 0.5 tons produced in 2020
Declined compared to 2019 (-4.6 tons) and 2018 (-13 tons)
Palaemon serratus (Mediterranean shrimp) is the only species farmed commercially.
Aquaculture Facilities in 2020
Total facilities: 618
43% for fish farming
57% for shellfish farming
Only 2 facilities in Italy farm crustaceans
Water resource usage in fish farming:
72% use freshwater
28% use marine or brackish water
Geographical Distribution of Production:
65% of national production is concentrated in Northern Italy, both in terms of facilities and production volume.
Alien Species in Aquaculture (2020):
Approximately 60,000 tons of alien species were produced (Table 2), accounting for 49% of the total national aquaculture production. Two species dominate:
Rainbow trout (Oncorhynchus mykiss) – 33,231 tons
Manila clam (Ruditapes philippinarum) – 24,337 tons
The "moderate" status considers:
- Environmental factors related to aquaculture (e.g., Nitrogen and Phosphorus Balance Indicator)
- Stagnation of the aquaculture sector in Italy and across Europe
- Failure to meet the PSA 2014-2020 growth targets for 2025 (+38% increase in production)
Due to the decline in production recorded in 2020, linked to the pandemic crisis, the trend of Italian aquaculture shows a negative performance compared to 2019 (-7%) and 2013 (-13%). However, this decline does not indicate a deterioration in environmental terms. Therefore, the trend has been assessed as stable.
All production sectors experienced a drop in production volume:
- Marine fish farming decreased by 8% compared to 2019 and 13% compared to 2013.
- Freshwater aquaculture showed a smaller decline (-1% compared to 2019 and -6% compared to 2013).
- Shellfish farming was the most affected sector, with a production decrease of 5% in 2020 compared to 2019 and 16% compared to 2013.
Regarding the economic value of aquaculture production, which exceeded €500 billion in 2018, the reduced production in 2020 led to a decline compared to 2019 (-12%) and 2018 (-23%), while remaining stable compared to 2013.
The number of aquaculture facilities declined from approximately 800 in 2014 to 618 in 2020, mainly due to the reorganization of companies and facility closures.
The historical production trend (Figure 5) highlights a decline in production capacity in the fish farming sector after 2001, mainly due to:
- A reduction in the number of facilities
- A decrease in intensive eel farming
- A significant reduction in traditional extensive lagoon farming of seabass, gilthead seabream, eel, and mullet, which has not been compensated by other innovative systems and productions
The production of alien species continues to show a positive growth trend, with a 13% increase in 2019 and a 3.1% increase in 2020 compared to 2013 (see 2015 Annual Database).
While freshwater fish farming remains relatively stable, significant fluctuations are observed in shellfish production, largely due to variations in the production volumes of the Manila clam (R. philippinarum) over the years.
Data
Table 1: Italian aquaculture in figures: number of farms, production and main species farmed (2019 and 2020)
Elaboration by ISPRA on the basis of data from MiPAAF-CREA, EUROSTAT
In the sectoral breakdown, establishments producing both shellfish and fish were counted twice.
Table 2: Productions of non-native species
Ispra processing of MiPAAF-CREA data, EUROSTAT
“*” symbol for non-exempt species
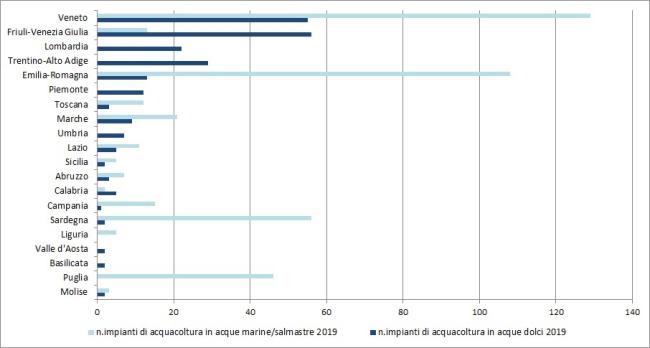
Figure 1: Number of freshwater, brackish/marine aquaculture facilities (2019)
ISPRA processing of MiPAAF-CREA data
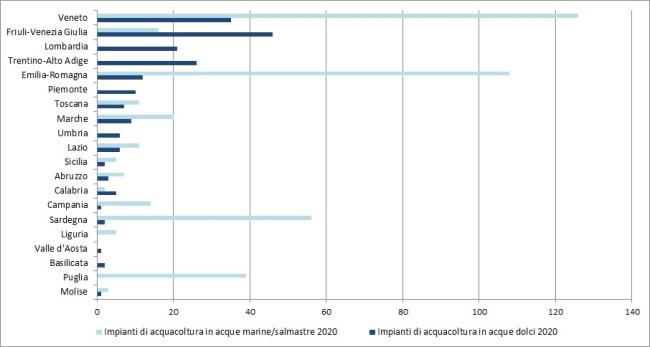
Figure 2: Number of freshwater, brackish/marine aquaculture facilities (2020)
ISPRA processing of MiPAAF-CREA data
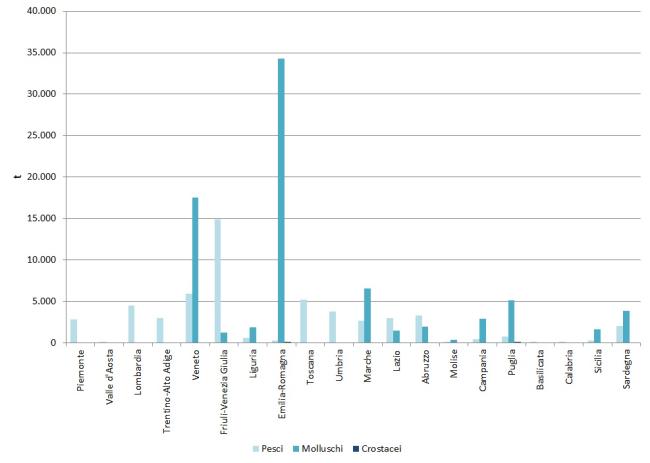
Figure 3: Aquaculture productions by region (2019)
ISPRA elaboration on MiPAAF-CREA data, EUROSTAT
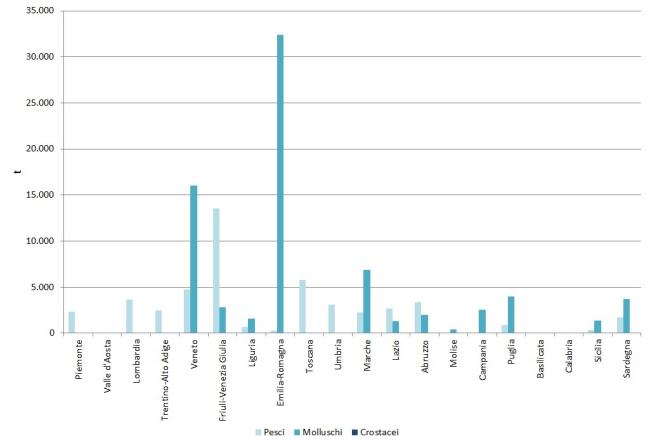
Figure 4: Aquaculture productions by region (2020)
ISPRA elaboration on data from MIPAAF-CREA, EUROSTAT
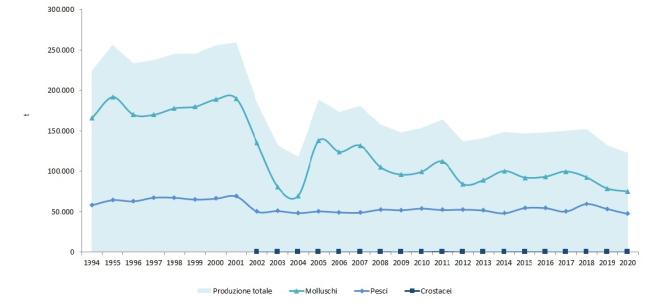
Figure 5: Time series of national aquaculture production of fish, mollusks and crustaceans
ISPRA processing on data: MiPAAF-ICRAM (1994-2001), IDROCONSULT (2002-2006), UNIMAR (2007-2014), MIPAAF-GRAIA-API-AMA (2015-2016), MIPAAF-API-AMA (2017-2018), MIPAAF-CREA (2019-2020)
In 2020, Veneto remained the leading region in Italy in terms of the number of aquaculture facilities (26%) (Figure 2), while Emilia-Romagna was the largest producer by volume (26% of the total) (Figure 4), with no significant changes compared to 2019.
Five regions (Veneto, Emilia-Romagna, Friuli-Venezia Giulia, Sardinia, and Apulia) account for 71% of aquaculture facilities. Emilia-Romagna, Veneto, and Friuli are confirmed the main producers, and together with Marche and Tuscany, they account for 69% of national production.
Compared to 2019, Tuscany has surpassed Apulia in terms of production volume.
The ratio of production volume to the number of facilities varies by region, mainly depending on the distribution of intensive, semi-intensive, and extensive fish farming systems.
In most coastal regions, brackish/marine water resources are predominantly used, with facilities located in transitional, coastal, and marine environments (Figures 1 and 2).
All coastal regions produce both fish and shellfish, except for Tuscany (Figures 3 and 4). Basilicata’s aquaculture production is exclusively freshwater fish farming.
National Aquaculture Production (2019 vs. 2020):
Key Aquaculture Systems (2020):
The most important farming systems are mussel farming (mitilicoltura) and trout farming (troticoltura) (Table 1), accounting for:
As far as shellfish farming is concerned, Emilia-Romagna and Veneto are the top producers, contributing 65% of national shellfish production in 2020 (Figure 4). Other significant production areas include Apulia, Marche, Sardinia, Campania, and Friuli-Venezia Giulia (Figures 3 and 4).
Fish Farming Production (2020):
Nearly 60% of national fish production is concentrated in four regions:
Marine fish farming is mainly based on two species:
Total marine fish production:
These two species represented:
Tuscany is the leading region in marine fish farming, followed by Lazio, Sardinia, Sicily, and Apulia.
With regard to fish farming, alien species (Table 2) are farmed exclusively in freshwater systems, accounting for 75% of the total fish production. In the case of shellfish farming, alien species (R. philippinarum) contribute 33% to the total volume of the sector (Table 1).
In 2020, no alien crustacean species were officially reported as being farmed (Eurostat data). However, some reports at the FAO level highlighted unauthorized farming of Cherax sp. in Sicily and Paeneus vannamei in Apulia, both of which are not permitted under Regulation (EC) No. 708/2007.
ISPRA is actively engaged in studies aimed at:
Challenges in Shellfish Farming
The shellfish farming sector is the most affected by fluctuations in production volumes and requires specific support measures to:
Production data from 1994 to 2001 included not only farmed shellfish but also bivalve shellfish harvested from natural banks, with an estimated annual production between 25,000 and 30,000 tons during this period. However, even when excluding natural bank harvesting, farmed shellfish production volumes have shown continuous fluctuations over the past 20 years, primarily due to non-optimal water quality in farming areas, which directly impacts production levels.
Shellfish Farming as a Sustainable Food Source
Given the importance of shellfish farming as:
It is essential to find solutions to sectoral challenges (e.g., lack of farming sites, environmental quality) and to support the growth of shellfish farming as planned in the PSA (Strategic Aquaculture Plan), the PO FEAMP 2014-2020, and the new FEAMPA 2021-2027 under Regulation (EU) No. 2021/1139.
Aquaculture Growth and Challenges
During the EU programming period (2014-2020), national aquaculture grew by 8.3% between 2013 and 2018, with an annual growth rate of 1.7%. However, 2020 recorded a decline in production, strongly impacted by the Covid-19 pandemic.
The growth estimates reported in PSA Italy are close to being achieved in terms of production value, mainly due to an increase in the euro value of farmed products. However, production volumes have experienced decline.
Among the various causes of this lack of growth, the following factors should be considered:
Insufficient financial allocations for the development of the sector at both national and European levels (Marino et al., 2020).