SPECIFIC CO₂ EMISSIONS
Data aggiornamento scheda: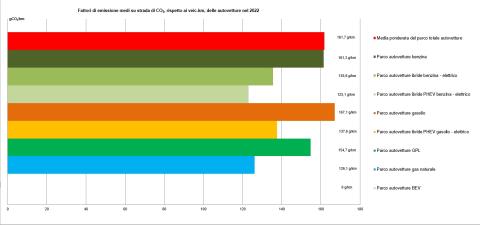
The indicator allows the evaluation of the trend of specific carbon dioxide emissions of the circulating car fleet through the comparison between the values resulting from type-approval procedures and the values deriving from the actual use of vehicles on the road. It is also useful for the monitoring of carbon dioxide emissions of the circulating car fleet in relation to compliance with the voluntary agreements between the European Commission and the automotive industry. Since 2001, the year in which the Civil Motorization began to monitor the specific emissions of the newly registered fleet, these emissions have been decreasing and are in any case significantly lower than the estimates of real on-road emissions, showing a gap between type-approval data and real-world data.
SPECIFIC EMISSIONS OF NMVOC, NOX AND PM
Data aggiornamento scheda: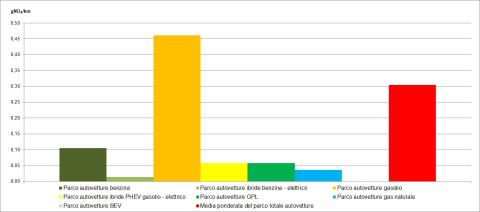
Stricter emission standards, the introduction of new technologies into the market—such as the installation of catalytic converters in vehicles—and improvements in fuel quality have led to significant reductions in the specific emissions of various pollutants from passenger cars and trucks; however, these improvements have been partially offset by the increase in traffic.
TRANSPORT ACCIDENT RATES
Data aggiornamento scheda:The indicator determines mortality and severity rates associated with different transport modes, to inform policies for enhancing transport safety. In Italy during 2023, 166,525 road accidents involving personal injuries were recorded, resulting in 3,039 fatalities and 224,634 injuries. Compared to 2022, the number of road accidents increased by 0.4%, while fatalities and injuries showed a decrease of -3.8% and an increase of 0.5%, respectively.