Silvia Ermili, Irma Lupica, Francesca Minniti
The indicator measures the quantity of waste sent to mechanical/mechanical-biological treatment, which in 2024 amounted to a total of 9 million tonnes. Compared with 2023, an increase of more than 91 thousand tonnes (+1%) was observed in the quantities treated in the plants under consideration, attributable exclusively to an increase in the quantities of waste falling under Chapter 19 of the European Waste List and generated from the treatment of municipal waste.
Conversely, a 4.4% reduction, corresponding to approximately 308 thousand tonnes, was recorded in the quantity of mixed waste, together with a 3.4% decrease in special waste, corresponding to approximately 10 thousand tonnes.
Mechanical-biological treatment (MBT) represents an intermediate waste management operation for both mixed municipal waste and waste generated from its treatment; these facilities also treat limited quantities of special waste. MBT consists of two main stages: mechanical treatment, in which the waste is screened to separate the different material fractions, and biological treatment, aimed at achieving mineralisation of the more readily degradable organic components and hygienisation of the output through pasteurisation.
The indicator measures the quantity of waste sent to mechanical/mechanical-biological treatment.
To monitor the management routes of both mixed municipal waste and waste generated from its treatment, with the aim of supporting decision-making processes and environmental policies.
Directive 2008/98/EC and subsequent amendments.
Legislative Decree no. 152/2006 and subsequent amendments.
Directive 2018/850/EU
Directive 2018/851/EU
Rapporto Rifiuti Urbani - 2025 Edition
Single Environmental Declaration Form (MUD); questionnaires sent to ARPA/APPA and plant operators by ISPRA-Waste register database ( http://www. catasto-rifiuti. isprambiente. it ) ISPRA
National, Regional
2000-2024
Information on the treatment plant system, as well as on the type and quantities of municipal waste managed, is acquired through the MUD environmental declaration database and through questionnaires sent to both Regional and Provincial Environmental Protection Agencies and plant operators, in order to collect facility-specific information.
In addition to quantifying the waste generated by these plants, the subsequent waste treatment operations to which such waste is destined are also identified.
In 2024, the quantity of waste sent to mechanical/mechanical-biological treatment, equal to 9 million tonnes, increased compared with the previous year (+1%) (Table 1 and Figure 1). This increase is attributable exclusively to higher quantities of Chapter 19 waste of the European Waste List, deriving from the treatment of municipal waste. By contrast, the quantity of mixed waste decreased by 4.4%, corresponding to approximately 308 thousand tonnes, while special waste decreased by 3.4%, corresponding to approximately 10 thousand tonnes (Table 2).
Over the period 2000-2019, a substantial increase was observed in the quantities of waste treated in mechanical-biological treatment plants, which more than tripled compared with the beginning of the period considered. Starting from 2020, a reversal of this trend can be observed, with a progressive reduction in the quantities treated, amounting overall to 9.2% over the period 2020-2024 (Table 1).
| Allegati |
|---|
Titolo
Table 1: Waste input to mechanical-biological treatment plants Fonte
ISPRA |
Titolo
Table 2: Mechanical-biological treatment of municipal waste, by region Fonte
ISPRA |
Thumbnail
Titolo
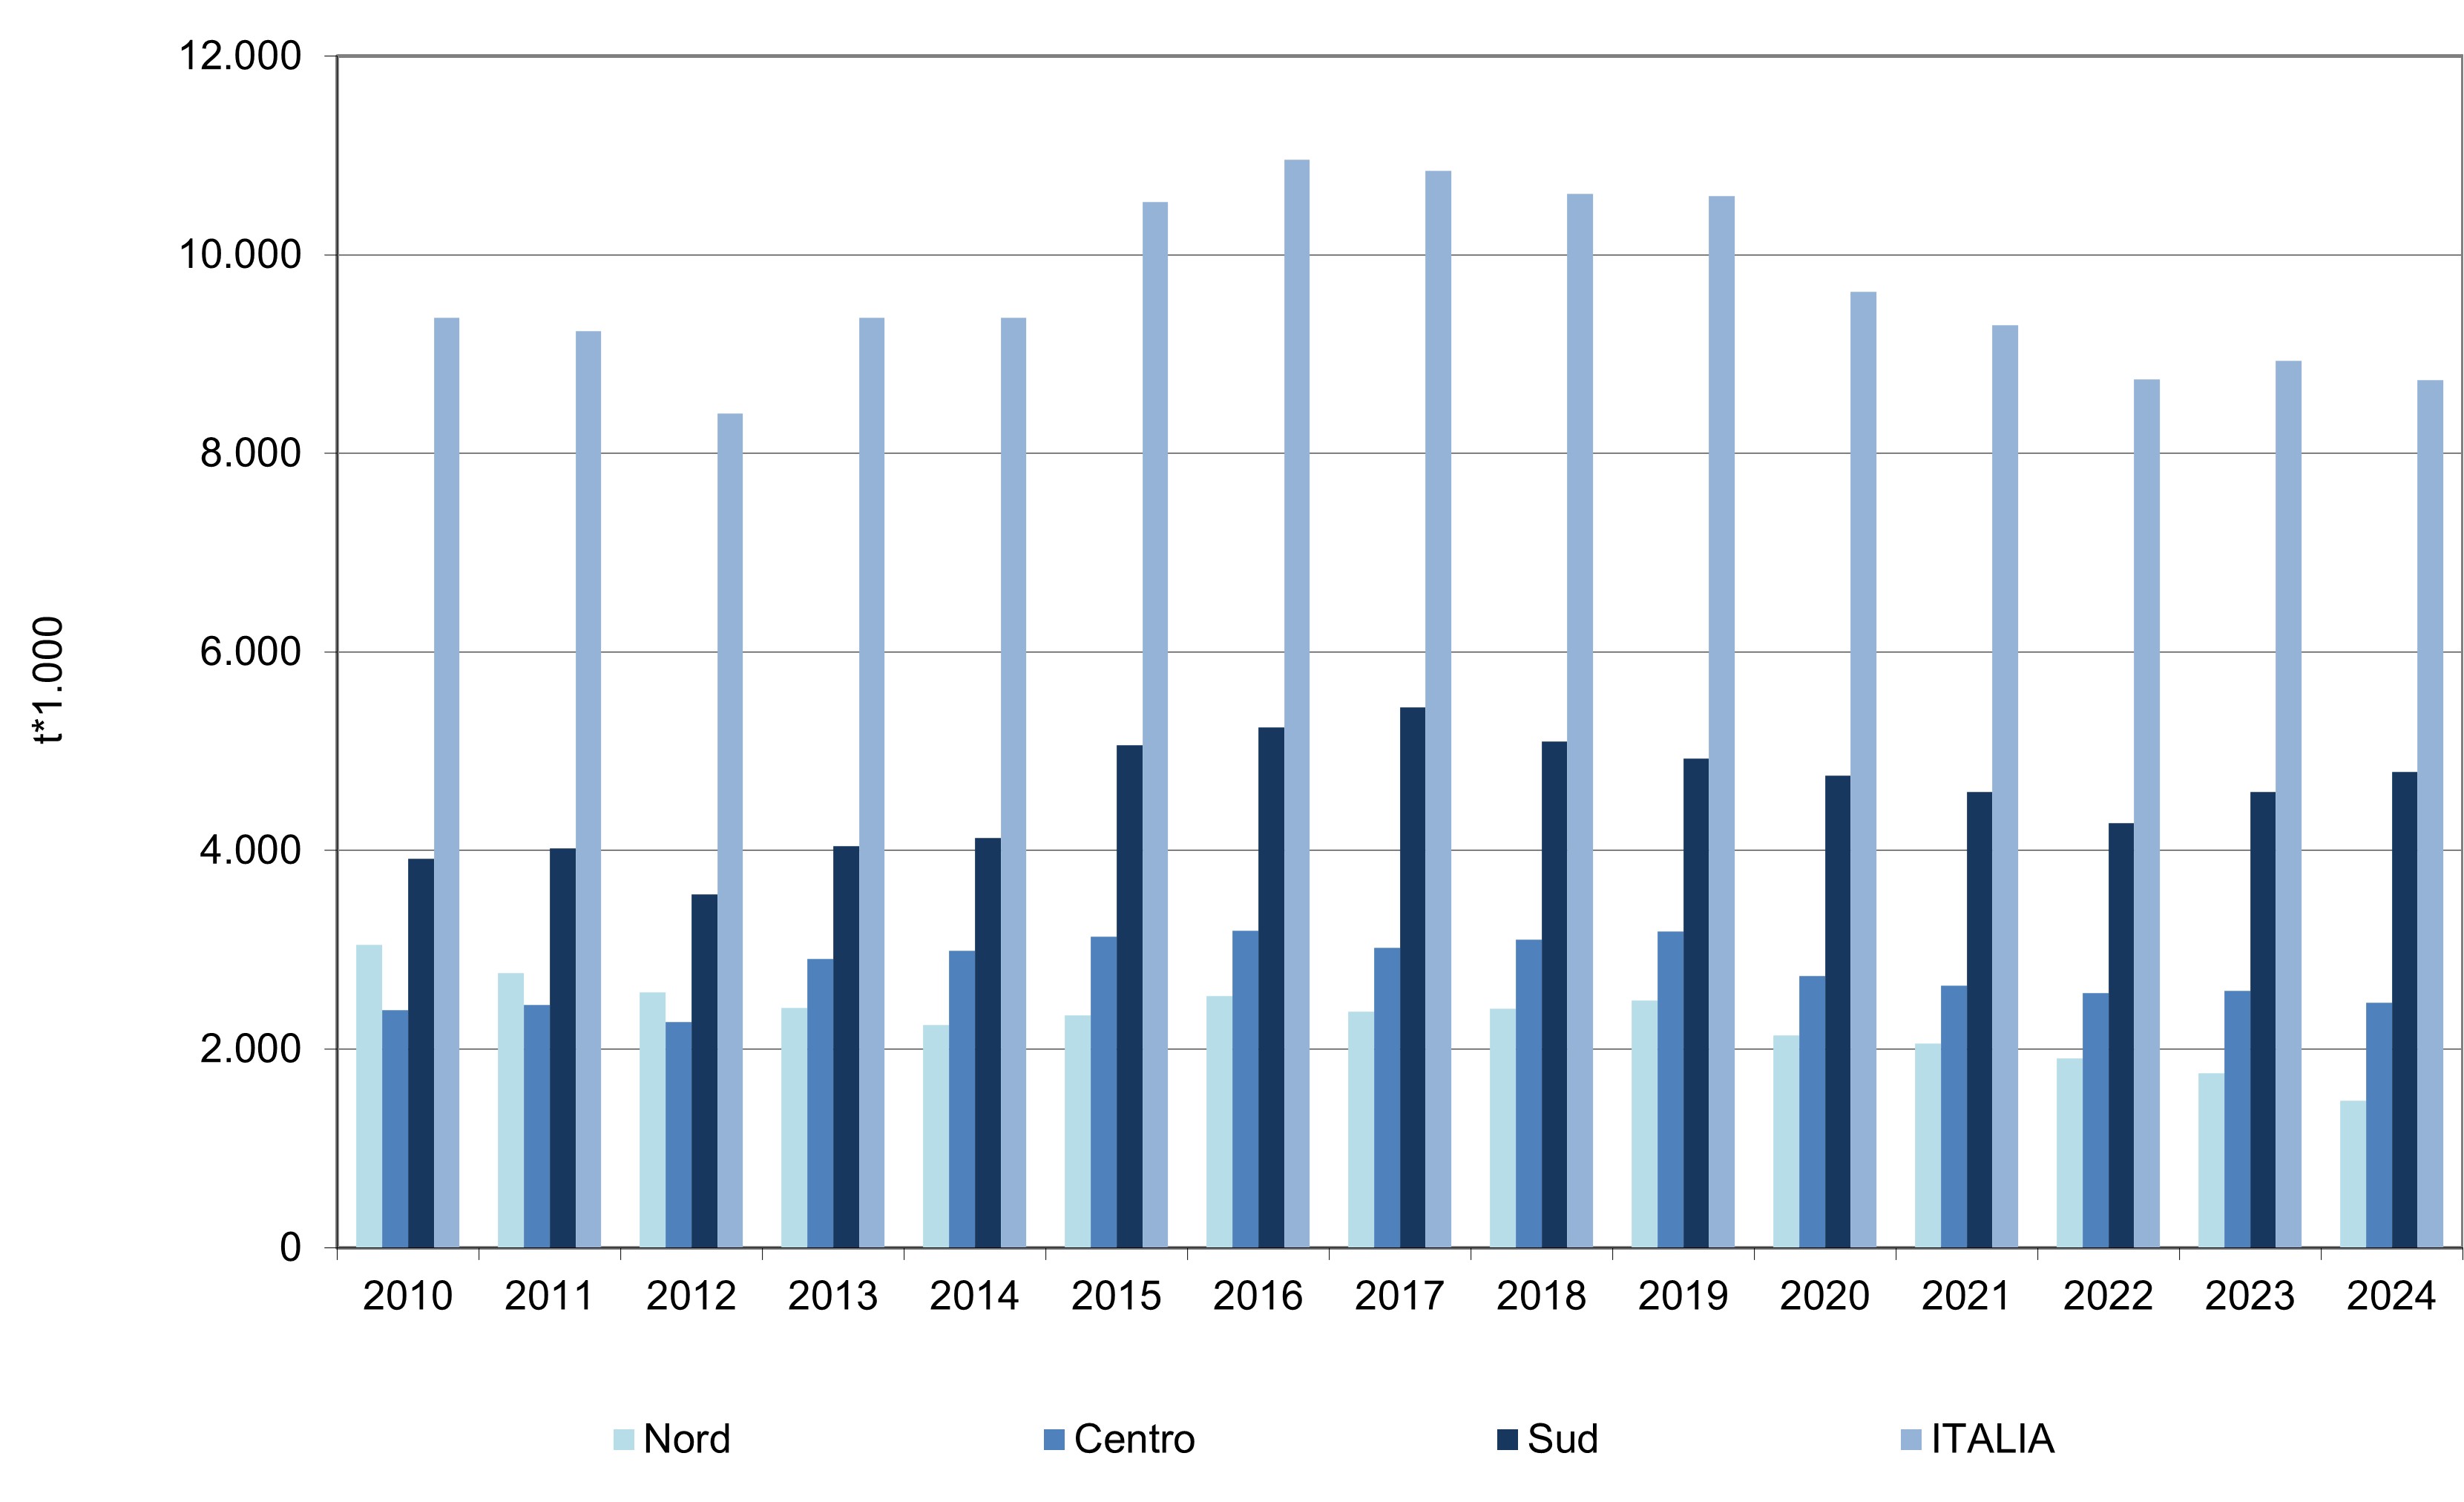
Figure 1: Waste treated by mechanical-biological treatment plants Fonte
ISPRA |
Thumbnail
Titolo
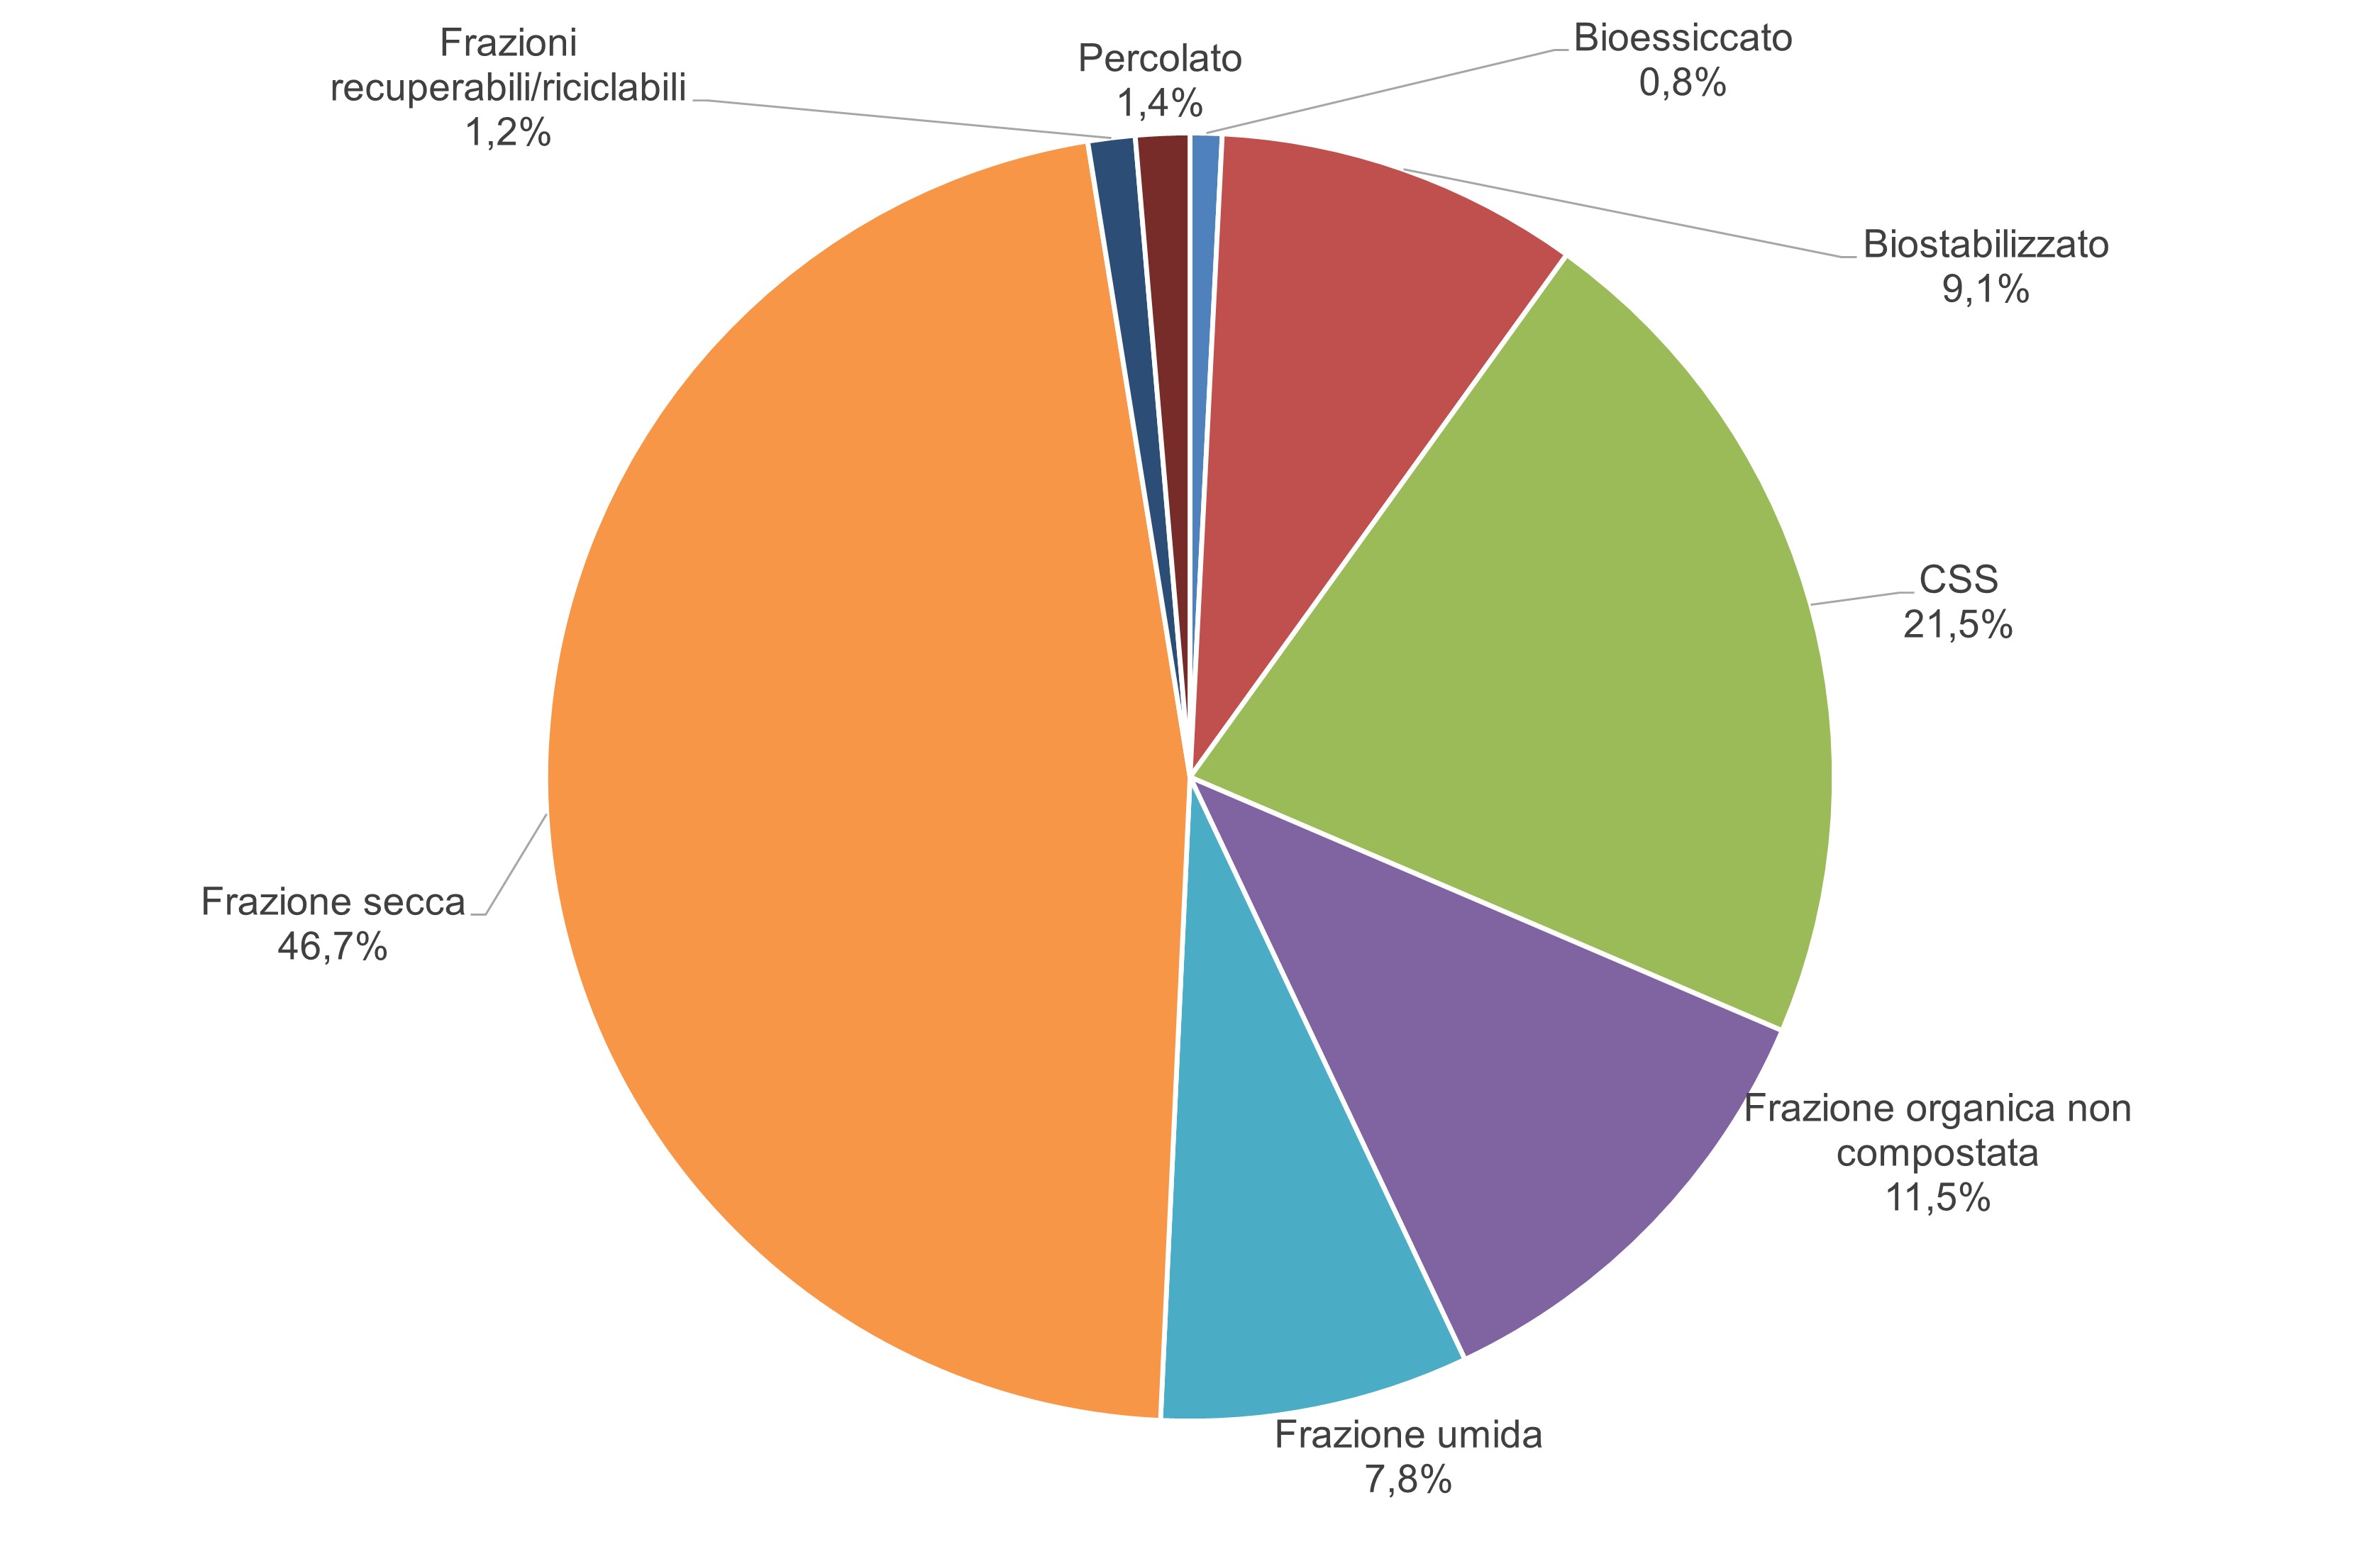
Figure 2: Waste/materials generated by mechanical-biological treatment plants (2024) Fonte
ISPRA |
In 2024, waste sent to aerobic mechanical-biological treatment consisted of 74.2% mixed municipal waste, approximately 6.7 million tonnes; 20.6% pre-treated municipal waste, classified under Chapter 19 codes of the European Waste List, over 1.8 million tonnes; 2.0%, almost 184 thousand tonnes, other municipal waste material fractions, including paper, plastics, metals, wood, glass and organic fractions from separate collection; and, finally, 3.1% special waste from industrial sectors, such as the agro-industrial sector and wood processing, amounting to 282 thousand tonnes (Table 2).
In Northern Italy, over 1.6 million tonnes were treated, showing a 7.3% decrease, equal to 128 thousand tonnes, compared with 2023. In Central Italy, where almost 2.6 million tonnes were treated, a slight decrease of 3 thousand tonnes (-0.1%) was observed. By contrast, Southern Italy, which treated 4.8 million tonnes, recorded an increase of 222 thousand tonnes (+4.8%) compared with the previous year (Table 1, Figure 1).
The quantities of waste/materials generated by mechanical-biological treatment plants amounted to just over 8 million tonnes. They consisted of dry fraction for 46.7%, over 3.7 million tonnes; Solid Recovered Fuel (SRF), 1.7 million tonnes, equal to 21.5% of the total; non-composted organic fraction, over 929 thousand tonnes, equal to 11.5% of the total; biostabilised waste, just over 736 thousand tonnes, equal to 9.1% of the total; wet fraction, almost 624 thousand tonnes, equal to 7.7% of the total; material fractions sent to recovery operations, including recycling, such as paper, plastics, metals, wood and glass, over 95 thousand tonnes, equal to 1.2% of the total; biodried waste, 64 thousand tonnes, equal to 0.8% of the total; and, finally, leachate, over 109 thousand tonnes, equal to 1.4% of the total (Figure 2).