Giovanni Finocchiaro, Silvia Iaccarino
In 2024, inbound tourist flows at national borders continued to grow, reaching 88.6 million foreign visitors, compared with 85.7 million in 2023, an increase of 3.4%.
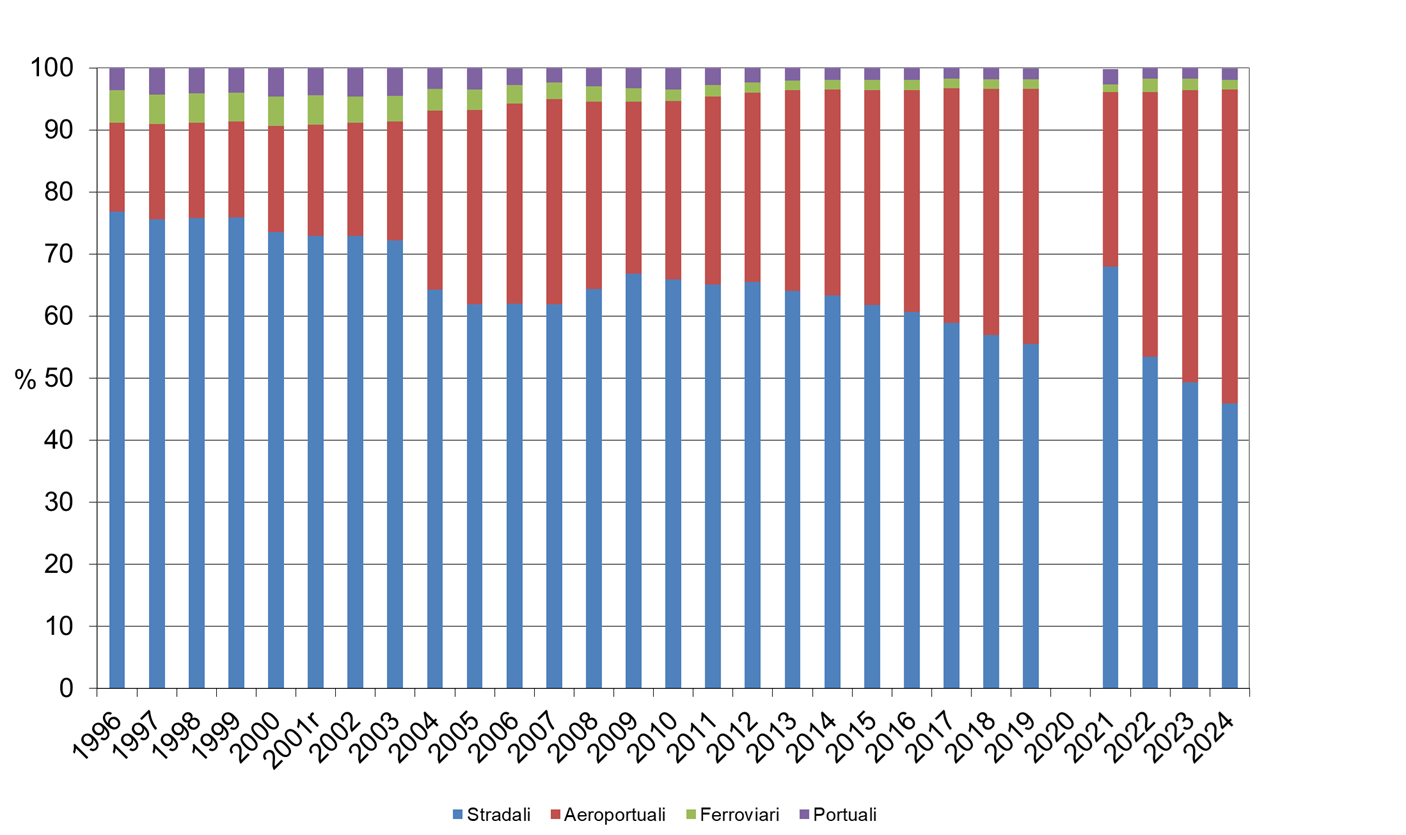
Air travel overtook road transport as the main mode of entry in 2024, accounting for 50.6% of inbound flows, while the share entering through road border crossings continued to decline, falling to 45.9%. Rail and sea arrivals remained marginal, accounting for 1.5% and 1.9%, respectively.
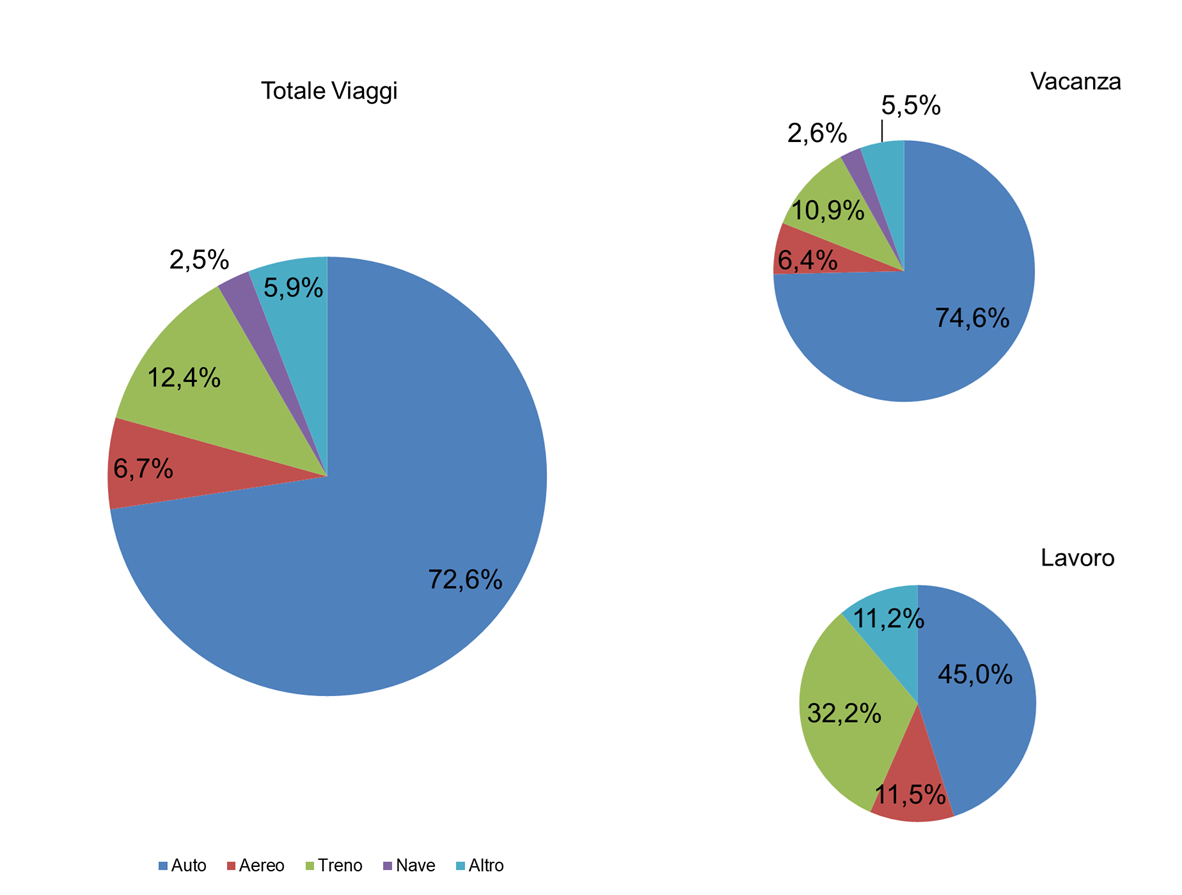
For trips made by residents in Italy within the country—the domestic component—passenger cars remained by far the dominant mode and increased their share further. In 2024, cars accounted for 72.6% of domestic trips, compared with 69.5% in 2023, while the share of rail travel declined to 12.4%, from 13.5% in 2023.
Overall, the modal structure confirms that the shift towards lower-impact modes of transport remains limited.
The indicator describes the distribution of tourist flows according to the mode of transport used to make a trip.
The indicator takes into account the number of foreign travellers crossing both geographical borders, such as road and rail border crossings, and “virtual” borders, such as international airports and seaports. It also considers the number of trips made by residents in Italy, classified by main mode of transport and type of trip.
The data available for analysing the different forms of transport used for tourism purposes are derived from surveys based on different methodologies. Data on foreign travellers are provided by the Bank of Italy, while data on trips made by residents in Italy are obtained from Istat’s Trips and Holidays survey.
The following definitions apply:
- Business trip: a stay involving at least one overnight stay outside the traveller’s usual environment, undertaken mainly for work-related purposes.
- Holiday trip, whether short or long: a stay of one or more consecutive nights outside the traveller’s usual environment, undertaken mainly for leisure, recreation or rest. In a broader sense, this category also includes trips made for other personal reasons, such as visiting relatives and/or friends, religious purposes or pilgrimages, health treatments or spa treatments.
To highlight the different modes of transport used for tourism purposes.
The indicator is not directly linked to any specific regulatory provisions.
Istat, various years, Travel in Italy and abroad
Bank of Italy, Survey on international tourism
https://www. bancaditalia. it/pubblicazioni/investigation-turismo-internazionale/index. html
The available data do not allow tourist flows generated by foreign visitors to be compared directly with those generated by residents in Italy, mainly because of the different data collection methodologies used.
Bank of Italy
Istat (National Institute of Statistics)
For Italian tourist flows, Istat data was used: http://dati. istat. it/
For foreign tourist flows at the borders, data from the Bank of Italy was used: https://www. bancaditalia. it/statistiche/tematiche/rapporti-estero/turismo-internazionale/distribuzione-microdati/tabelle-pivot/index. html
National
1996-2024
Percentage calculation and indexing.
The status is assessed as poor because of the continuing strong dependence on transport modes with high emission intensity.
In 2024, foreign visitors entered Italy mainly through airports, which accounted for 50.6% of arrivals, and road border crossings, which accounted for 45.9%. Rail accounted for only a marginal share of 1.5% (Table 1 and Figure 1).
Passenger cars were also the predominant mode for domestic trips made by residents in Italy, reaching a share of 72.6% in 2024, compared with 12.4% for rail travel (Table 2 and Figure 3).
This modal structure continues to represent a significant environmental concern, as it limits the reduction of climate-related and atmospheric pressures associated with tourism mobility.
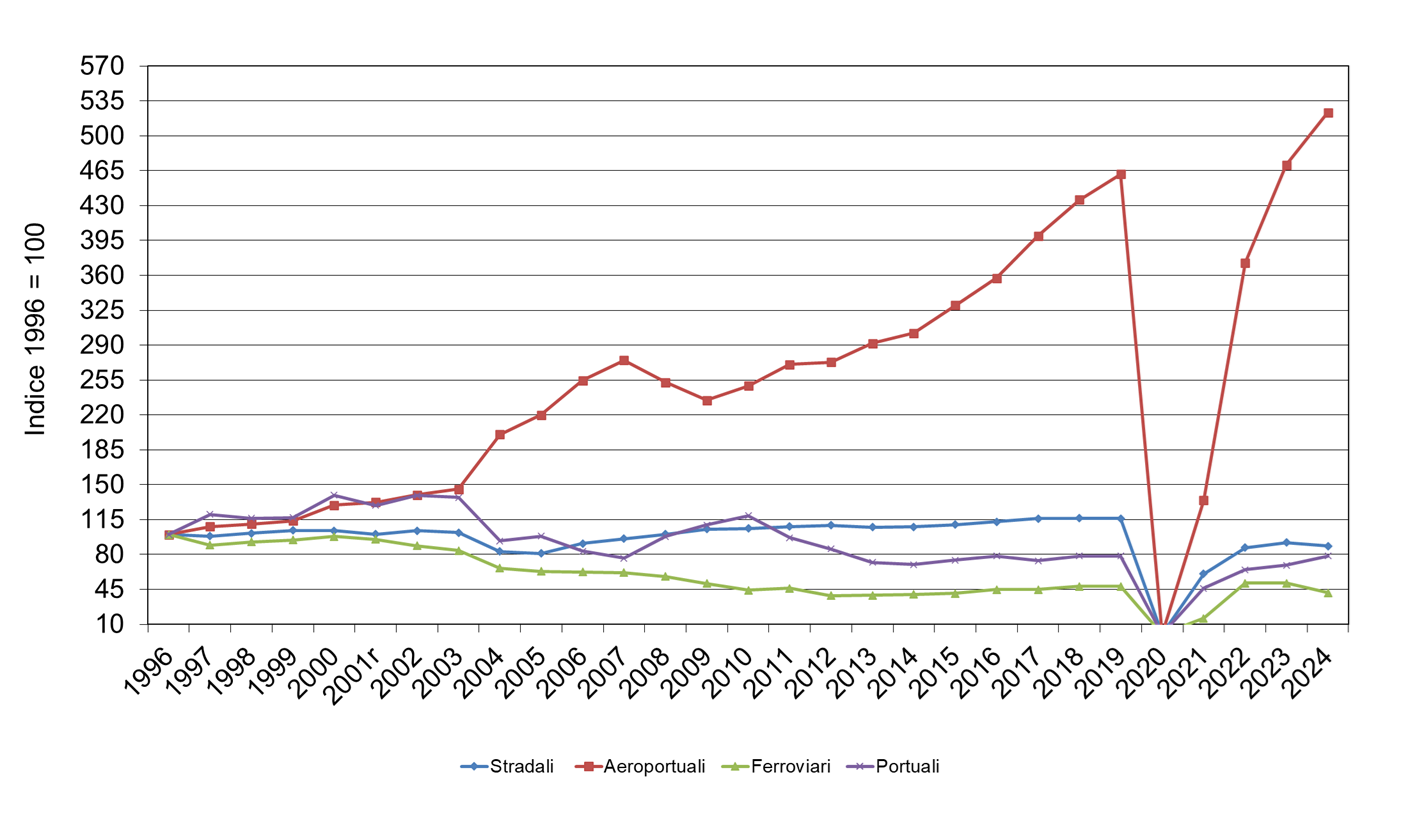
Over the period considered, foreign visitor flows at national borders followed a typical pre- and post-pandemic pattern. After reaching a peak of 96.2 million in 2019, flows fell sharply to 40.9 million in 2021 and then recovered rapidly to 74.7 million in 2022. Growth continued in 2023, when flows reached 85.7 million, and in 2024, when they increased to 88.6 million (Table 1, Figure 1 and Figure 2).
At the same time, the modal composition of inbound tourism changed. Road transport, which was the predominant mode in 2019 with a share of 55.5%, gradually declined, while the share of air travel increased. In 2024, air travel overtook road transport, accounting for 50.6% of inbound flows compared with 45.9% for road transport. Rail and sea transport accounted for only a small share throughout the entire time series (Table 1 and Figure 1).
For trips made by residents in Italy, dependence on passenger cars remained high, while the use of rail continued to be relatively limited (Table 2 and Figure 3).
Overall, the recovery in tourist flows was not accompanied by greater use of lower-impact modes of transport, confirming an unfavourable trajectory in terms of the sustainability of tourism mobility.
| Data |
|---|
Headline
Table 1: Foreign visitors entering Italy through border crossings Data source
ISPRA elaboration on data from the Bank of Italy Data legend
r The 2001 data relating to road and air border crossings have been revised following an improvement in the survey methodology |
Headline
Table 2: Trips by Italians broken down into overall and only in Italy, by main means of transport used and type of trip Data source
ISPRA elaboration on ISTAT data - Multipurpose survey "Travel and holidays" (until 2013) and ISTAT survey Travel and holiday managers (since 2014) Data legend
A car means: your own car, that of relatives or friends or rented; b Ship means: ship, boat, motorboat; c Other means: tourist or scheduled buses, campers, motorhomes, other means of transport not elsewhere specified including motorcycles, scooters, bicycles, etc.; d The estimate has a relative error between 25% and 30%; e The estimate has a relative error of more than 30%; .. The estimate does not reach half of the minimum order of magnitude allowed |
Thumbnail
Headline
Figure 1: Percentage distribution of foreign visitors entering Italy through border crossings Data source
ISPRA processing on Bank of Italy data Data legend
r The 2001 data on road and air border crossings have been revised following a refinement of the survey methodology |
Thumbnail
Headline
Figure 2: Change in the number of foreign visitors entering Italy through border crossings Data source
ISPRA processing on Bank of Italy data Data legend
r - The 2001 data on road and air border crossings have been revised following a refinement of the survey methodology |
Thumbnail
Headline
Figure 3: Percentage distribution of trips made only in Italy by residents, by main means of transport used and by type of trip(2024) Data source
ISPRA elaboration on ISTAT data - Multipurpose survey "Trips and holidays" |
The most recent data show that the recovery in tourist flows at national borders has been accompanied by a modal composition that remains strongly concentrated on road and air transport. Although these two modes have different implications for climate change and air quality, both generate significant environmental pressures (Table 1, Figure 1 and Figure 2).
The fact that air travel overtook road transport in 2024, accounting for 50.6% of inbound flows compared with 45.94% for road transport, should not automatically be interpreted as an environmental improvement. On the one hand, it may reduce some local pressures around road border crossings. On the other hand, it strengthens the role of the mode generally associated with higher emissions per passenger-kilometre over medium- and long-distance routes. It also increases demand for “last-mile” connections between airport hubs and inland destinations (Table 1 and Figure 1).
This issue is particularly critical for rural destinations, where the absence of structured alternatives often results in the final stage of the journey being made almost entirely by road.
For the domestic component, the high and increasing share of passenger cars in trips within Italy—72.6% in 2024—indicates that the modal shift towards lower-impact alternatives remains weak and has not yet become consolidated (Table 2 and Figure 3).
From an environmental perspective, this implies the persistence of pressures related to CO₂ emissions and atmospheric pollutants, including NOx and particulate matter, as well as congestion and local impacts on environmentally sensitive areas, particularly during peak tourism periods.
In rural areas and protected areas, even relatively low absolute traffic volumes may generate substantial effects because they are concentrated at a limited number of access points and on infrastructure with restricted capacity.
Looking ahead, the data indicate the need for policies that make lower-impact transport modes more competitive and accessible throughout the entire travel chain, by strengthening intermodality and collective transport services.
The lack of growth in the rail component, both for border crossings and domestic trips, indicates that, without more decisive measures, increasing tourist flows are likely to result in greater environmental pressures associated with tourism mobility (Table 1, Figure 1, Table 2 and Figure 3).