Giovanni Finocchiaro, Andrea Gagna, Mariangela Soraci
In 2021, each million euros of value added of the Italian paper industry (€9.27 billion, 2015 prices) generated approximately 540 t of CO₂, 3.65 kg of SOx, 0.476 t of NOx, 52 g of NMVOCs, and 0.051 t of PM10. Compared with 2020, only SOx intensity decreases (–66%), while CO₂ (+0.6%), NOx, NMVOCs and PM10 (all +5.3%) increase. In the long-term comparison (1990–2021), two opposite dynamics emerge: SOx –99% (strong push towards the use of natural gas in the sector) and NMVOCs –97% (discontinuation of some production processes characterised by this type of emission), versus CO₂ +49%, NOx +40% and PM10 +32%, which reflect the increase in the sector’s energy needs.
The indicator relates annual emissions of CO₂, SOx, NOx, NMVOCs and PM10 generated by the national paper sector to the sector’s value added, expressed in millions of euros, 2015 chained values (ISTAT source). The result, in tonnes of pollutant per million euros of value added (t/M€), provides an immediate indication of the sector’s emission intensity, i.e. the relationship between emissions and the economic value generated.
To monitor over time the paper industry’s ability to decouple economic growth from emission pressures, providing information useful for supply-chain environmental balances and for reporting required by “climate-air” legislation.
Regulation (EU) No 525/2013, which repeals Decision No 280/2004/EC, provides in Article 7(1)(f) that by 15 January each year (year X) Member States must report to the Commission information on carbon dioxide emission intensity indicators, as defined in Annex 3 of the same Regulation, for year X–2.
Commission Implementing Regulation (EU) No 749/2014 of 30 June 2014 concerns the structure, format, transmission procedures and review of information communicated by Member States under Regulation (EU) No 525/2013 of the European Parliament and of the Council.
Commission Decision No 2005/166/EC of 10 February 2005 establishes the requirement to monitor all anthropogenic greenhouse gas emissions, assess progress in meeting commitments under the United Nations Framework Convention on Climate Change and the Kyoto Protocol, and ensure timeliness, completeness, accuracy, consistency, comparability and transparency of reporting by the Community and its Member States. With regard to carbon dioxide emission intensity indicators, the Decision establishes that by 15 January 2005 and for each subsequent year, Member States shall transmit data and information relating to priority, additional priority and additional indicators (indicators provided for in Article 3(1)(j) of Decision No 280/2004/EC).
ISPRA Report 411/2025 – Italian Greenhouse Gas Inventory 1990-2023. National Inventory Document 2025
ISPRA Report 410/2025 – Italian Emission Inventory 1990-2023. Information Inventory Report 2025
Assocarta
ISPRA
ISTAT
The emission series used for the indicator come from the National Air Emission Inventory managed by ISPRA and can be freely downloaded from emissioni.sina.isprambiente.it.
The economic denominator comes from ISTAT National Accounts: the table “Value added at basic prices – sector Manufacture of paper and paper products and Printing and reproduction of recorded media – 2015 chained prices” is available as open data on the I.Stat data warehouse and exportable in CSV/SDMX formats.
National
1990 - 2021
Each year, ISPRA estimates national emissions of CO₂, SOx, NOx, NMVOCs and PM10 for the paper sector according to international guidelines (IPCC for greenhouse gases and EMEP/EEA for other air pollutants), while ISTAT updates the sector’s value added at chained prices. Emission intensity for each pollutant is obtained by dividing tonnes emitted by millions of euros of value added; to follow changes over time, the series is indexed to 1990 = 100.
2021 marks a slight worsening in the sector’s emission profile: CO₂ intensity rises to about 540 t/M€, exceeding the 2020 value by half a percentage point, and NOx, NMVOCs and PM10 also show small increases (just over 5%). The only favourable change concerns sulphur oxides, whose intensity drops sharply to 3.6 kg/M€, almost two thirds lower than the previous year. Overall, the status remains medium-critical: very good for SOx and NMVOCs, adequate for PM10 and NOx, but still weak for CO₂ (Table 1).
In the long term the indicator shows strong decoupling for “classic” pollutants: SOx intensities are reduced almost to zero and NMVOC intensities fall to about 3% of their initial 1990 level. By contrast, substances linked to energy consumption worsen: CO₂ intensity is now about one and a half times that of 1990, indicating that the growing demand for heat and electricity in the papermaking process has outweighed improvements achieved in plants. A similar, though less marked, pattern is observed for NOx (+40%) and PM10 (+32%). In summary, the trend is positive for conventional air pollutants (SOx, NMVOCs), but unfavourable for combustion-related pollutants, especially CO₂ (Table 1).
| Allegati |
|---|
Titolo
Table 1: Intensity of atmospheric emissions in the chemical industry in Italy, compared to added value Fonte
ISPRA processing on ISPRA data (data on emissions of CO2, NOx, SOx, NMVOC and PM10) and Istat (data on Added Value) |
Titolo
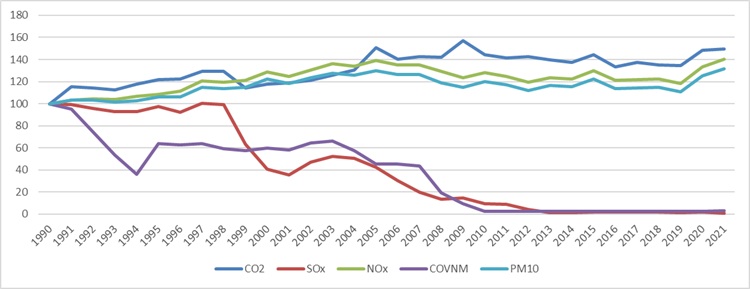
Figura 1: Intensità emissiva, indice 1990 = 100 per CO₂, SOx, NOx, COVNM, CO nell'industria cartaria Fonte
Elaborazione ISPRA su dati ISPRA e Istat |
Thumbnail
Titolo
Figura 1: Intensità emissiva, indice 1990 = 100 per CO₂, SOx, NOx, COVNM, CO nell'industria cartaria Fonte
Elaborazione ISPRA su dati ISPRA e Istat |
The overall pattern highlights a sector in which traditional pollutants are now marginal, while atmospheric pressures remain concentrated on CO₂ and, to a lesser extent, on NOx and PM10. The emerging picture is not only one of reduction but of a reshaping of the emission mix, with an increasingly pronounced imbalance towards energy-related contaminants. This confirms that the most significant progress has already occurred in the components that were easier to abate, whereas current challenges concern structural processes and energy consumption in the paper sector (Table 1 and Figure 1).