Giovanni Finocchiaro, Andrea Gagna, Mariangela Soraci
In 2023, for every million euros of value added, the Italian non-metallic mineral products industry emitted 1,861.4 t of CO₂, 1.8 t of SOx, 2.6 t of NOx, 2.1 t of NMVOC, and 2.3 t of PM10. Compared with 1990, NOx emission intensity declined by 72%, while for the other pollutants—apart from a –63% reduction for SOx—the decrease was less pronounced: NMVOC –40%, CO₂ –42%, and PM10 –15%.
In the most recent year, the indicator improved for SOx (–2%), remained almost unchanged for NOx (+2%), and increased for the other pollutants: NMVOC +24%, PM10 +17%, and CO₂ +7%.
The indicator relates the total annual emissions of five major atmospheric pollutants produced by the non-metallic mineral products industry—CO₂ (from combustion), SOx (sulphur oxides), NOx (nitrogen oxides), NMVOC (non-methane volatile organic compounds), and PM10 (particulate matter)—to the sector’s value added (million euros at basic prices, chain-linked values 2020).
Given the chosen level of aggregation, the indicator provides information on the environmental performance of the sector as a whole, rather than of individual production processes. Since the economic denominator reflects the wealth actually generated by the sector, the indicator measures the amount of pollutant released per unit of economic value produced, offering a synthetic picture of the sector’s environmental efficiency over time, not of individual processes.
To continuously monitor the extent to which the non-metallic mineral products industry succeeds in decoupling economic growth from CO₂ emissions and other major atmospheric pollutants, providing a reliable reference for assessing the effectiveness of policies and best available techniques, and supporting national and European reporting for the sector.
Environmental emissions specific to the industrial sector are governed by Directive 2010/75/EU of 24 November 2010, transposed into Italian law by Legislative Decree No. 46 of 4 March 2014, amending Legislative Decree No. 152/06 and subsequent amendments. The directive defines, for each industrial sector, the obligations regarding pollution prevention and reduction, including the adoption of Best Available Techniques (BATs), and requires information exchange within the European Community, including emission data for installations subject to AIA.
Regulation (EU) No. 525/2013, repealing Decision No. 280/2004/EC, Article 7(1)(f), establishes that by 15 January of each year (year X), Member States must report to the Commission information on CO₂ emission intensity indicators, as defined in Annex 3 of the Regulation, referring to year X-2, including priority, additional priority, and supplementary indicators.
Commission Implementing Regulation (EU) No. 749/2014 of 30 June 2014 concerns the structure, format, transmission procedures, and review of information reported by Member States.
Commission Decision 2005/166/EC of 10 February 2005 lays down the arrangements for implementing Decision No. 280/2004/EC on the greenhouse gas monitoring mechanism and the implementation of the Kyoto Protocol, establishing requirements for timeliness, completeness, accuracy, consistency, comparability, and transparency of reporting.
- ISPRA
- ISTAT
ISPRA data on CO₂ emission intensity indicators, officially transmitted annually to the EU under the MMR (Monitoring Mechanism Regulation) for greenhouse gases, available at:
https://emissioni.sina.isprambiente.it/wp-content/uploads/2025/04/MMR2025_Art13_AnnexXI_Indicators_2025.xlsx
CO₂ emission data available at:
https://emissioni.sina.isprambiente.it/serie-storiche-emissioni/
Emission series are derived from the National Atmospheric Emission Inventory managed by ISPRA; datasets in NFR and SNAP formats are freely downloadable from emissioni.sina.isprambiente.it, together with the most recent detailed reports (Italian Emission Inventory 1990–2023, Informative Inventory Report 2025, Italian Greenhouse Gas Inventory 1990–2023, National Inventory Document 2025).
Economic data derive from ISTAT National Accounts: the table “Value added at basic prices – Non-metallic mineral activities sector – chain-linked prices 2020” is available as open data from the I.Stat data warehouse.
National
1990 - 2023
Each year since 1990, emissions of CO₂, SOx, NOx, NMVOC, and PM10 from the non-metallic mineral products sector are extracted from the national inventory managed by ISPRA, together with the corresponding value added (prices 2020) from ISTAT National Accounts. After harmonising classifications, each pollutant is divided by value added to obtain tonnes per million euros, and the series is normalised to 1990 = 100 to facilitate interpretation. At each revision of the emission inventory or economic accounts, the entire series is recalculated retroactively, in accordance with EMEP/EEA guidelines and EU and UNECE/CLRTAP quality control procedures.
In 2023, the Italian non-metallic mineral products industry emitted 19.9 Mt of CO₂, 19.7 kt of SOx, 28.2 kt of NOx, 22.5 kt of NMVOC, and 24.7 kt of PM10. When related to sectoral value added (10,714.9 million euros, prices 2020), the resulting intensities are 1,861 t CO₂/M€, 1.8 t SOx/M€, 2.6 t NOx/M€, 2.1 t NMVOC/M€, and 2.3 t PM10/M€. Compared with 2022, the indicator improves only for SOx (–2%), while it worsens for the other pollutants (NMVOC +24%, PM10 +17%, CO₂ +7%, NOx +2%). Overall, the 2023 status is assessed as “medium” (Table 1).
Since 1990, emission intensity has declined for all pollutants, but unevenly: –42% CO₂, –63% SOx, –72% NOx, –40% NMVOC, and only –15% PM10. The fastest reductions concern NOx, followed by SOx, CO₂, NMVOC, and finally PM10 (Table 1).
| Allegati |
|---|
Titolo
Table 1: Emission intensity, index 1990 = 100 for CO₂, SOx, NOx, NMVOC, PM10 in the non-metallic minerals industry Fonte
ISPRA processing on ISPRA and Istat data |
Thumbnail
Titolo
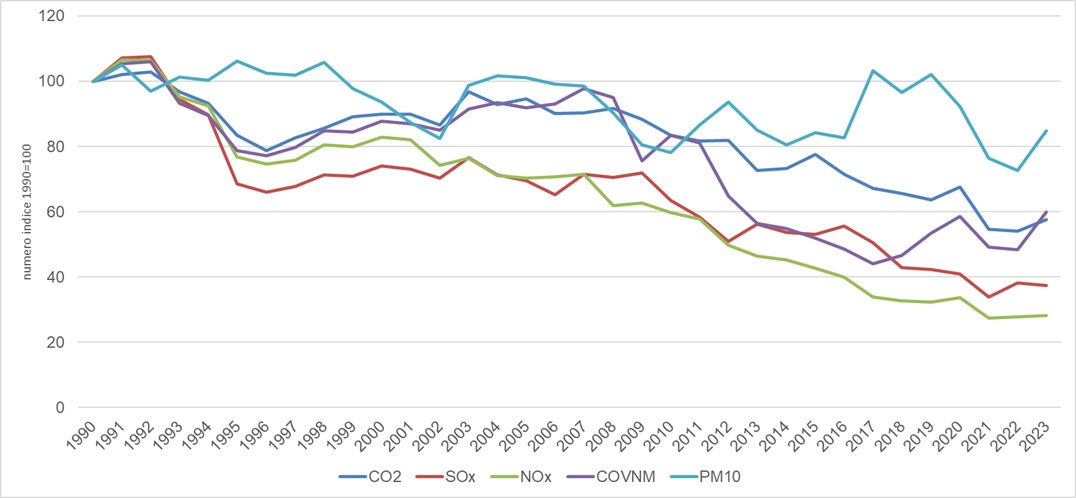
Figure 1: Emission intensity, index 1990 = 100 for CO₂, SOx, NOx, NMVOC, PM10 in the non-metallic minerals industry Fonte
ISPRA processing on ISPRA and Istat data |
Over the long term, a structural reduction in emission intensity emerges for all pollutants, with different magnitudes and timing. The sector therefore shows a clear process of relative decoupling between productive activity and emissions, particularly marked for traditional pollutants (SOx, NOx, NMVOC) and more limited for CO₂ and PM10. Historically regulated pollutants (SOx, NOx) show better results than CO₂ and PM10, confirming the effectiveness of targeted sectoral policies. Recent fluctuations suggest a combination of factors, including economic crises, the pandemic, production recovery, and energy shocks (Figure 1).