Antonio Caputo
The analysis of the contribution of different primary energy sources to gross domestic energy consumption shows that the dominant role of petroleum products is decreasing in favor of an increase in natural gas and renewable energy sources, which accounted for 35.4% and 20.5%, respectively, in 2023. Greater diversification and the increasing role of renewable sources have positive effects on Italy’s energy self-sufficiency, which remains among the lowest in industrialized countries.
The indicator measures energy production from each of the primary energy sources.
The purpose is to assess the contribution of different primary energy sources to energy production, with the aim of increasing the use of less polluting fuels.
With Decision No. 1386/2013/EU, the European Union established the 7th Environment Action Programme (EAP) running until 2020. On 14 October 2020, the European Commission presented a proposal for a decision establishing the 8th Environment Action Programme for the period 2021–2030. On 29 March 2022, the Council of the EU formally adopted the 8th Environment Action Programme (2021–2030). No specific targets apply to this indicator.
MASE. National Energy Balance (BEN), various years. Available at: https://sisen.mase.gov.it/dgsaie/
MASE
EUROSTAT
MASE. National Energy Balance (BEN), various years. Available at: https://sisen.mase.gov.it/dgsaie/
National
1990-2023
The data are collected by the Ministry of Environment and Energy Security and processed according to the Eurostat methodology.
In 2023, gross inland consumption amounted to 142.2 Mtoe, of which 50.3 Mtoe was natural gas, 52.2 Mtoe petroleum and petroleum products, and 29.2 Mtoe renewable energy. Smaller contributions came from solid fuels (4.8 Mtoe), non-renewable waste (1.2 Mtoe), and imported electricity (4.4 Mtoe) (Table 1). Gross inland consumption in 2023 showed a decrease compared to the previous year (-4%). Analyzing consumption by source, the variations compared to 2022 were as follows: solid fuels: -35%, petroleum products: +1.3%, natural gas: -10.3%, renewable sources: +3.7%, non-renewable waste: +1%, electricity: +19.2%.
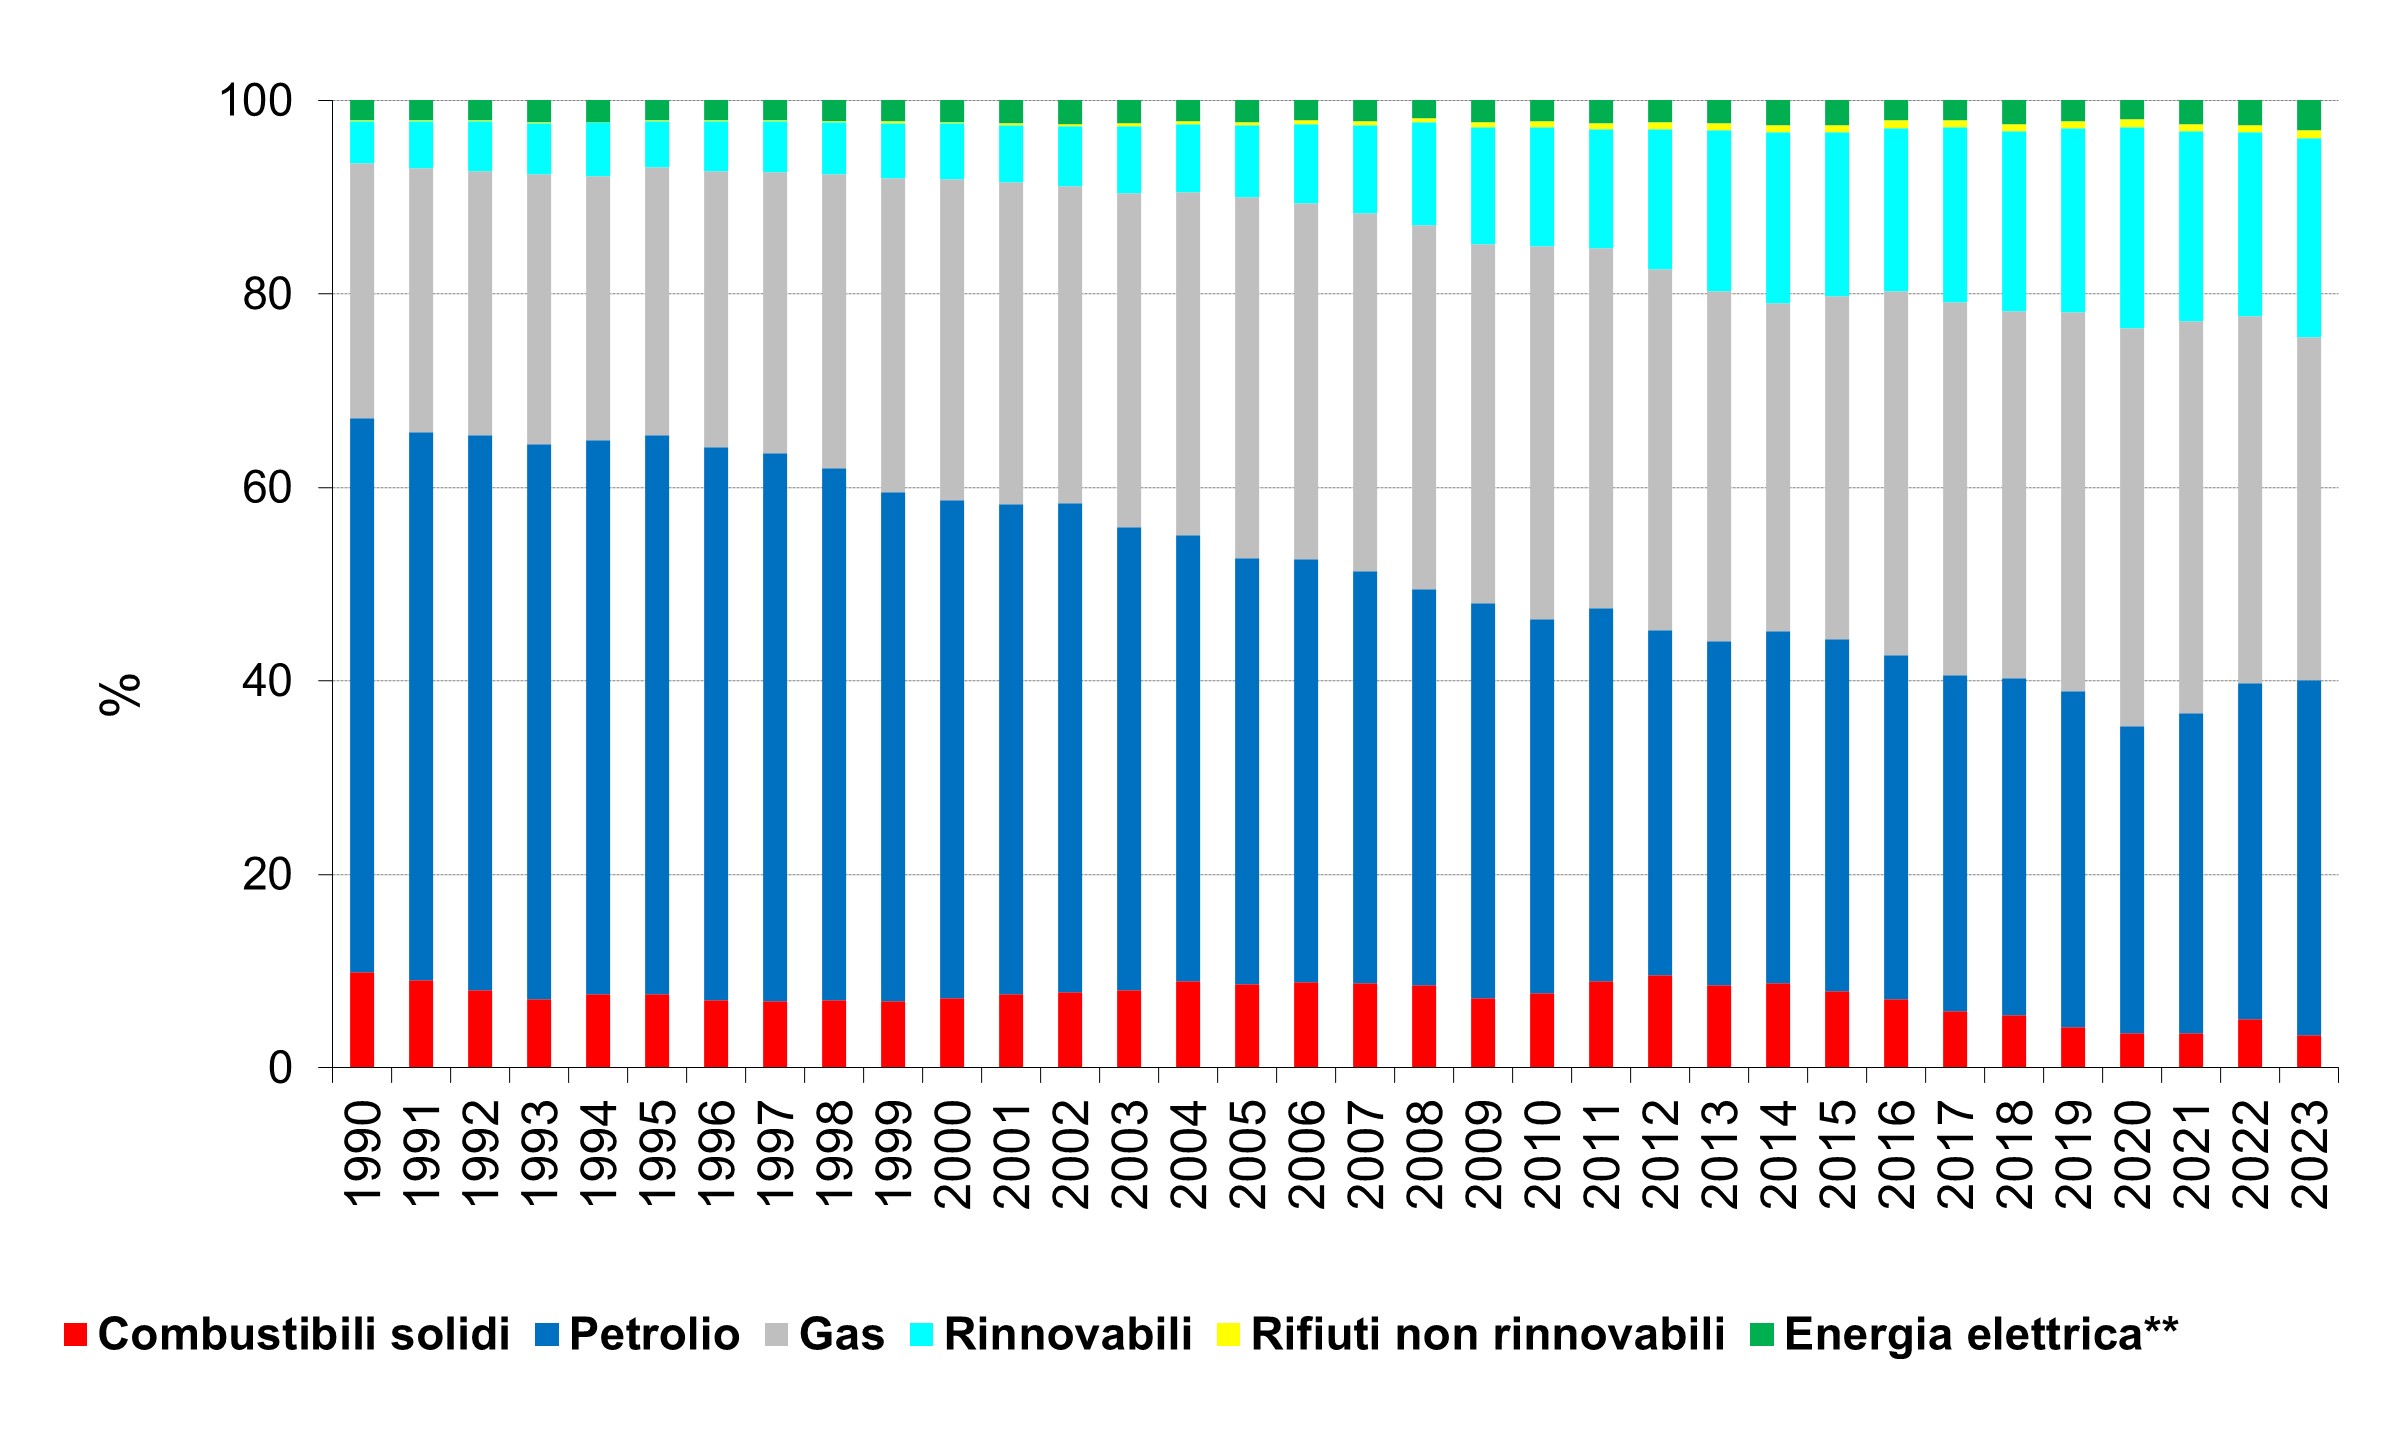
The share of natural gas in total energy consumption increased from 26.3% in 1990 to 41.2% in 2020, then declined to 35.4% in 2023. The share of petroleum products decreased from 57.3% in 1990 to 31.7% in 2020, with an increase in subsequent years (36.7% in 2023). A similar trend is observed for solid fuels, which steadily declined from 9.6% in 2012 to 3.6% in 2021, rebounded to 5% in 2022, and then dropped sharply to 3.4% in 2023. The share of renewable energy sources experienced rapid growth from 1990 to 2020, rising from 4.4% to 20.7%, followed by relatively stable values in recent years (20.5% in 2023). Non-renewable waste, although remaining a minor component among the country’s primary energy sources, increased from 0.1% in 1990 to 1% in 2023. The share of imported electricity fluctuated around an average of 3.6% (Table 1).
| Data |
|---|
Headline
Table 1: Gross Inland Energy Consumption by Primary Energy Sources* Data source
MASE/EUROSTAT Data legend
*Gross inland energy consumption is defined as primary production + recovered products + imports + stock changes − exports − international marine bunkers; ** Net electricity imports |
Headline
Figure1: Share of Gross Energy Consumption by Primary Sources Data source
ISPRA analyses based on MASE/Eurostat data Data legend
*Gross inland energy consumption is defined as primary production + recovered products + imports + stock changes − exports − international marine bunkers; ** Net electricity imports |
Thumbnail
Headline
Figure 1: Share of Gross Inland Energy Consumption by Primary Energy Sources* Data source
ISPRA analyses based on MASE/Eurostat data Data legend
*Gross inland energy consumption is defined as primary production + recovered products + imports + stock changes − exports − international marine bunkers; ** Net electricity imports |
The structure of Italy’s energy supply is shifting toward greater diversification of energy sources. The dominant role of petroleum products is decreasing in favor of an increase in natural gas and renewable energy sources (Figure 1). Greater diversification and the growing role of renewables have positive effects on Italy’s energy self-sufficiency, which remains among the lowest in industrialized countries.