Gabriele Bellabarba, Maria Logorelli
For each autonomous region/province, the indicator reports the absolute number, the normalized number (in terms of inhabitants and surface area) and the powers of the radio and television systems (RTV) and services for mobile comunication Base Transceiver Stations (BTS); the number of sites where the systems/services are installed is also specified. The number of sites and the number of RTV systems, in 2024, recorded slight variations compared to the previous year (+1.0% RTV sites, -0.7% RTV systems), going from 3,425 to 3,458 RTV sites and from 13,765 to 13,662 RTV systems. The overall RTV power presents a decrease (-7.8%), going from 7,035 kW to 6,483 kW.
With regards to Base Transceiver Stations for mobile telephony, in 2024 there was a slight increase in sites (from 25,142 to 26,108, +3.8%), in systems (from 40,757 to 42,673, +4.7%) and in services (from 158,627 to 184,284, +16.2%). The overall BTS power records a significant increase in 2024 (+28.8%), going from 22,217 kW to 28,616 kW.
For each autonomous region/province, the indicator reports the absolute number, the normalized number (in terms of inhabitants and surface area) and the powers of the radio and television systems (RTV) and services for comunication telephone base transceiver stations (BTS); the number of sites where the systems/services are installed is also specified. By RTV system we mean the element that can be associated with a specific transmission frequency; by BTS service we mean the type of transmission system implemented (GSM, UMTS 900, UMTS 1800 etc.); by site, the location or address where the system/service is installed.
Quantify the main sources of pressure on the territory due to radio frequency (RF) fields.
Framework law 36/2001 and related implementing decree Prime Ministerial Decree 8/07/2003 (RF) and subsequent amendments. Legislative Decree 259/2003 and subsequent amendments. Art. 4 of Framework Law 36/01 on protection from exposure to electric, magnetic and electromagnetic fields provides for the establishment of a national register of fixed and mobile sources of electric, magnetic and electromagnetic fields and of the territorial areas involved, and of regional registers created in coordination with the National Register. On 13 February 2014, the ministerial decree establishing the land registry in question was issued following a process of comparison between ISPRA and the ARPA/APPA, which began several years ago, in order to define and share the technical specifications for the creation of the land registry itself. The National Electromagnetic land registry works in coordination with the various regional electromagnetic land registries and the regional projects financed by MASE have been launched according to the provisions of DD n.72/2016 relating to the creation/management of the egional electromagnetic land registries. This will certainly lead to a strong positive impulse towards the implementation of the same and consequently of the National Electromagnetic land registry.
ISPRA, various years, Environmental data yearbook
ISPRA, Thematic reports
There are numerous critical issues that characterize the retrieval of information relating to the systems in question, the relative spatial and temporal coverage and the quality of the data, especially for radio and television systems which have mostly existed on the national territory for some time, having had an uncontrolled diffusion in the 70s and 80s, due to the lack of specific regulation at a national level. Other factors that fuel these critical issues include delays in the implementation of precise regulatory provisions for the provision of data by the managers of the plants in question, efficiency of data collection tools at local level, lack of human and financial resources dedicated to this data collection activity.
Synergistic actions by the subjects involved in trying to support the flow of information with suitable regulatory tools and with activities aimed at analyzing the critical issues mentioned above in order to shed light on the problems and propose solutions to give greater uniformity and completeness to the data at a national level.
Electromagnetic Fields Observatory
9/20
2008-2024
Ratio of the number of facilities/services to the regional surface area and to the number of resident inhabitants. Calculation of the density of sites and plants/services by calculating the ratio between the sum of the sites/(plants/services) and that of the territorial surfaces. Sum of total regional antenna connector powers.
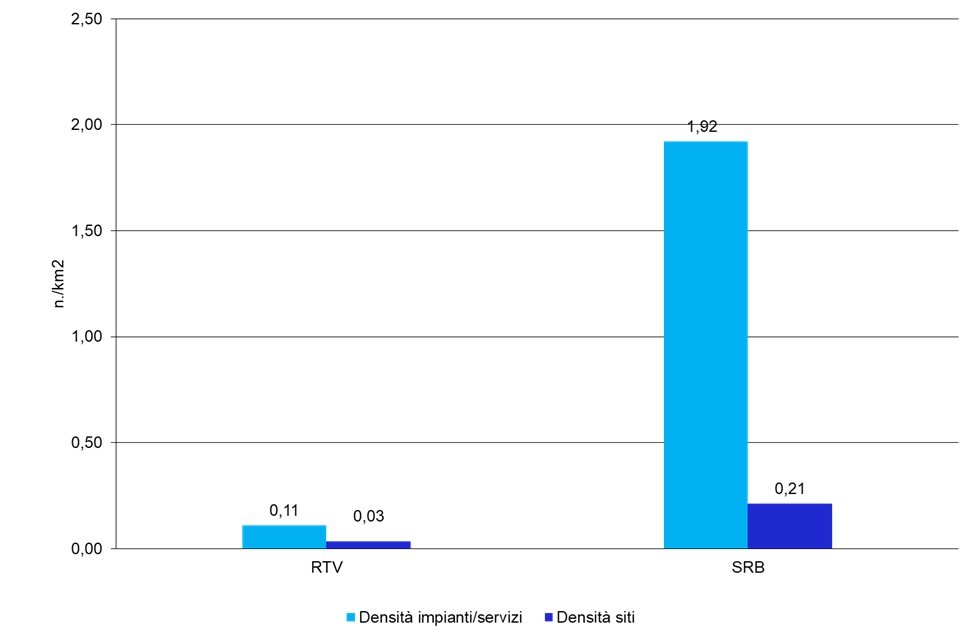
Considering the data provided by the ARPA/APPA representatives for 2024, it is noted that the Base Transceiver Stations (BTS) have a density of services, over the entire national surface, 17.6 times higher than the density of radio and television systems (RTV) (1.92 and 0.11 per km respectively 2); the density of BTS sites (0.21 sites per km 2) is 7 times higher than that of RTV sites (0.03 sites per km2) (Figure 1). The overall power of the BTS systems (43,076 kW) is significantly higher than that of the RTV systems (8,818 kW) (Figure 2). In the aforementioned calculations, the autonomous regions/provinces that provided the updated and complete data for 2024 for both types of sources (RTV and BTS) were considered: Piedmont, Valle d'Aosta, Lombardy, Trentino-Alto Adige, Veneto, Friuli-Venezia Giulia, Emilia-Romagna, Tuscany, Umbria, Campania and Sicily. It should be noted that the variations involving both RTV systems and BTSs are only partly attributable to real variations in the installations in the area. In fact, the regional representatives themselves, in some cases, point out that these are due to more accurate information through the use of new regional databases for the collection of information and the control and verification activities of the Managers themselves.
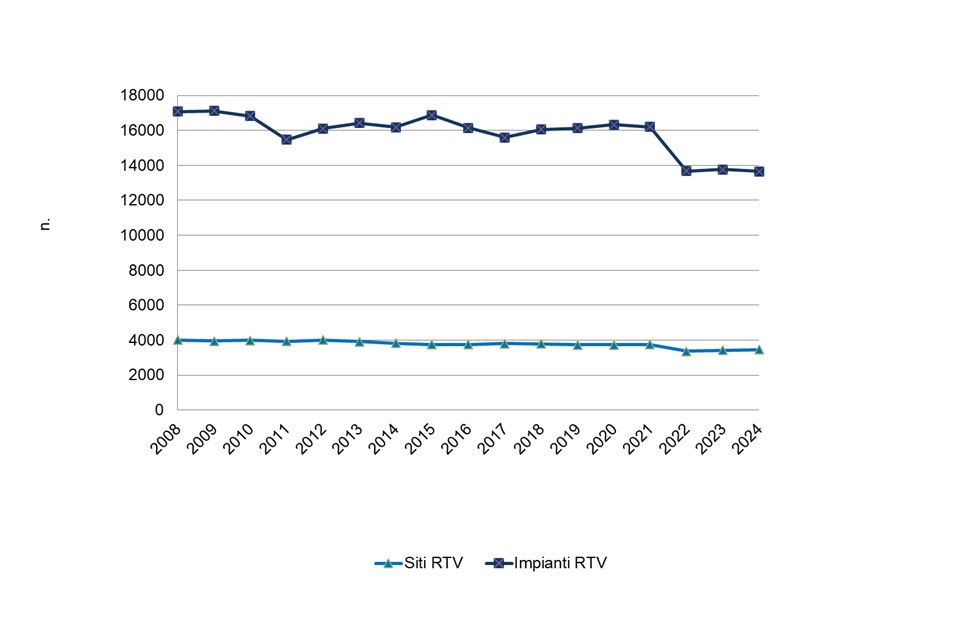
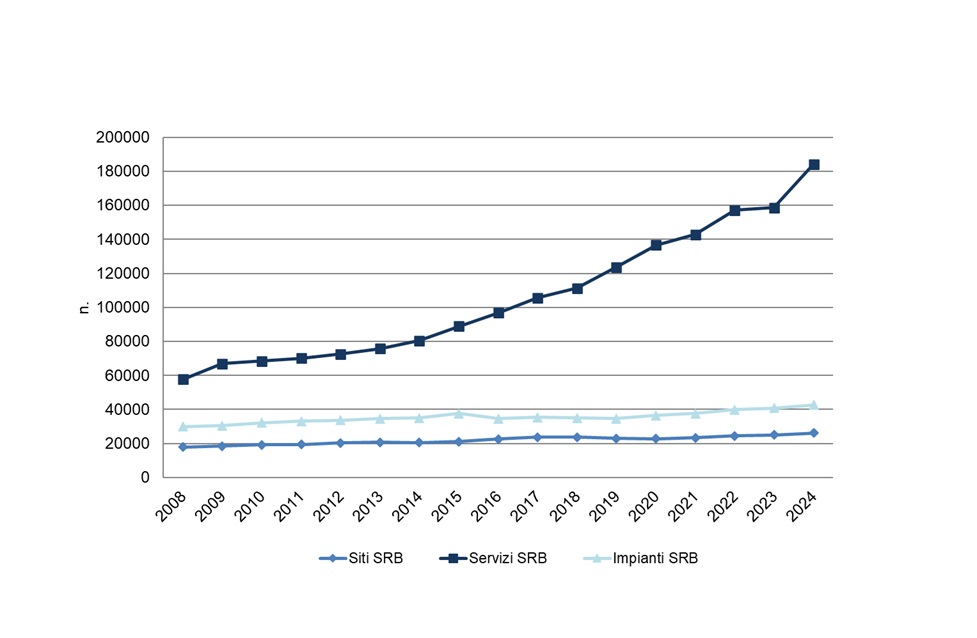
For the trend, the autonomous regions/provinces that provided complete data for the time period 2008-2024 for both types of RTV and BTS sources were considered, as well as those for which it was possible to integrate the missing information by reporting the useful information from the previous year or, in the absence of this, that of the first available subsequent year (Valle d'Aosta, Lombardy, Trentino-Alto Adige, Veneto, Friuli-Venezia Giulia, Emila Romagna, Tuscany, Umbria and Marche). In Figures 3, 4 and 5 it is possible to observe, in the period 2008-2024, the different trend that characterizes these two types of radio telecommunications systems. The number of sites and the number of RTV systems remained almost unchanged until 2021, with the exception of 2011 with a change in the number of systems of -8.0%, going from 16,815 to 15,470; in 2022 there are significant decreases (-10.4% RTV sites, -15.5% RTV plants). Subsequently, the number of RTV sites increases slightly again, settling at +1.0% in 2024, going from 3425 to 3458. The number of RTV systems, however, fluctuates, subsequently settling at a slight decrease in 2024 (-0.7%) going from 13,765 to 13,662. The overall RTV power had an overall decreasing trend with the exception of 2014 in which an increase of 7.8% was recorded, going from 9,738 kW to 10,502 kW. These trends are only partly attributable to a real change in installations in the area. In fact, the regional representatives themselves in some cases point out that these variations are due to more accurate information through the use of new regional databases for the collection of information and by control and verification activities of the managers themselves. Regarding Base Transceiver Stations (BTS) for communication, from 2008 until 2024 the trend is generally increasing in terms of services and power. With regards to BTS plants and sites, the trend is generally increasing but in the period 2014-2020 some negative fluctuations were recorded, the most significant of which occurred in 2019 for BTS sites (-2.7%), going from 23,679 to 23,036 and in 2016 for BTS plants (-7.7%), going from 37,601 to 34,710. In 2024, there is a slight increase in sites (from 25,142 to 26,108, +3.8%), plants (from 40,757 to 42,673, +4.7%) and services (from 158,627 to 184,284, +16.2%). The overall BTS power records a significant increase in 2024 (+28.8%), going from 22,217 kW to 28,616 kW. Also in this case, as for RTV systems, the data processed may depend on better information on what is installed in the area and not always on an actual change in the installations.
| Data |
|---|
Headline
Table 1: Number of radiotelevision (RTV) installations, number of sites, and associated total power (2024). Data source
ISPRA processing based on ARPA/APPA data (EMF Observatory) and ISTAT data (update as of 01/01/2025). Data legend
a The Italy total refers to regions for which the data are updated and complete;
Note
For Emilia-Romagna, it should be noted that as of 2024 the regional computerized register of RTV installations has become operational. It has been designed in a manner consistent with, and connected to, the CEN. The register has been populated with legacy information derived from the former regional register, appropriately integrated with data available from preventive assessment procedures carried out by Arpae Emilia-Romagna, as well as from AGCom and Corecom websites. For television installations, the data refer to the post switch-off phase (REFARMING 2019), while for radio broadcasting installations a comprehensive verification campaign across the regional territory is currently ongoing, with progressive data updating; for this reason, the information on power levels is PARTIAL. In addition, starting from this year, individual supporting structures hosting RTV installations are counted as sites, in order to ensure consistency with SRB site counting and with the criteria adopted in the register. |
Headline
Table 2: Number of services for base transceiver stations (BTS), number of sites, and associated total power (2024). Data source
ISPRA processing based on ARPA/APPA data (EMF Observatory) and ISTAT data (update as of 01/01/2025). Data legend
a The Italy total refers to regions for which the data are updated and complete;
|
Thumbnail
Headline
Figure 1: Density of installations/services and sites, comparison between RTV and BTS, for the regions for which complete data are available (2024) for both source categories. Data source
ISPRA processing based on ARPA/APPA data (EMF Observatory) Note
The Regions/Autonomous Provinces that provided complete data for both source categories (RTV and BTS) for the year 2024 were considered (Piedmont, Aosta Valley, Lombardy, Trentino–Alto Adige, Veneto, Friuli Venezia Giulia, Emilia-Romagna, Tuscany, Umbria, Campania, and Sicily). |
Thumbnail

Headline
Figure 2: Total power, comparison between RTV and BTS, for the regions for which complete data are available (2024) for both source categories. Data source
ISPRA processing based on ARPA/APPA data (EMF Observatory) Note
Notes: The Regions/Autonomous Provinces that provided complete data for both source categories (RTV and BTS) for the year 2024 were considered (Aosta Valley, Lombardy, Trentino–Alto Adige, Veneto, Friuli Venezia Giulia, Emilia-Romagna, Tuscany, Umbria, Campania, Calabria, and Sicily). |
Thumbnail
Headline
Figure 3: Number of RTV installations and sites over the 2008–2024 time period. Data source
ISPRA processing based on ARPA/APPA data (EMF Observatory) Note
Both the Regions/Autonomous Provinces that provided complete data for the entire 2008–2024 time period for both RTV and BTS source categories, and those that provided partial information subsequently completed using a statistical criterion, were considered (Aosta Valley, Lombardy, Trentino–Alto Adige, Veneto, Friuli Venezia Giulia, Emilia-Romagna, Tuscany, Umbria, and Marche). |
Thumbnail
Headline
Figure 4: Number of BTS installations, services, and sites over the 2008–2024 time period. Data source
ISPRA processing based on ARPA/APPA data (EMF Observatory) Note
Both the Regions/Autonomous Provinces that provided complete data for the entire 2008–2024 time period for both RTV and BTS source categories, as well as those that provided partial information subsequently completed using a statistical criterion, were considered (Aosta Valley, Lombardy, Trentino–Alto Adige, Veneto, Friuli Venezia Giulia, Emilia-Romagna, Tuscany, Umbria, and Marche). |
Thumbnail
Headline
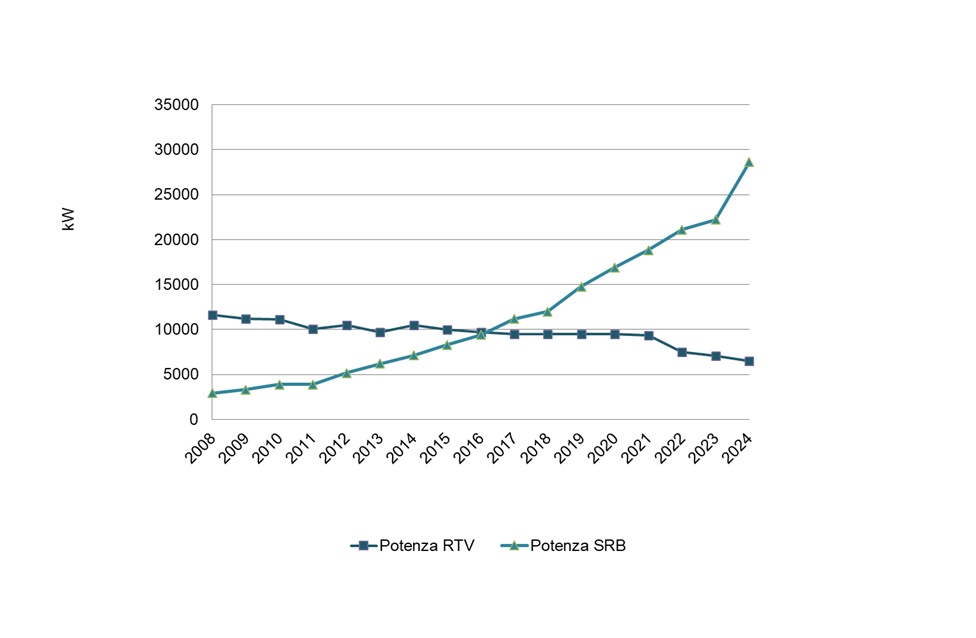
Figure 5: Power of RTV and BTS installations over the 2008–2024 time period. Data source
ISPRA processing based on ARPA/APPA data (EMF Observatory) Note
Both the Regions/Autonomous Provinces that provided complete data for the entire 2008–2024 time period for both RTV and BTS source categories, as well as those that provided partial information subsequently completed using a statistical criterion, were considered (Aosta Valley, Lombardy, Trentino–Alto Adige, Veneto, Friuli Venezia Giulia, Emilia-Romagna, Tuscany, Umbria, and Marche). |
There continues to be a strong gap between the overall powers that characterize the two types of electromagnetic sources (RTV and BTS); in fact, technological development in the mobile telephony sector and consequently the greater presence of new BTS services in the area has inevitably increased the overall power of the latter compared to that of RTV systems. It should be underlined that the comparison is made between RTV systems and BTS services as both are associated by definition with the implemented transmission system. This continuously growing trend in the number of BTS services and the relative overall power reflects the strong technological development that continues to characterize the mobile telephony sector with the succession of new communication technologies, starting from 2G up to 5G. There remain numerous critical issues that characterize the retrieval of information relating to the plants in question. Some factors that fuel these critical issues include delays in the implementation of precise regulatory provisions for the provision of data by the managers of the plants in question, efficiency of data collection tools at local level, lack of human and financial resources dedicated to this data collection activity. For these reasons, some regions do not have the data available or updated. However, it is necessary to underline that the development of collection tools such as databases, land registers, etc. It also leads to more complete information on the RF systems present in the area. It follows in fact that the variations in the data relating to the plants in question can be linked either to a real variation in the territory of RTV/BTS sites, plants and services or to more accurate information available to the ARPA/APPA representatives through their data collection systems (such as for example land registers, computerized archives).