Aree
AMBIENT AIR QUALITY: BENZO(A)PYRENE IN PM 10
Data aggiornamento scheda:
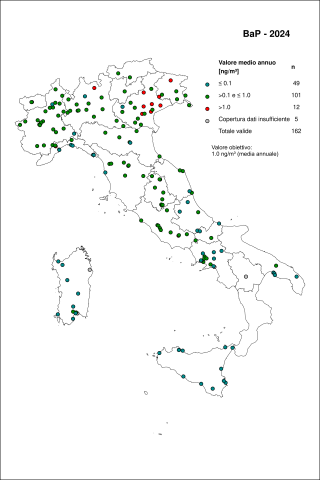
The indicator is based on the concentration data of benzo(a)pyrene in the atmosphere, measured during 2024 in monitoring stations distributed throughout the national territory, collected and archived in ISPRA in the InfoAria database, in accordance with the provisions of Directive 2008/50/EC (and the legislative decree transposing Legislative Decree 155/2010) and Decision 2011/850/EU. The monitoring stations that measured and communicated B(a)P data are 167, of which 162 have data series with sufficient time coverage to verify the reference values. Exceedances of the target value were recorded in 12 stations, equal to 7.4% of cases.
AMBIENT AIR QUALITY: NITROGEN DIOXIDE (NO 2)
Data aggiornamento scheda:
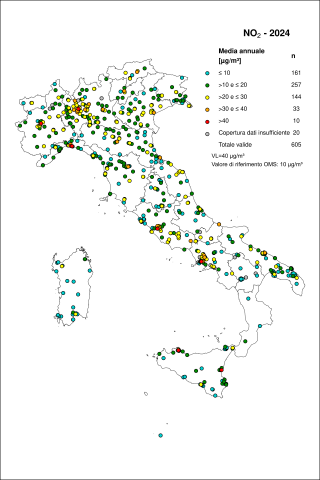
The indicator is based on nitrogen dioxide (NO) concentration data 2) in the atmosphere measured during 2024 in monitoring stations distributed across the national territory, collected and archived by ISPRA in databases InfoAria, in accordance with the provisions of Directive 2008/50/EC (and the legislative decree transposing Legislative Decree 155/2010) and Decision 2011/850/EU. The monitoring stations that measured and reported NO 2 there are 625, of which 605 have data series with sufficient time coverage to verify the reference values. The hourly limit value is respected everywhere: in no station has 200 µg/m³, as an hourly average, been exceeded more than 18 times. The WHO reference value, which does not foresee exceeding 200 µg/m³, is exceeded in 5 stations (equal to 0.83% of stations with sufficient temporal coverage). The annual limit value, equal to 40 µg/m³ as an annual average, is exceeded in 10 stations (1.7%). The WHO reference value for long-term effects on human health, equal to 10 µg/m³ as an annual average, is exceeded in 444 stations (73.4%).
AMBIENT AIR QUALITY: PARTICULATE (PM 10)
Data aggiornamento scheda:
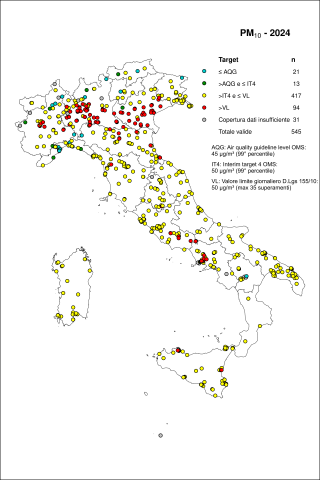
The indicator is based on PM concentration data 10 in the atmosphere measured during 2024 in monitoring stations distributed throughout the national territory, collected and archived in ISPRA in the InfoAria database, in accordance with the provisions of Directive 2008/50/EC (and the legislative decree implementing Legislative Decree 155/2010) and Decision 2011/850/EU. The monitoring stations that measured and reported PM data 10 there are 576., of which those with sufficient time coverage for the verification of the reference values are 545. The annual limit value was exceeded in one station (equal to 0.2% of cases), while exceeding the daily limit value was recorded in 94 stations (equal to 17.2% of cases). Finally, both the annual WHO reference value (90.5% of cases) and the daily one (96.1% of cases) are exceeded in the majority of monitoring stations.
AMBIENT AIR QUALITY: PARTICULATE (PM2.5)
Data aggiornamento scheda:
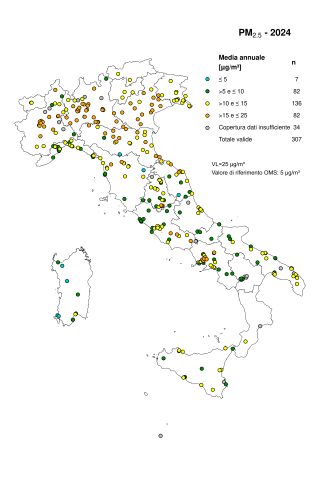
The indicator is based on PM concentration data 2,5 in the atmosphere measured during 2024 in monitoring stations distributed across the national territory, collected and archived in ISPRA in the InfoAria database, in accordance with the provisions of Directive 2008/50/EC (and the legislative decree transposing Legislative Decree 155/2010 and subsequent amendments) and Decision 2011/850/EU. The monitoring stations that measured and reported PM data 2,5 are 341, of these, 207 have data series with sufficient time coverage for the verification of the reference values are 307. The annual limit value of the PM 2,5 (25 µg/m³) is respected in all cases. However, in the majority of monitoring stations, the WHO annual reference value of 5 µg/m³ is exceeded (97.7% of cases).
AMBIENT AIR QUALITY: TROPOSPHERE OZONE (O 3)
Data aggiornamento scheda:
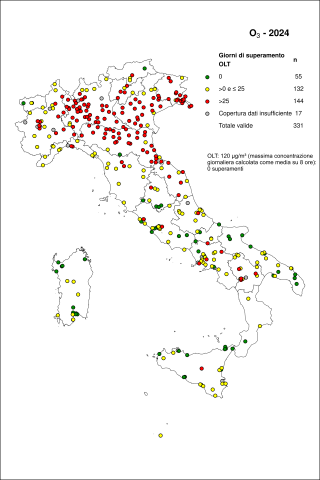
The indicator is based on the ozone concentration data in the atmosphere measured during 2024, in monitoring stations distributed across the national territory, collected and archived in ISPRA in the InfoAria database, in accordance with the provisions of Directive 2008/50/EC (and the legislative decree transposing Legislative Decree 155/2010) and Decision 2011/850/EU. The monitoring stations that measured and for which O. Data were transmitted 3 there are 348., of which those with sufficient time coverage for the verification of the threshold values and the long-term objective for the protection of human health are 331. The suburban, rural and rural background stations that respect the minimum percentage required for the calculation of the long-term objective for the protection of vegetation (AOT40v) are 158. The long-term objective for the protection of human health (OLT) was exceeded in almost all the stations: 83.4%. The percentage of stations where the OLT was exceeded for more than 25 days was 43.5%. The information threshold for health protection was exceeded in 17.5% of the stations while the alarm threshold was exceeded in only 1 station. The WHO reference value, equal to 100 µg/m³ as the 99th percentile, is exceeded in 310 stations (equal to 94% of the stations with sufficient temporal coverage). The long-term objective for vegetation protection (AOT40v) was exceeded in almost all stations (92.4%).
EMISSIONS OF ACIDIFYING SUBSTANCES (SOx, NOx, NH3): TREND AND SECTOR BREAKDOWN
Data aggiornamento scheda:
The indicator describes the trend in national emissions of the acidifying substances SOx, NOx, and NH₃, both in total and by sector, highlighting the decreasing trend from 1990 to 2023 (-72.3%). With reference to Directive (EU) 2016/2284 of the European Parliament and of the Council on the reduction of national emissions of certain atmospheric pollutants—which defines national emission reduction commitments compared to 2005, applicable from 2020 to 2029 and from 2030 onwards—sulphur oxides and ammonia achieved the required 2020 reduction target as early as 2009, while nitrogen oxides reached it in 2014.
EMISSIONS OF PERSISTENT ORGANIC COMPOUNDS (PAHs, DIOXINS AND FURANS): TREND AND SECTOR DISAGGREGATION
Data aggiornamento scheda:
The indicator represents the trend of national emissions of persistent organic compounds by sector of origin, from 1990 to 2023. The objective of achieving emission values lower than those of 1990 was achieved both for PAHs (-32%) and for dioxins and furans (-44%), albeit with different trends.
FINE PARTICULATE MATTER (PM2.5) EMISSIONS: TREND AND SECTORAL DISAGGREGATION
Data aggiornamento scheda:
The indicator represents the trend in national emissions of particulate matter (PM2.5) by sector of origin from 1990 to 2023, highlighting a marked reduction over the years at a total level (-41%). The road transport sector, which contributes to total emissions with an emission share of 8.9% in 2023, presents a reduction of 77% over the entire period. Emissions from non-industrial combustion, in the same period, grew by 34%, representing the most important sector in 2023 with 64.4% of total emissions.
GREENHOUSE GAS EMISSIONS (CO 2, CH 4, N 2 O, HFCS, PFCS, SF 6): SECTORAL DISAGGREGATION
Data aggiornamento scheda:
The indicator represents the time series of national greenhouse gas emissions from 1990 to 2023, broken down by sector of origin. Data analysis shows that in 2023 there was a significant reduction in emissions compared to 1990 (-26.4%), explained by the economic recession, which curbed consumption in recent years, but also by a greater use of renewable energy sources. This resulted in a reduction in CO₂ emissions from the energy sector (-26.9% compared to 1990).
HEAVY METAL EMISSIONS (CD, HG, PB): TREND AND SECTOR DISAGGREGATION
Data aggiornamento scheda:
The indicator represents the time series of national emissions of heavy metals from 1990 to 2023, by source sector. Since 1990, a reduction in emissions has been observed for all metals. In particular, emissions of cadmium, mercury and lead are in line with the objectives set at the international level by the Aarhus Protocol, having decreased compared to 1990 values by -62%, -65% and -95%, respectively.
NATIONAL EMISSIONS OF TROPOSPHERIC OZONE PRECURSORS IN OZONE FORMATION POTENTIAL (TOFP): TREND AND SECTORAL DISAGGREGATION
Data aggiornamento scheda:
This indicator represents the national trend of emissions of tropospheric ozone precursors: nitrogen oxides (NOx) and non-methane volatile organic compounds (NMVOCs), disaggregated by source sector. A marked decrease is observed between 1990 and 2023 (-74% for NOx and -57% for NMVOCs), mainly driven by the strong reduction of emissions from the transport sector.
PARTICULATE EMISSIONS (PM10): TREND AND SECTOR BREAKDOWN
Data aggiornamento scheda:
The indicator represents the trend in national emissions of particulate matter (PM10) by sector of origin from 1990 to 2023, highlighting a marked reduction over the years on a total level (-42.9%). The road transport sector, which contributes to total emissions with an emission share of 9.8% in 2023, presents a reduction of 67.8% over the entire period. Emissions from non-industrial combustion, in the same period, grew by approximately 33.7%, representing the most important sector in 2023 with 45.9% of total emissions.
AVERAGE TEMPERATURE
Data aggiornamento scheda:
The indicator describes the trend of mean temperature in Italy.
The increase in mean temperature recorded in Italy over the last thirty years has often exceeded the global average over land. In 2024, the mean temperature anomaly in Italy, relative to the 1991–2020 climatological baseline, was +1.33 °C—higher than the global land surface anomaly of +1.03 °C. In Italy, 2023 ranked as the warmest year in the entire annual time series starting from 1961. Since 2000, temperature anomalies relative to the 1991–2020 baseline have consistently been positive, except for four years (2004, 2005, 2010, and 2013).
CUMULATIVE PRECIPITATION
Data aggiornamento scheda:
The indicator describes the amount and spatial distribution of precipitation in Italy. In 2024, total annual precipitation in Italy was about 8% higher than the average value for the reference period 1991–2020. Northern and north-central areas were characterised by positive anomalies, while most of the remaining part of the country recorded widespread negative anomalies.
FROST DAYS
Data aggiornamento scheda:
This indicator describes trends in cold extremes across Italy, specifically quantifying the number of frost days, defined as days with daily minimum air temperature less than or equal to 0°C. In 2024, a reduction of approximately 13.7 frost days was observed compared to the 1991–2020 climatological baseline.
GREENHOUSE GAS EMISSIONS (CO 2, CH 4, N 2 O, HFCS, PFCS, SF 6 ): TRENDS AND PROJECTIONS
Data aggiornamento scheda:
The indicator represents projections of national greenhouse gas emissions up to 2055, considering the scenario based on policies in place as of 31 December 2022 — thus including those under the National Recovery and Resilience Plan (NRRP) — and the scenario with additional policies and measures defined by the National Integrated Energy and Climate Plan (PNIEC).
The scenario was developed starting from the latest consolidated historical data for 2023, as well as the expected evolution of key macroeconomic drivers according to the information provided to the European Commission.
Information available for 2024 and data relating to the first seven months of 2025 were also taken into account.
The projected reductions in total greenhouse gas emissions (including LULUCF) estimated for 2030 compared to 1990 are -42% in the current policies scenario and -53% in the additional policies scenario.
HEAT WAVES
Data aggiornamento scheda:
The indicator describes the trend of intense heat events in Italy. A heat wave is defined as an event lasting at least 6 consecutive days during which the maximum temperature exceeds the 90th percentile of the daily maximum temperature distribution for the same period of the year over the 30-year climatological reference period. The indicator counts the number of days characterized by such heat waves in a given year. In 2024, an increase of approximately 29.3 heat wave days was observed compared to the average value calculated over the reference 30-year period (1991–2020).
SUMMER DAYS
Data aggiornamento scheda:
The indicator describes the trend in extreme heat events in Italy, specifically representing the number of days with a maximum daily air temperature exceeding 25 °C. In 2024, an increase of approximately 6.9 summer days was observed compared to the climatological average for the 1991–2020 reference period.
TROPICAL NIGHTS
Data aggiornamento scheda:
The indicator describes the trend in extreme heat events in Italy, specifically representing the number of days with a minimum daily air temperature exceeding 20 °C. In 2025, an increase of approximately 25.2 tropical nights was observed compared to the climatological average for the 1991–2020 reference period.
VERY HOT DAYS
Data aggiornamento scheda:
The indicator describes the trend in extreme heat events in Italy, specifically representing the number of days with a daily maximum air temperature exceeding 35 °C. In 2024, an increase of approximately 11.4 extremely hot days was observed compared to the climatological average for the 1991–2020 reference period.
GREENHOUSE GAS EMISSIONS (CO2, CH4, N2O, HFCS, PFCS, SF6): PER CAPITA AND GDP
Data aggiornamento scheda:
The indicator represents, over the period 1990-2023, the trend of greenhouse gas emissions in Italy per capita and relative to GDP. A decrease is observed for both, accentuated by the growth of the population and GDP, which highlights a decoupling between drivers and pressures.
GREENHOUSE GAS EMISSIONS IN ETS AND ESD SECTORS
Data aggiornamento scheda:
The indicator consists of the share of greenhouse gas emissions generated by installations covered under the EU Emissions Trading System (EU ETS), established by Directive 2003/87/EC, as well as emissions from all sectors not included in the ETS—namely small- and medium-scale industry, transport, residential and commercial buildings, agriculture, and waste. These non-ETS emissions were regulated under the Effort Sharing Decision (Decision No. 406/2009/EC) up to 2020 and, from 2021 onward, under the Effort Sharing Regulation (Regulation (EU) 2018/842).In 2020, emissions from the non-ETS sectors were below the national annual target of 37 MtCO₂eq. However, from 2021 onwards, emissions have not aligned with the annual reduction targets set under the Effort Sharing Regulation.
GLACIER MASS BALANCE
Data aggiornamento scheda:
The indicator is calculated for a limited sample of Alpine glaciers and represents the algebraic sum of ice mass gained through snowfall accumulation and mass lost through melting during the ablation period. Glacier mass balance data provide a fundamental measure for assessing the "health status" of glaciers.
Analysis of data from 1995 to 2023 shows that, for the glaciers considered collectively, the cumulative mass balance exhibits significant losses, ranging from nearly 25 meters water equivalent for the Basòdino glacier to over 50 meters water equivalent for the Caresèr glacier, corresponding to an average annual mass loss exceeding one meter water equivalent.