Gabriella Aragona
The indicator measures the total amount of Waste from Economic Activities sent for recovery operations (R1–R12) listed in Annex C to Legislative Decree No 152/2006. In 2024, the amount of Waste from Economic Activities recovered was substantial, accounting for 75.2% of the total waste managed (187.2 million tonnes), with a steadily increasing trend (+8.8% over the last three years). The total amount of Waste from Economic Activities recovered was 140.8 million tonnes, of which 4.3 million tonnes were hazardous. Lombardy recorded the largest amount of Waste from Economic Activities recovered (26.3% of the total recovered), followed by Veneto (10.8%) and Emilia-Romagna (8.7%).
The indicator measures the total quantity of Waste from Economic Activities started for the recovery operations (R1-R12) referred to in Annex C of Legislative Decree 152/2006.
Check the effectiveness of waste management policies with particular reference to the incident of the recovery and reuse of waste, both of matter and energy.
Legislative Decree 152/06, in line with the European strategy on waste management, in art. 181, paragraph 3, establishes the adoption of measures aimed at promoting the recovery of waste in accordance with priority criteria (art. 179), or, in compliance with the following hierarchy:
• Prevention,
• Preparation for reuse,
• Recycling,
• other recovery (e. g. Energy recovery) and disposal.
In addition, paragraph 3 itself, establishes that high quality recycling of recycling must be adopted. In article 183, paragraph 1, letter u), it is expressly defined as recycling: "any recovery operation through which waste is treated to obtain products, materials or substances to be used for their original function or for other purposes".
ISPRA - Rapporto rifiuti speciali - 2026
Mud database, not accessible to the public
Nazionale, regionale
1997-2024
Quantity of Waste from Economic Activities recovered (tons)
Green Deal
The indicator is built by adding the quantities ofWaste from Economic Activities recovered according to the following recovery operations: R1: main use as fuel or as other means to produce energy; R2: regeneration/recovery of solvents; R3: recycling/recovery of organic substances not used as solvents (including composting operations and other biological transformations); R4: recycling/recovery of metals and metal compounds; R5: recycling/recovery of other inorganic substances; R6: regeneration of acids or bases; R7: recovery of products that serve to reduce pollution; R8: recovery of products from catalysts; R9: regeneration or other reuse of oils; R10: treatment in the terrestrial environment for the benefit of agriculture or ecology; R11: Use of waste obtained by one of the operations indicated by R1 A R10; R12: exchange of waste to submit them to one of the operations indicated by R1 at R11. The national figure is provided disaggregated by region.
The amount of Waste from Economic Activities recovered was substantial, accounting for 75.2% of the total waste managed (187.2 million tonnes), equivalent to 140.8 million tonnes (Table 1).
Between 1997 and 2024, the trend showed continuous growth, with the only significant decline (-2.6%), probably attributable to the economic downturn, occurring in 2012 compared with 2011 (Table 1), in line with the decrease in the amount of waste generated (-3%). In particular, over the last decade (2015–2024), the amount of Waste from Economic Activities recovered increased by 55.4%.
| Allegati |
|---|
Titolo
Table 1: Trend in the quantity of Waste from Economic Activities recovered in Italy Fonte
ISPRA Legenda
* The operations considered for the calculation of recovered Waste from Economic Activities are as follows: R3: Recycling/recovery of organic substances not used as solvents (including composting and other biological transformations), |
Titolo
Table 2: Quantity of total Waste from Economic Activities and hazardous Waste from Economic Activities recovered by region Fonte
ISPRA Note
The total quantity of Waste from Economic Activities recovered from 2011 onwards also includes operation R12 |
Thumbnail
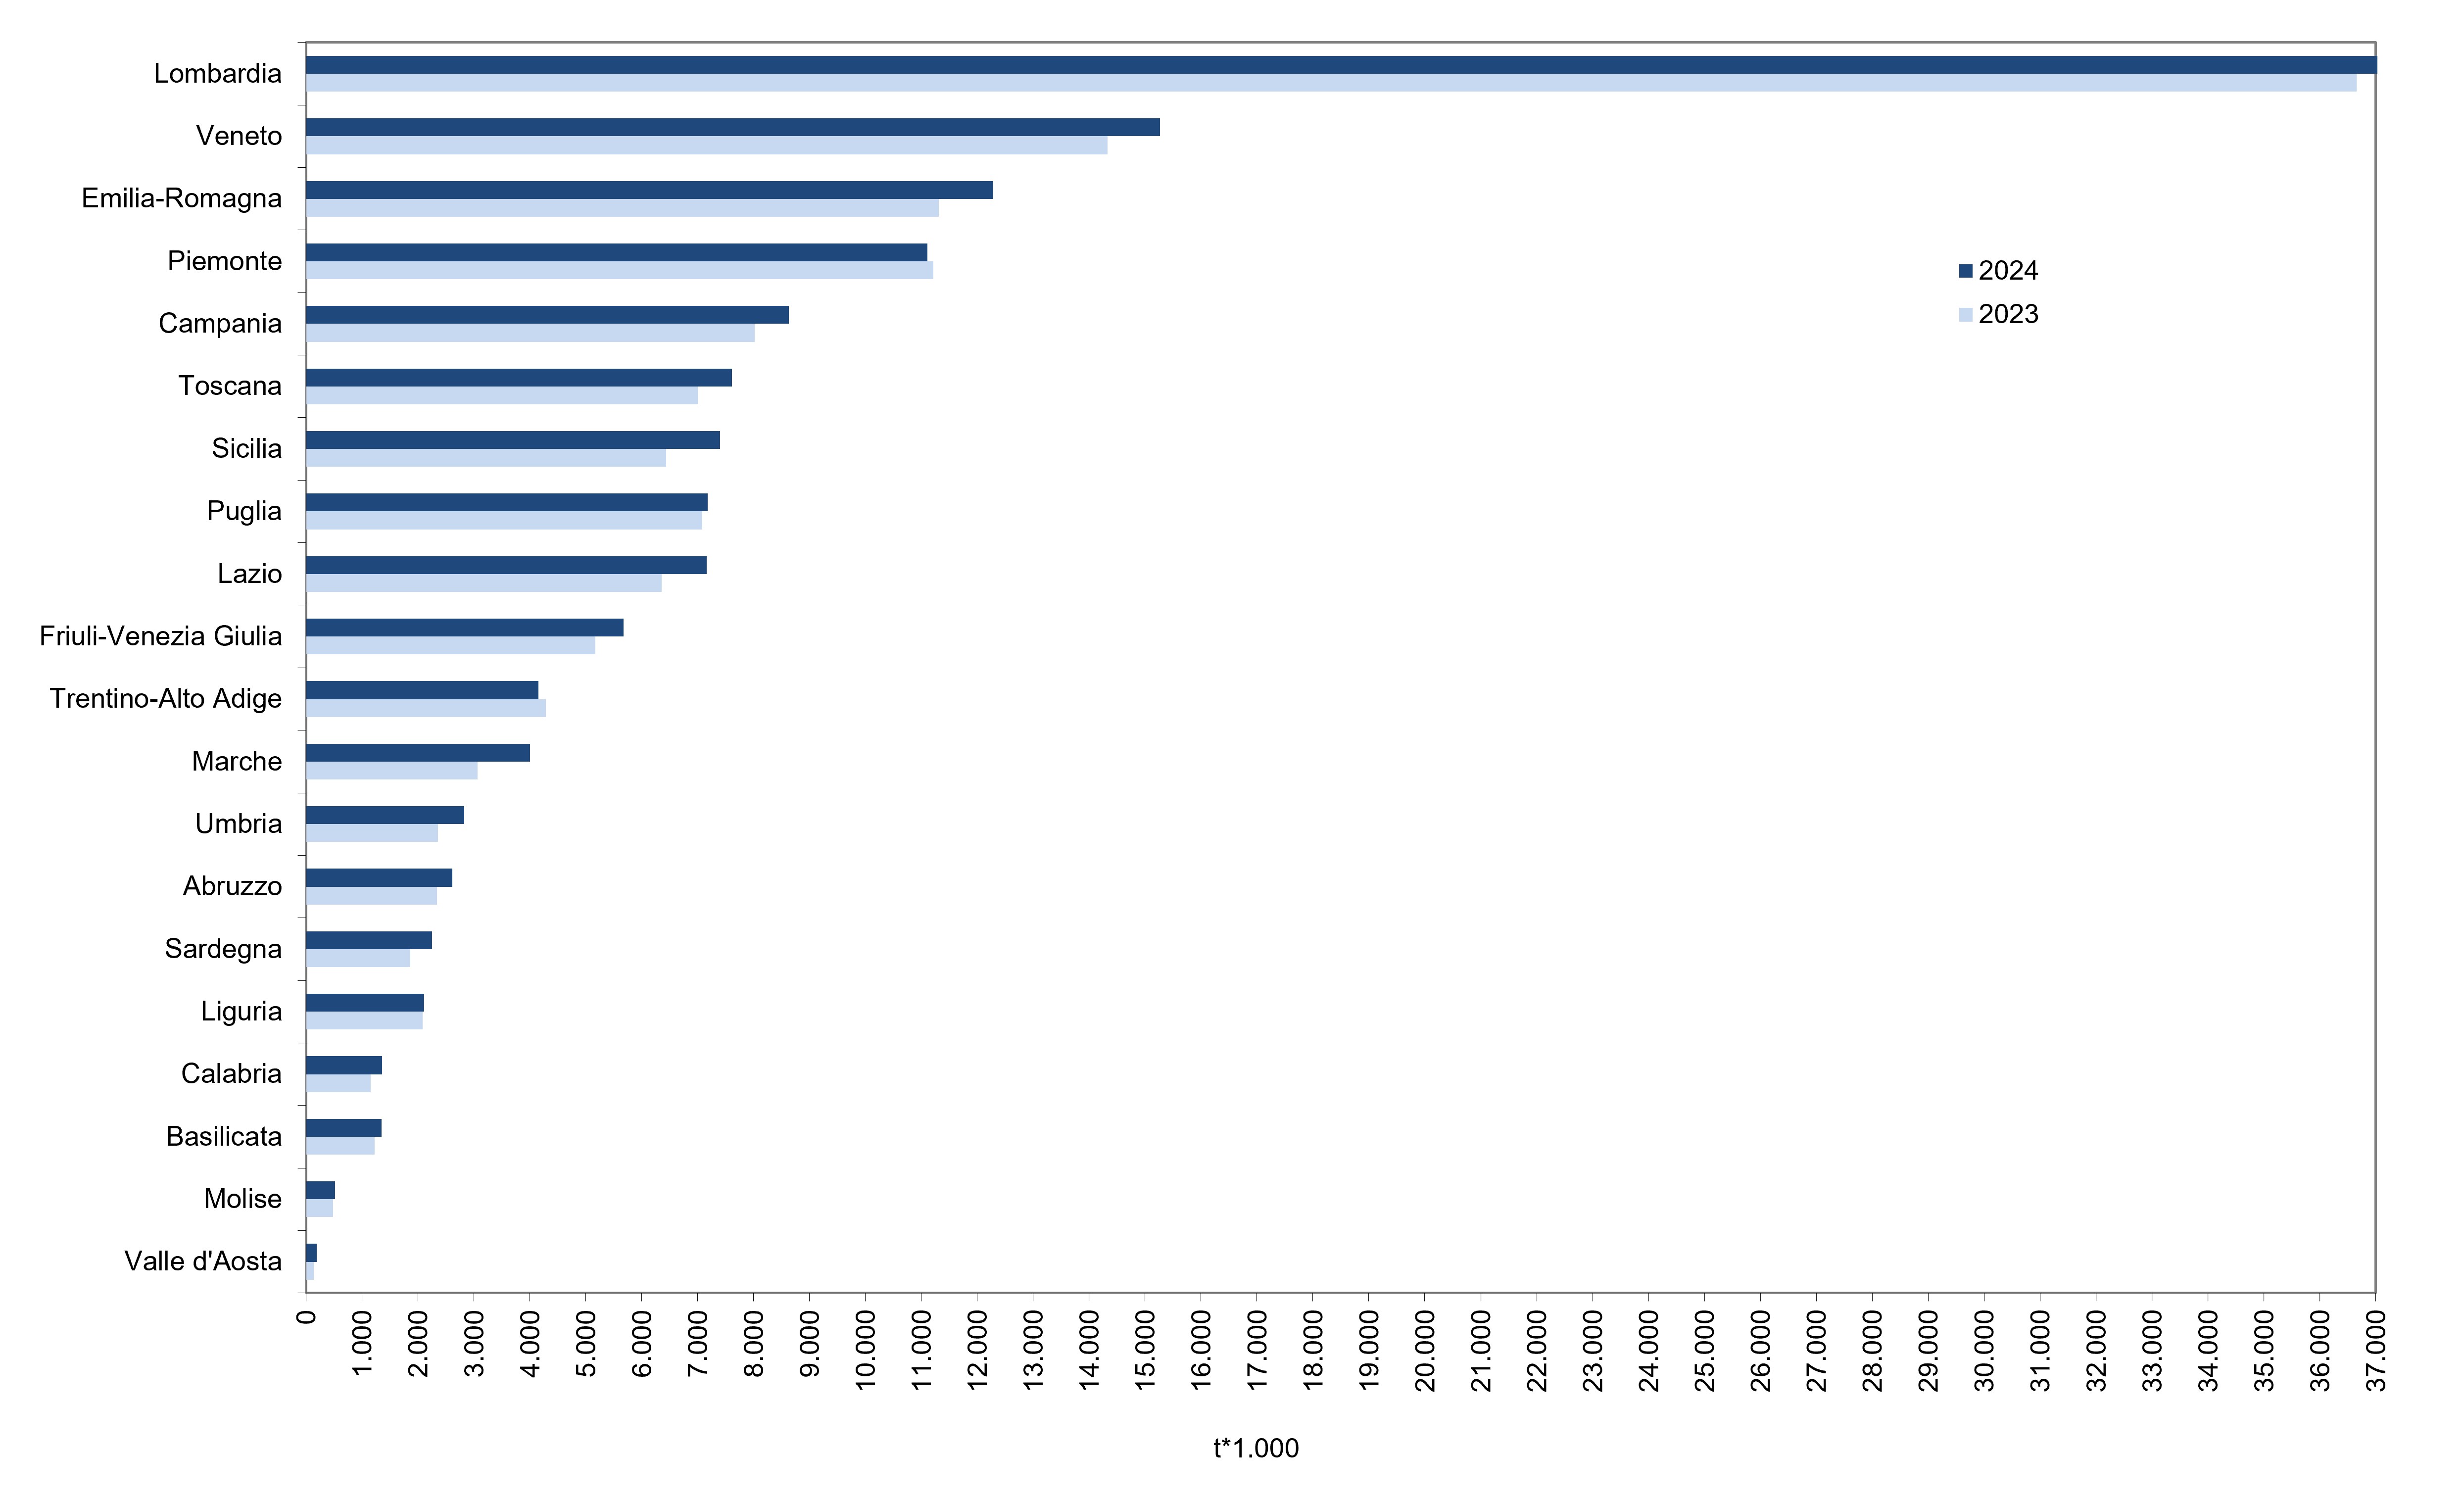
Titolo
Figure 1: Quantity of Waste from Economic Activities recovered Fonte
ISPRA |
In 2024, the total amount of Waste from Economic Activities recovered (operations R1–R12) amounted to 140.8 million tonnes, of which approximately 4.3 million tonnes were hazardous. Compared with 2023 (132.6 million tonnes recovered), this represents an increase of 6.2% (Table 1). Among the regions recording the largest quantities of Waste from Economic Activities recovered, Lombardy accounted for 26.3% of the total, followed by Veneto (10.8%) and Emilia-Romagna (8.7%) (Table 2 and Figure 1).