Antonella Bernetti, Gianluca Iarocci
This indicator measures the quantitative consistency and evolution of the road vehicle fleet in Italy by relating it to the resident population - through parameters such as vehicles per inhabitant - in order to measure the size of a fleet which constitutes an important factor of environmental pressure. According to Eurostat, Italy has the highest vehicle fleet among the European Union countries in relation to the population. In 2024, the number of cars per thousand inhabitants is 701 (exceeded only by Liechtenstein which is not a member of the European Union). The fleet circulating on the road is characterized by growth over the years mainly driven by the passenger car sector
The indicator measures the evolution of the road vehicle fleet, responsible for a large part of the energy consumption, greenhouse gas emissions and pollutant emissions of the transport sector.
Measure the size of your vehicle fleet
The regulatory framework associated with the indicator of the size and density of the vehicle fleet is articulated through a complex multi-level legislative architecture that connects the guidelines of the European Union to national policies and the planning of local authorities. Since it is an indicator that directly measures the concentration of vehicles and the rate of private motorisation, its main references are closely linked to climate regulations, the protection of air quality and the regulation of urban and territorial mobility.
On a European level, the indicator finds its fundamental regulatory driver in the climate reform package called Fit for 55 and, in particular, in EU Regulation 2019/631 and its subsequent amendments. This legislation sets performance levels in terms of carbon dioxide emissions for new cars and light commercial vehicles, imposing a progressive reduction in emission targets up to the one hundred percent zero emissions limit starting from 2035, the year that will mark the halt in the sale of new internal combustion vehicles. EU Regulation 2024/1610 has a similar impact on the composition of heavy and collective vehicles, which defines the targets for heavy commercial vehicles and sets strict decarbonisation quotas for new urban and extra-urban bus fleets.
From the point of view of environmental protection and public health, the numerical consistency of the fleet in circulation directly affects the application of the European Directive 2016/2284, known as the NEC Directive, which requires Member States to structurally reduce national emissions of specific atmospheric pollutants, such as nitrogen oxides and fine particles, of which road transport is one of the main causes. In fact, data on the number and age of vehicles feed the national emissions inventory models managed by ISPRA, making it possible to verify compliance with the standards and the effectiveness of the progressive approval limits, i. e. The community regulations relating to the different Euro classes, up to the definition of the Euro 7 standard.
At a national level, the need to mitigate one of the highest rates of motorization in Europe and to encourage the modal shift towards forms of collective or soft transport is governed by state programmatic instruments. Among these, the Plan for the Ecological Transition stands out, adopted through an Interministerial Decree, which outlines the Italian strategies for sustainable mobility by setting objectives for reducing the private car fleet through the development of sharing mobility and the strengthening of public transport. In parallel, the Framework Law on Cycling Mobility (Law 2/2018) and the related General Plan provide the financing lines and principles to increase the share of non-motorised mobility, with the aim of alleviating vehicular pressure in urban areas.
Finally, local governance translates these macro-objectives onto the territory through regulatory planning and infrastructure tools. Legislative Decree 257/2016, which transposes the European DAFI Directive, imposes progressive road infrastructure for alternative fuels, linking the planning of electric charging points to the expected diffusion of vehicles. In urban contexts, the regulation of the impact of such a dense fleet is entrusted to the Urban Sustainable Mobility Plans (PUMS), made mandatory by ministerial guidelines for metropolitan cities and municipalities with over one hundred thousand inhabitants. The PUMS represent the local regulatory act designed to combat private hyper-motorisation through the establishment of limited traffic zones, pedestrian areas and circulation disincentives, calibrating their interventions precisely on the quantitative evolution of vehicles registered in the area.
ACI, Studies and research, various years, https://www. aci. it/laci/studi-e-ricerche. html
ISPRA, Italian Emission Inventory 1990 – 2024, Informative Inventory Report 2026, Higher Institute for Environmental Protection and Research, ISPRA, Reports 426/26, https://www. isprambiente. gov. it/it/pubblicazioni/rapporti/italian-emission-inventory-1990-2024-informative-inventory-report-2026
ISPRA, Italian Greenhouse Gas Inventory 1990-2024, National Inventory Document 2026 – Italian Greenhouse Gas Inventory 1990-2024, ISPRA, Reports 428/26 https://emissioni. sina. isprambiente. it/national-inventory-document/
The indicator is constructed on the basis of various basic data sources; for comparison purposes it is therefore necessary to take this aspect into account, in particular with reference to the data on the fleet in circulation coming from the ACI and MIT archives, which are not entirely aligned over the years.
-
ACI (Automobile Club of Italy)
ANCMA (National Cycle Motorcycle Accessories Association)
Eurostat (Statistical Office of the European Communities)
Istat (National Institute of Statistics)
MIT (Ministry of Infrastructure and Transport)
ACI, Data and Statistics, various years, http://www. aci. it/laci/studi-e-ricerche/dati-e-statistiche/open-data. html
ANCMA, Statistics on two-wheeled vehicles, various years, http://www. ancma. it/statistiche/
Istat Database, Data on the resident population, various years, https://esploradati. istat. it/databrowser/#/it
MIT, National Infrastructure and Transport Account, Ministry of Infrastructure and Transport, various years, http://www. mit. gov. it
Eurostat Database, European Commission, various years, https://ec. europa. eu/eurostat/data/database
ISPRA, National inventory of atmospheric emissions, various years, https://emissioni. sina. isprambiente. it/economia-nazionale/
National
1990-2024
The data on vehicles in circulation was processed on the basis of data from the Ministry of Infrastructure and Transport. The data on the resident population are from ISTAT sources. The park data are the basic data used to estimate emissions from road traffic for the purposes of drawing up the national inventory of atmospheric emissions. The reference vehicle categories derive from the COPERT classification. The Eurostat data reported for the Italian park are produced by ACI.
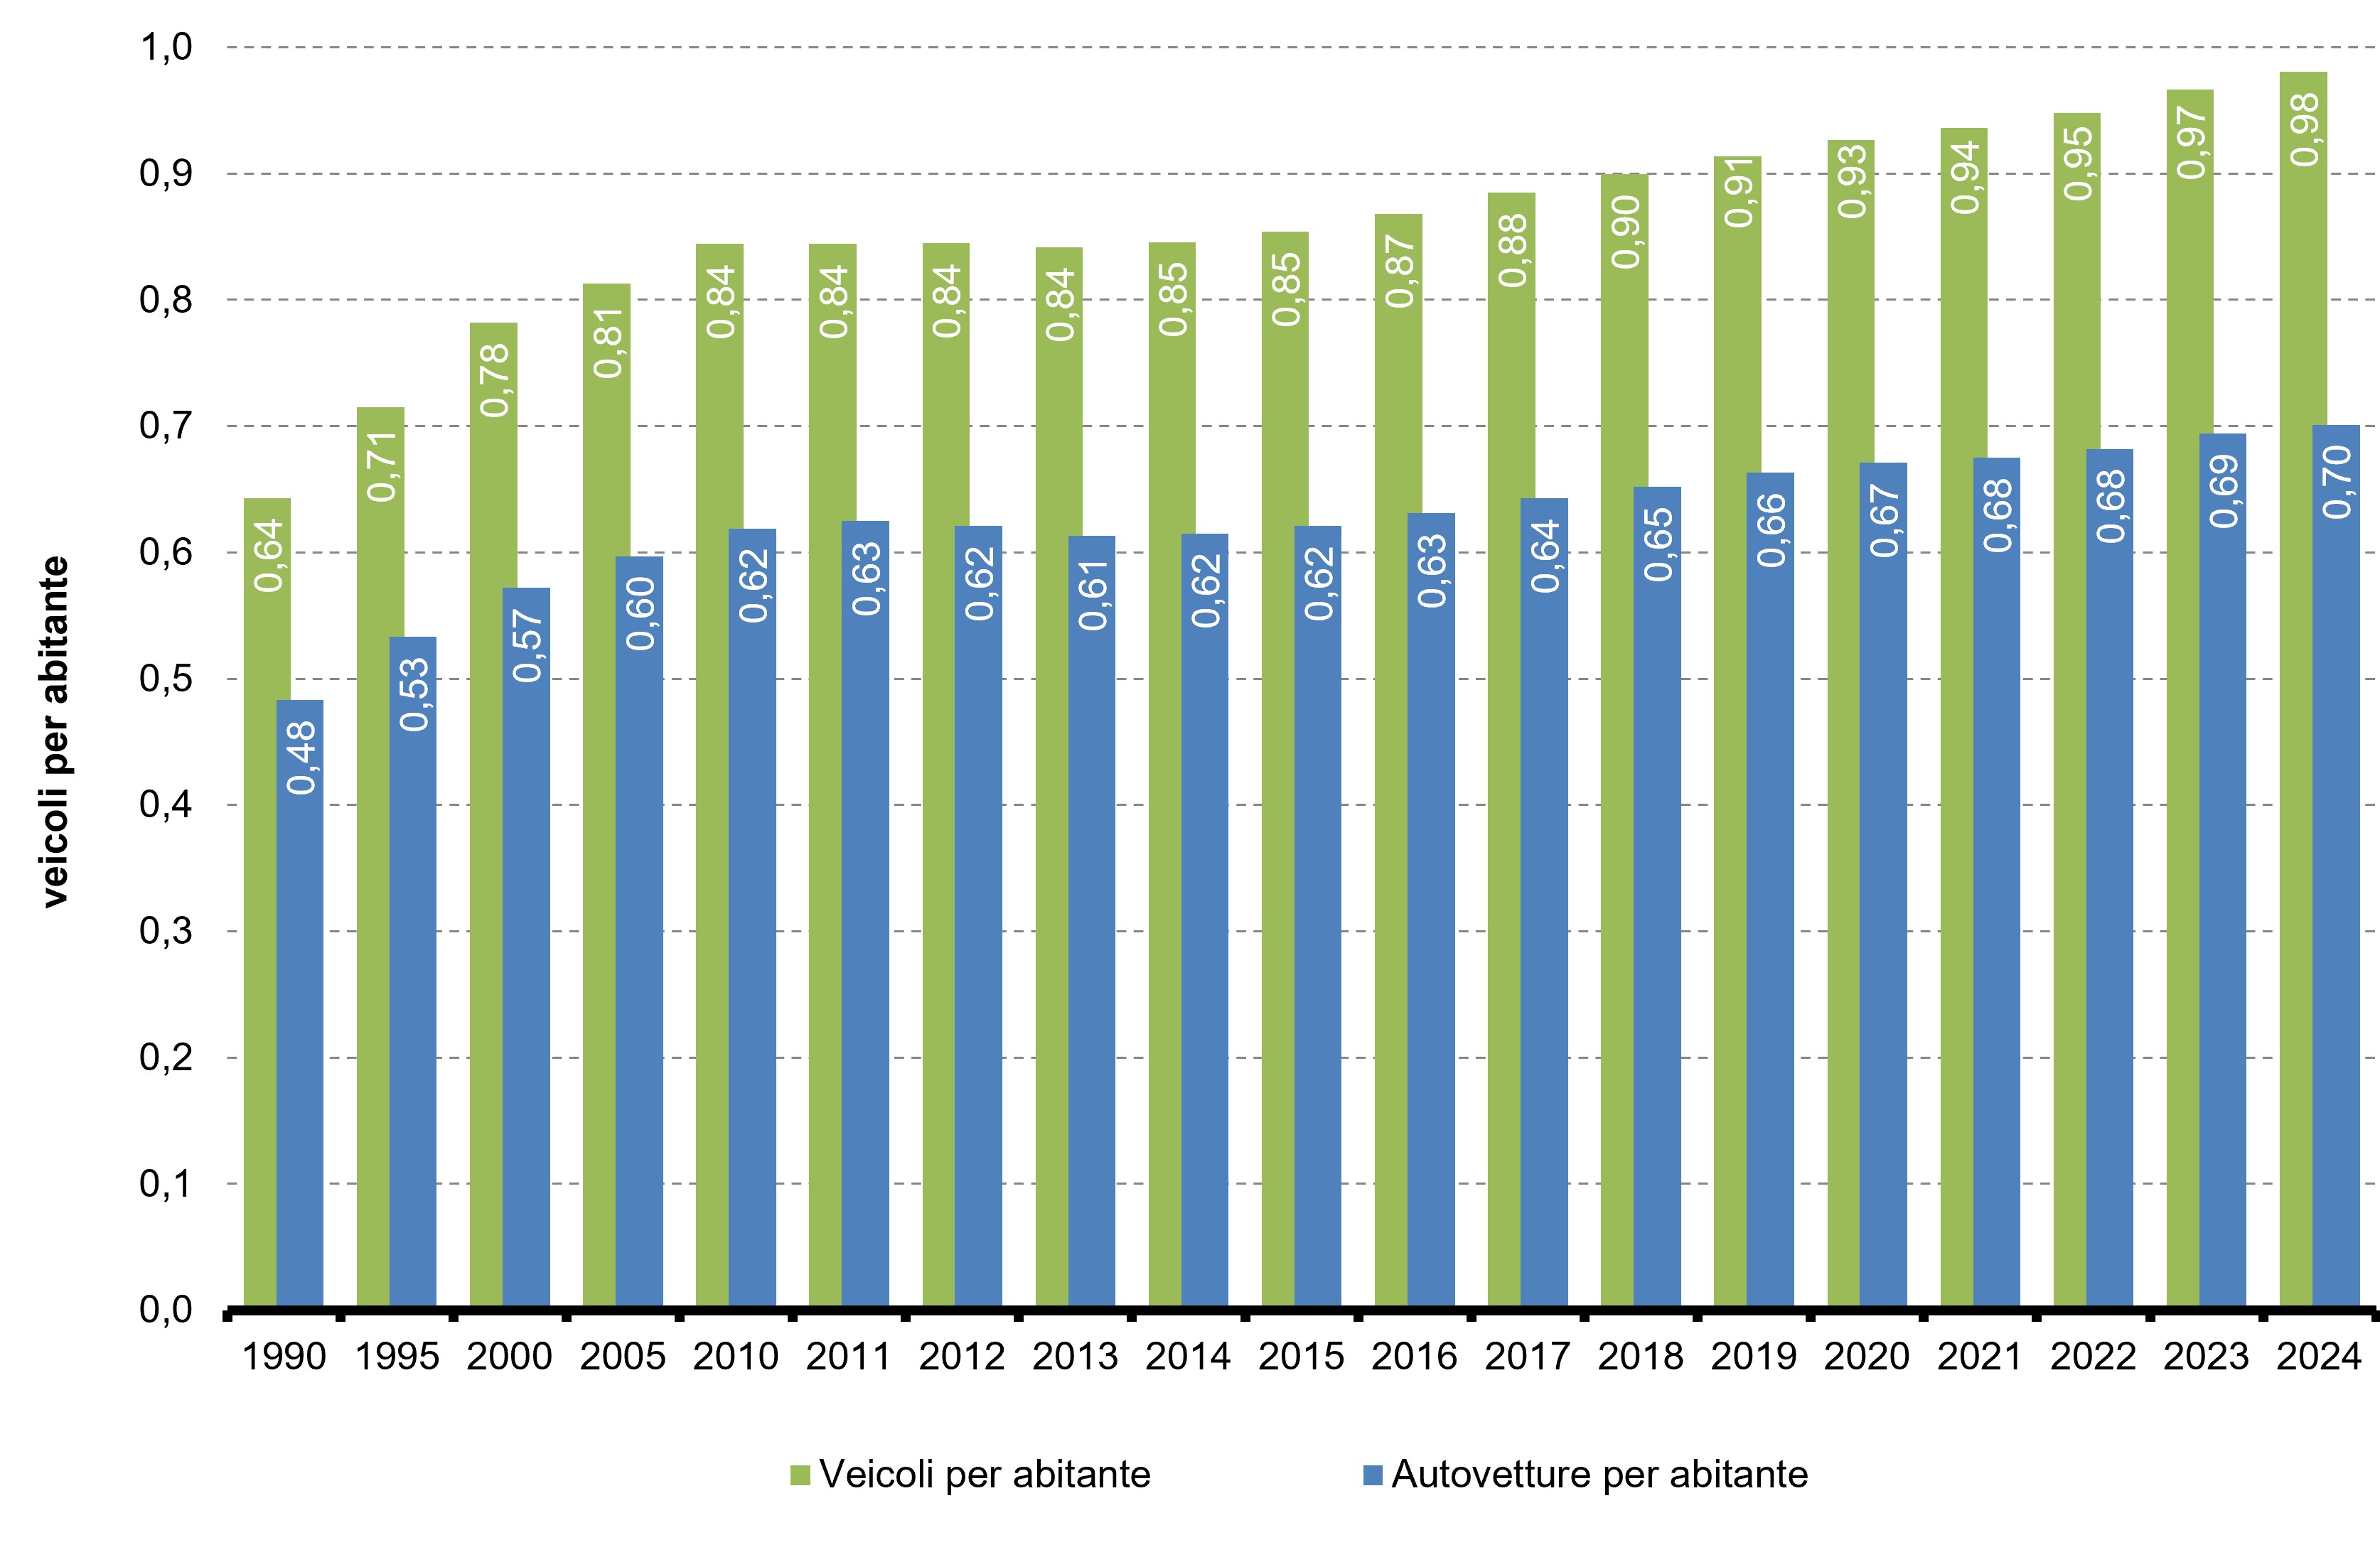
The data for 2024 documents an overall vehicle fleet that has reached 57,788,459 units (Table 1). Within this scenario, the car sector confirms itself as the clearly majority component of the market, representing 72.0% of the entire fleet in circulation. This impressive concentration of private vehicles translates into an exceptionally high rate of motorisation, equal to 0.980 vehicles for each resident inhabitant, a value which indicates the presence of almost one means of transport for each citizen, including in the calculation also the segments of the population not having the right to drive. If we narrow the focus on cars alone, the Italian figure stands at 701 cars per thousand inhabitants, a proportion that places Italy in first place in the European Union (whose average in 2024 is equal to 577 cars per thousand inhabitants), surpassed only by Liechtenstein (which is not a member of the EU) with 767 cars and significantly distanced from the averages of large continental economies such as Germany (590), France (577) and Spain (543) (Table 2).
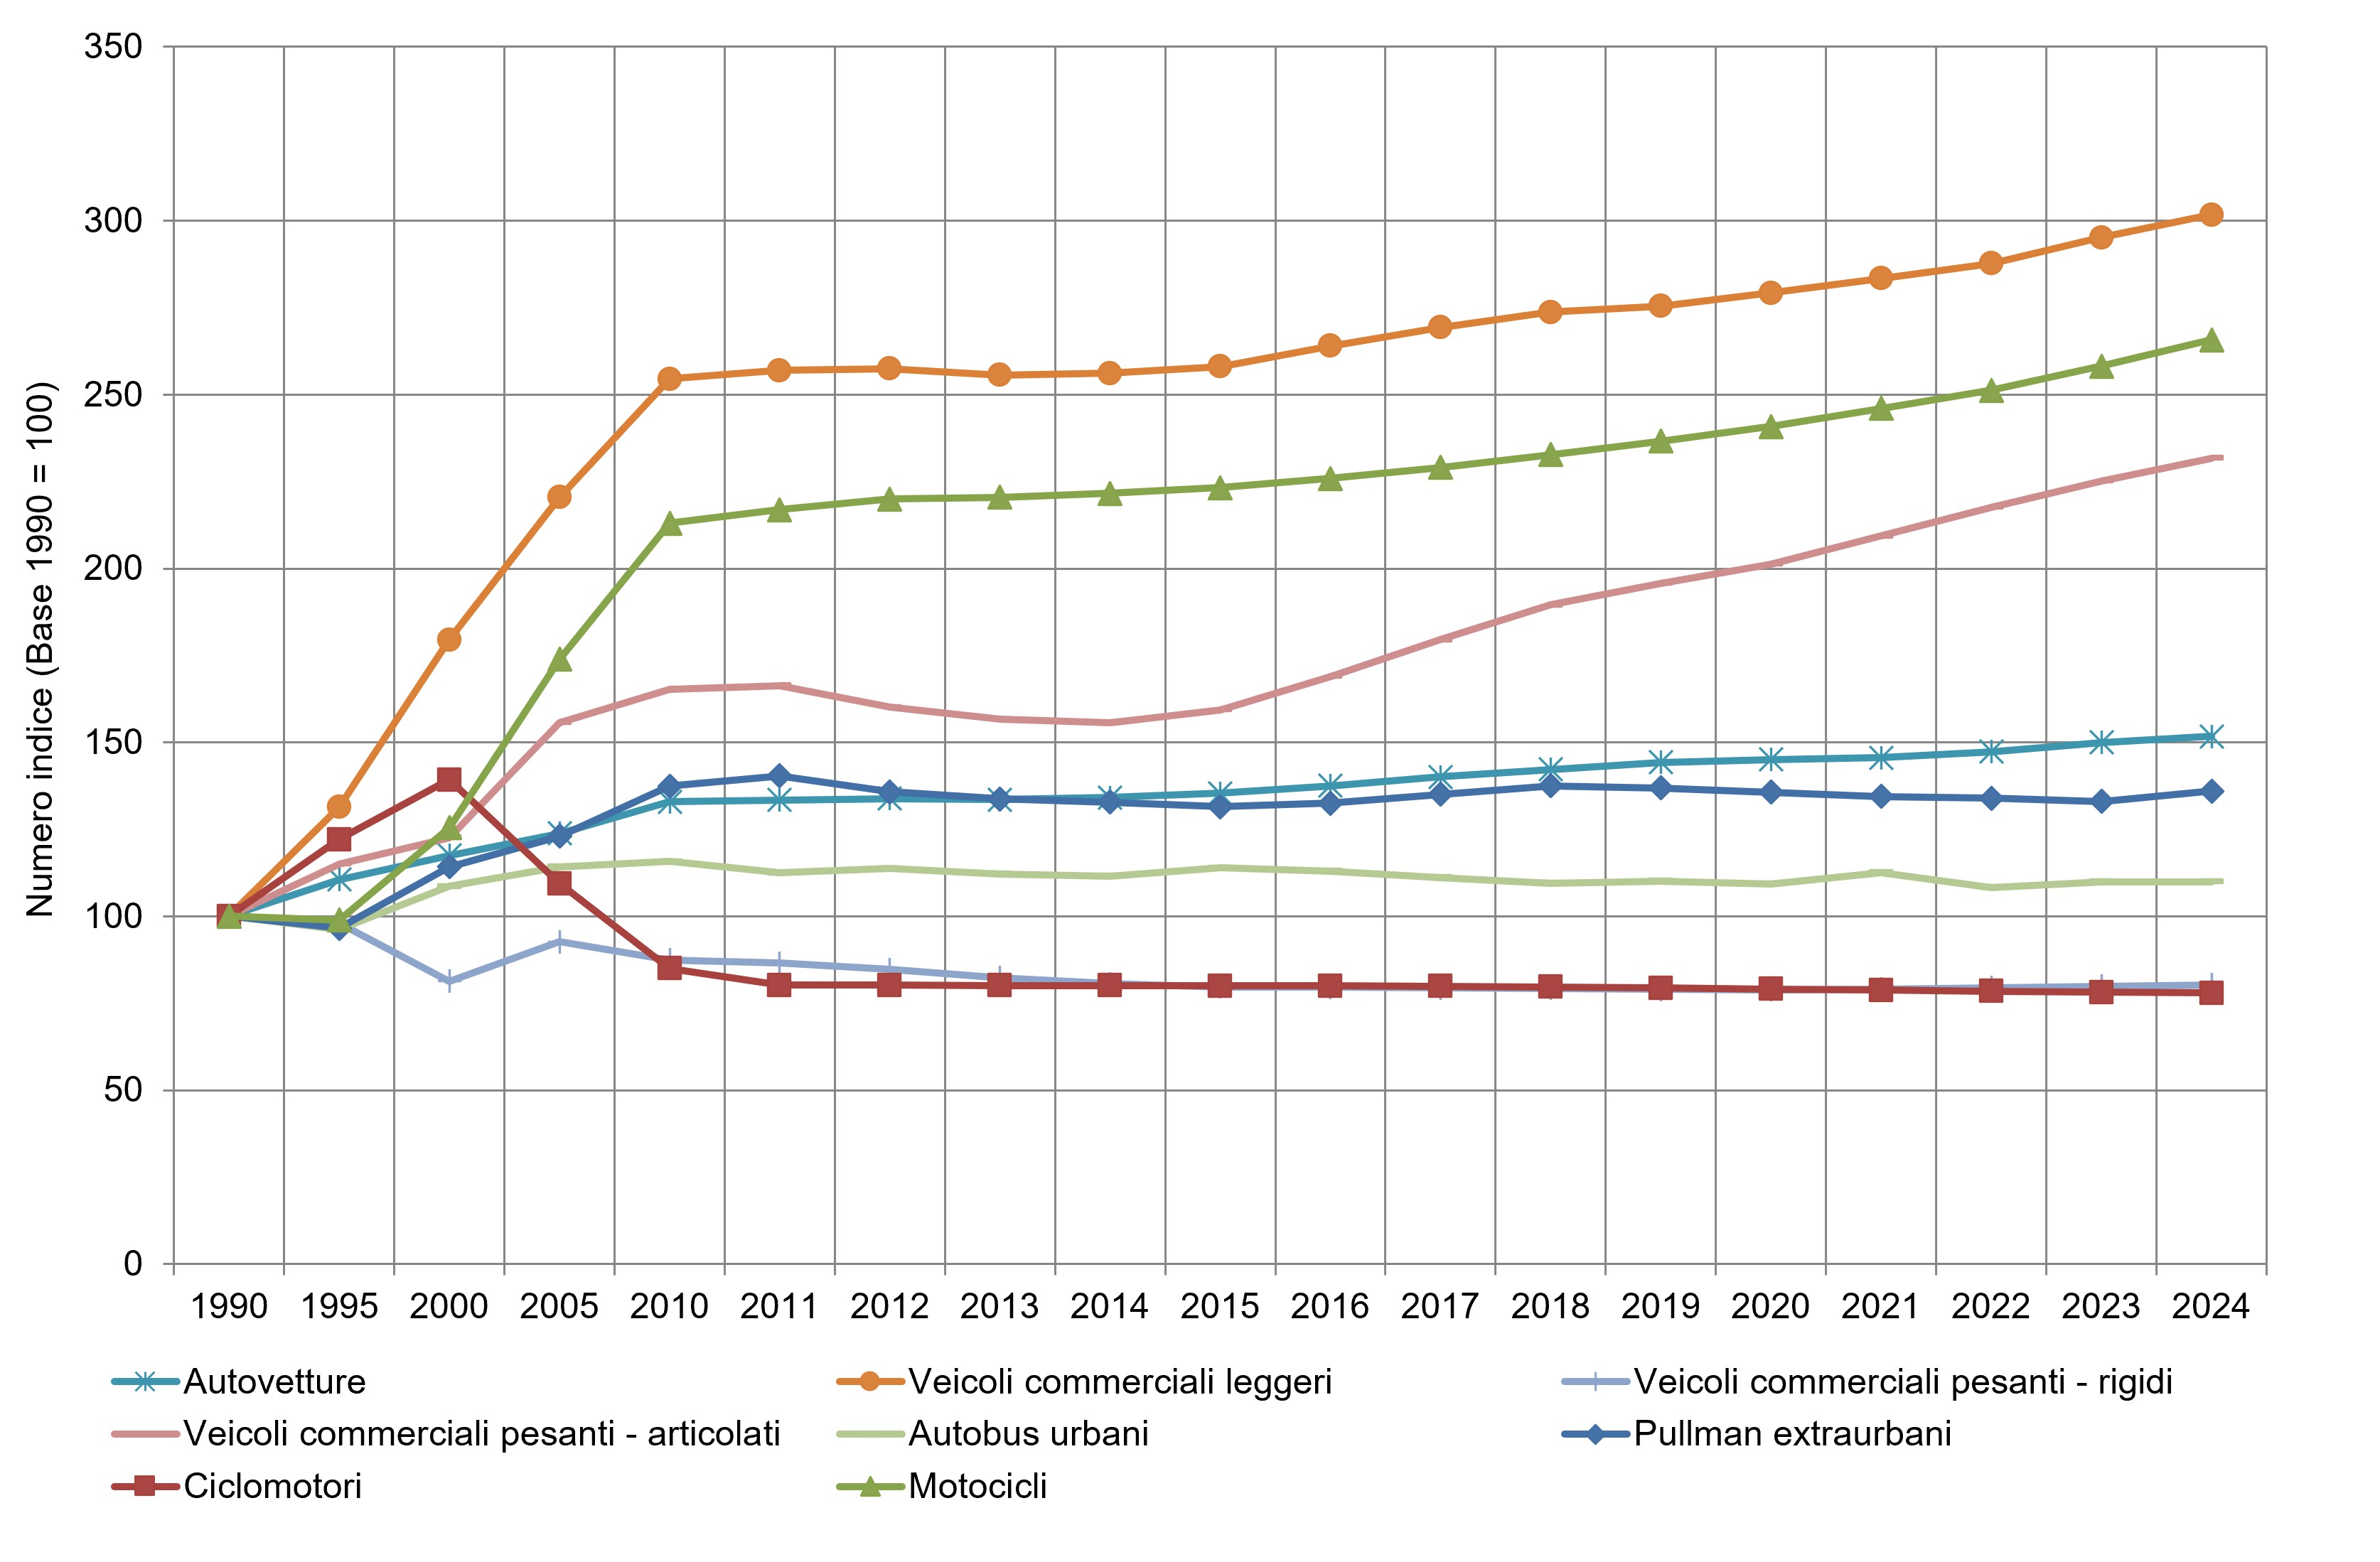
From 1990 to 2024, the overall volume of vehicles went from 36,515,793 to 57,788,459 units, recording a net increase of 58.3%. This expansion was driven primarily by the growth of the private automotive market, which saw passenger cars increase by 51.8%. The fleet of light commercial vehicles is also characterized by strong growth in the reference period. In the two-wheel sector, however, there is a change in consumption and lifestyles, characterized by the progressive decline of mopeds, to the benefit of larger-displacement motorcycles. On the contrary, the segments dedicated to collective transport and heavy logistics show signs of stagnation or structural reorganization (Table 1 and Figure 1).
A negative evaluation is therefore attributed to the trend, characterized by a shortage at an intermodal level and by the negative externalities typical of a high size of the fleet compared to the resident population, such as congestion, accidents, pollution.
| Data |
|---|
Thumbnail
Headline
Figure 1: Size of the road vehicle fleet by category and density relative to the population Data source
ISPRA analysis based on data from: ACI, ANCMA, the Ministry of Infrastructure and Transport (vehicle fleet) and ISTAT (resident population). |
Thumbnail
Headline
Figure 2: Trends in traffic volumes for passenger cars and for motor vehicles as a whole Data source
ISPRA analysis based on data from: ACI, ANCMA, Eurostat, ISTAT and the Ministry of Infrastructure and Transport. |
Headline
Table 1: Size of the road vehicle fleet by category and density relative to the population Data source
ISPRA analysis based on data from: ACI, ANCMA, the Ministry of Infrastructure and Transport (vehicle fleet) and ISTAT (resident population). |
Headline
Table 2: Number of passenger cars per thousand inhabitants, by country Data source
Eurostat |
The greater density and use of vehicles leads to a more than proportional increase in the average costs incurred by the population for travel and a notable increase in the main negative externalities linked to road transport: pollution, congestion and accidents. The reasons behind such a high motorization rate lie in a combination of structural, urban and cultural factors. The chronic lack of investment in strengthening public transport has often made the car an almost obligatory choice for extra-urban and peripheral connections. Added to this is the evolution of settlement models, characterized by growing urban fragmentation which has distanced residential centers from places of employment and study, accentuating the need for autonomous and flexible travel. From a socio-cultural point of view, the ownership of a private vehicle retains a strong central role in Italy, favoring the spread of multi-vehicle family units in which each adult member has their own vehicle. Finally, the exceptional boost given to the light commercial vehicle segment in the last decade finds a direct explanation in the changes in the digital economy, where the explosion of e-commerce and last mile logistics has imposed a widespread diffusion of vans used for rapid deliveries in urban contexts. In large urban areas, two-wheeled vehicles have spread considerably and are used for personal mobility, given the difficulties of using the car due to congestion and parking difficulties in central areas, and the often lack of valid alternatives in public transport.