Antonella Bernetti, Gianluca Iarocci
The indicator delves into the percentage distribution of the vehicle fleet circulating in Italy based on European emission standards (Euro classes) updated to 2024, highlighting the level of technological obsolescence and the environmental impact of the different categories of road vehicles. It constitutes a fundamental tool for evaluating the effectiveness of fleet renewal policies and for calculating the national inventory of climate-altering and polluting emissions into the atmosphere. In 2024, for Euro 0 cars there is a 13.4% share of petrol vehicles and 2.9% of diesel cars. More worrying is the situation of the commercial fleet, largely with diesel engines, where 10% of light vehicles (vans) and 24.9% of heavy vehicles remain in the Euro 0 class.
The penetration of cleaner technologies and zero or low emission vehicles varies significantly depending on the type of engine and intended use of the vehicle. While on the one hand the latest generation electrified and hybrid fuel systems show a strong concentration in the most advanced emission standards, at the same time there remains a non-negligible share of historic or traditionally fueled vehicles (especially petrol) belonging to the most obsolete environmental classes, such as Euro 0. This phenomenon highlights the persistence of an older fleet segment which slows down the overall process of decarbonisation of transport.
The indicator measures how much of the vehicle fleet complies with the latest, and most stringent, emissions standards for new vehicles. Emissions of harmful substances in this sector are largely linked to the combustion methods of fossil energy sources; the use of appropriate technologies reduces them to a considerable extent.
Monitor the share of the vehicle fleet that complies with the latest emissions standards for new vehicles.
The main regulatory references associated with this indicator are developed on a European and national scale. At community level, the key reference is made up of the Regulations on the approvals of road vehicles (known as Euro Standards, from the Euro 1 Regulation up to the recent debate on Euro 7), which set the legal limits for emissions of particulate matter and nitrogen oxides for manufacturers. These are accompanied by EU Directive 2016/2284 (NEC Directive), which imposes strict deadlines for the reduction of national air pollutants, and EU Regulation 2019/631 within the Fit for 55 package, which outlines the route towards total decarbonisation by placing the constraint of zero emissions for new registrations by 2035. On a national level, the indicator is directly linked to the Plan for the Ecological Transition (PTE), which implements the European objectives by defining the Italian targets for the modal shift and the renewal of the car fleet, and to the provisions of the Highway Code (Legislative Decree 285/1992), which grants Municipalities the right to limit circulation in urban areas (through the establishment of Limited Traffic Zones and Sunday or emergency traffic blocks) based precisely on the Euro classes to which the vehicles belong to safeguard quality of the local air.
ISPRA, National inventory of atmospheric emissions, various years, https://emissioni. sina. isprambiente. it/economia-nazionale/
ISPRA, Italian Emission Inventory 1990 – 2024, Informative Inventory Report 2026, Higher Institute for Environmental Protection and Research, ISPRA, Reports 426/2026, https://emissioni. sina. isprambiente. it/informative-inventory-report/
ISPRA, Italian Greenhouse Gas Inventory 1990-2024, National Inventory Document 2026, Higher Institute for Environmental Protection and Research, ISPRA, Reports, 428/26, https://emissioni. sina. isprambiente. it/national-inventory-document/
-
-
ACI (Automobile Club of Italy)
MIT (Ministry of Infrastructure and Transport)
ACI (https://www. aci. it/laci/studi-e-ricerche/dati-e-statistiche/open-data. html)
MIT (https://www. mit. gov. it/)
National, Regional
2005 - 2024
The percentages of the circulating fleet meeting certain emission standards are obtained on the basis of data sourced from the Ministry of Infrastructure and Transport. These data, used for the purposes of drawing up the national inventory of atmospheric emissions, relate to the size of the national fleet in circulation in the year under study, in detail of the type of vehicle, fuel, class of engine capacity or weight and Euro standard.
In Italy, the adaptation of the vehicle fleet to environmental standards for new vehicles is proceeding at a physiological pace of fleet replacement. In 2024, Euro 0 petrol cars are equal to 13.4%, while the Euro 4 class represents the largest segment with 20.7%, followed by the more recent Euro 6 a/b/c at 13.4% and Euro 6 d/e at 10.8%. On the contrary, petrol hybrid cars benefit from an almost totally unbalanced diffusion towards the most modern technologies, with as many as 79.9% of vehicles compliant with the Euro 6 d/e standard and 11.5% with the Euro 6 d-temp standard (Table 1). A similar dynamic is observed for diesel cars, where the intermediate classes Euro 4, Euro 5 and Euro 6 a/b/c record 23.5%, 22.2% and 21% respectively, leaving the Euro 6 d/e with a share of 7.4%; the diesel hybrid versions, however, are 85.6% in the Euro 6 d/e class (Table 1). As regards alternative fuel systems, LPG and natural gas cars show the greatest concentration in the Euro 4 class (26.1% and 29.5% respectively), while 83.7% of fully electric cars are included in the Euro 6 d/e standard, demonstrating their recent introduction onto the market.
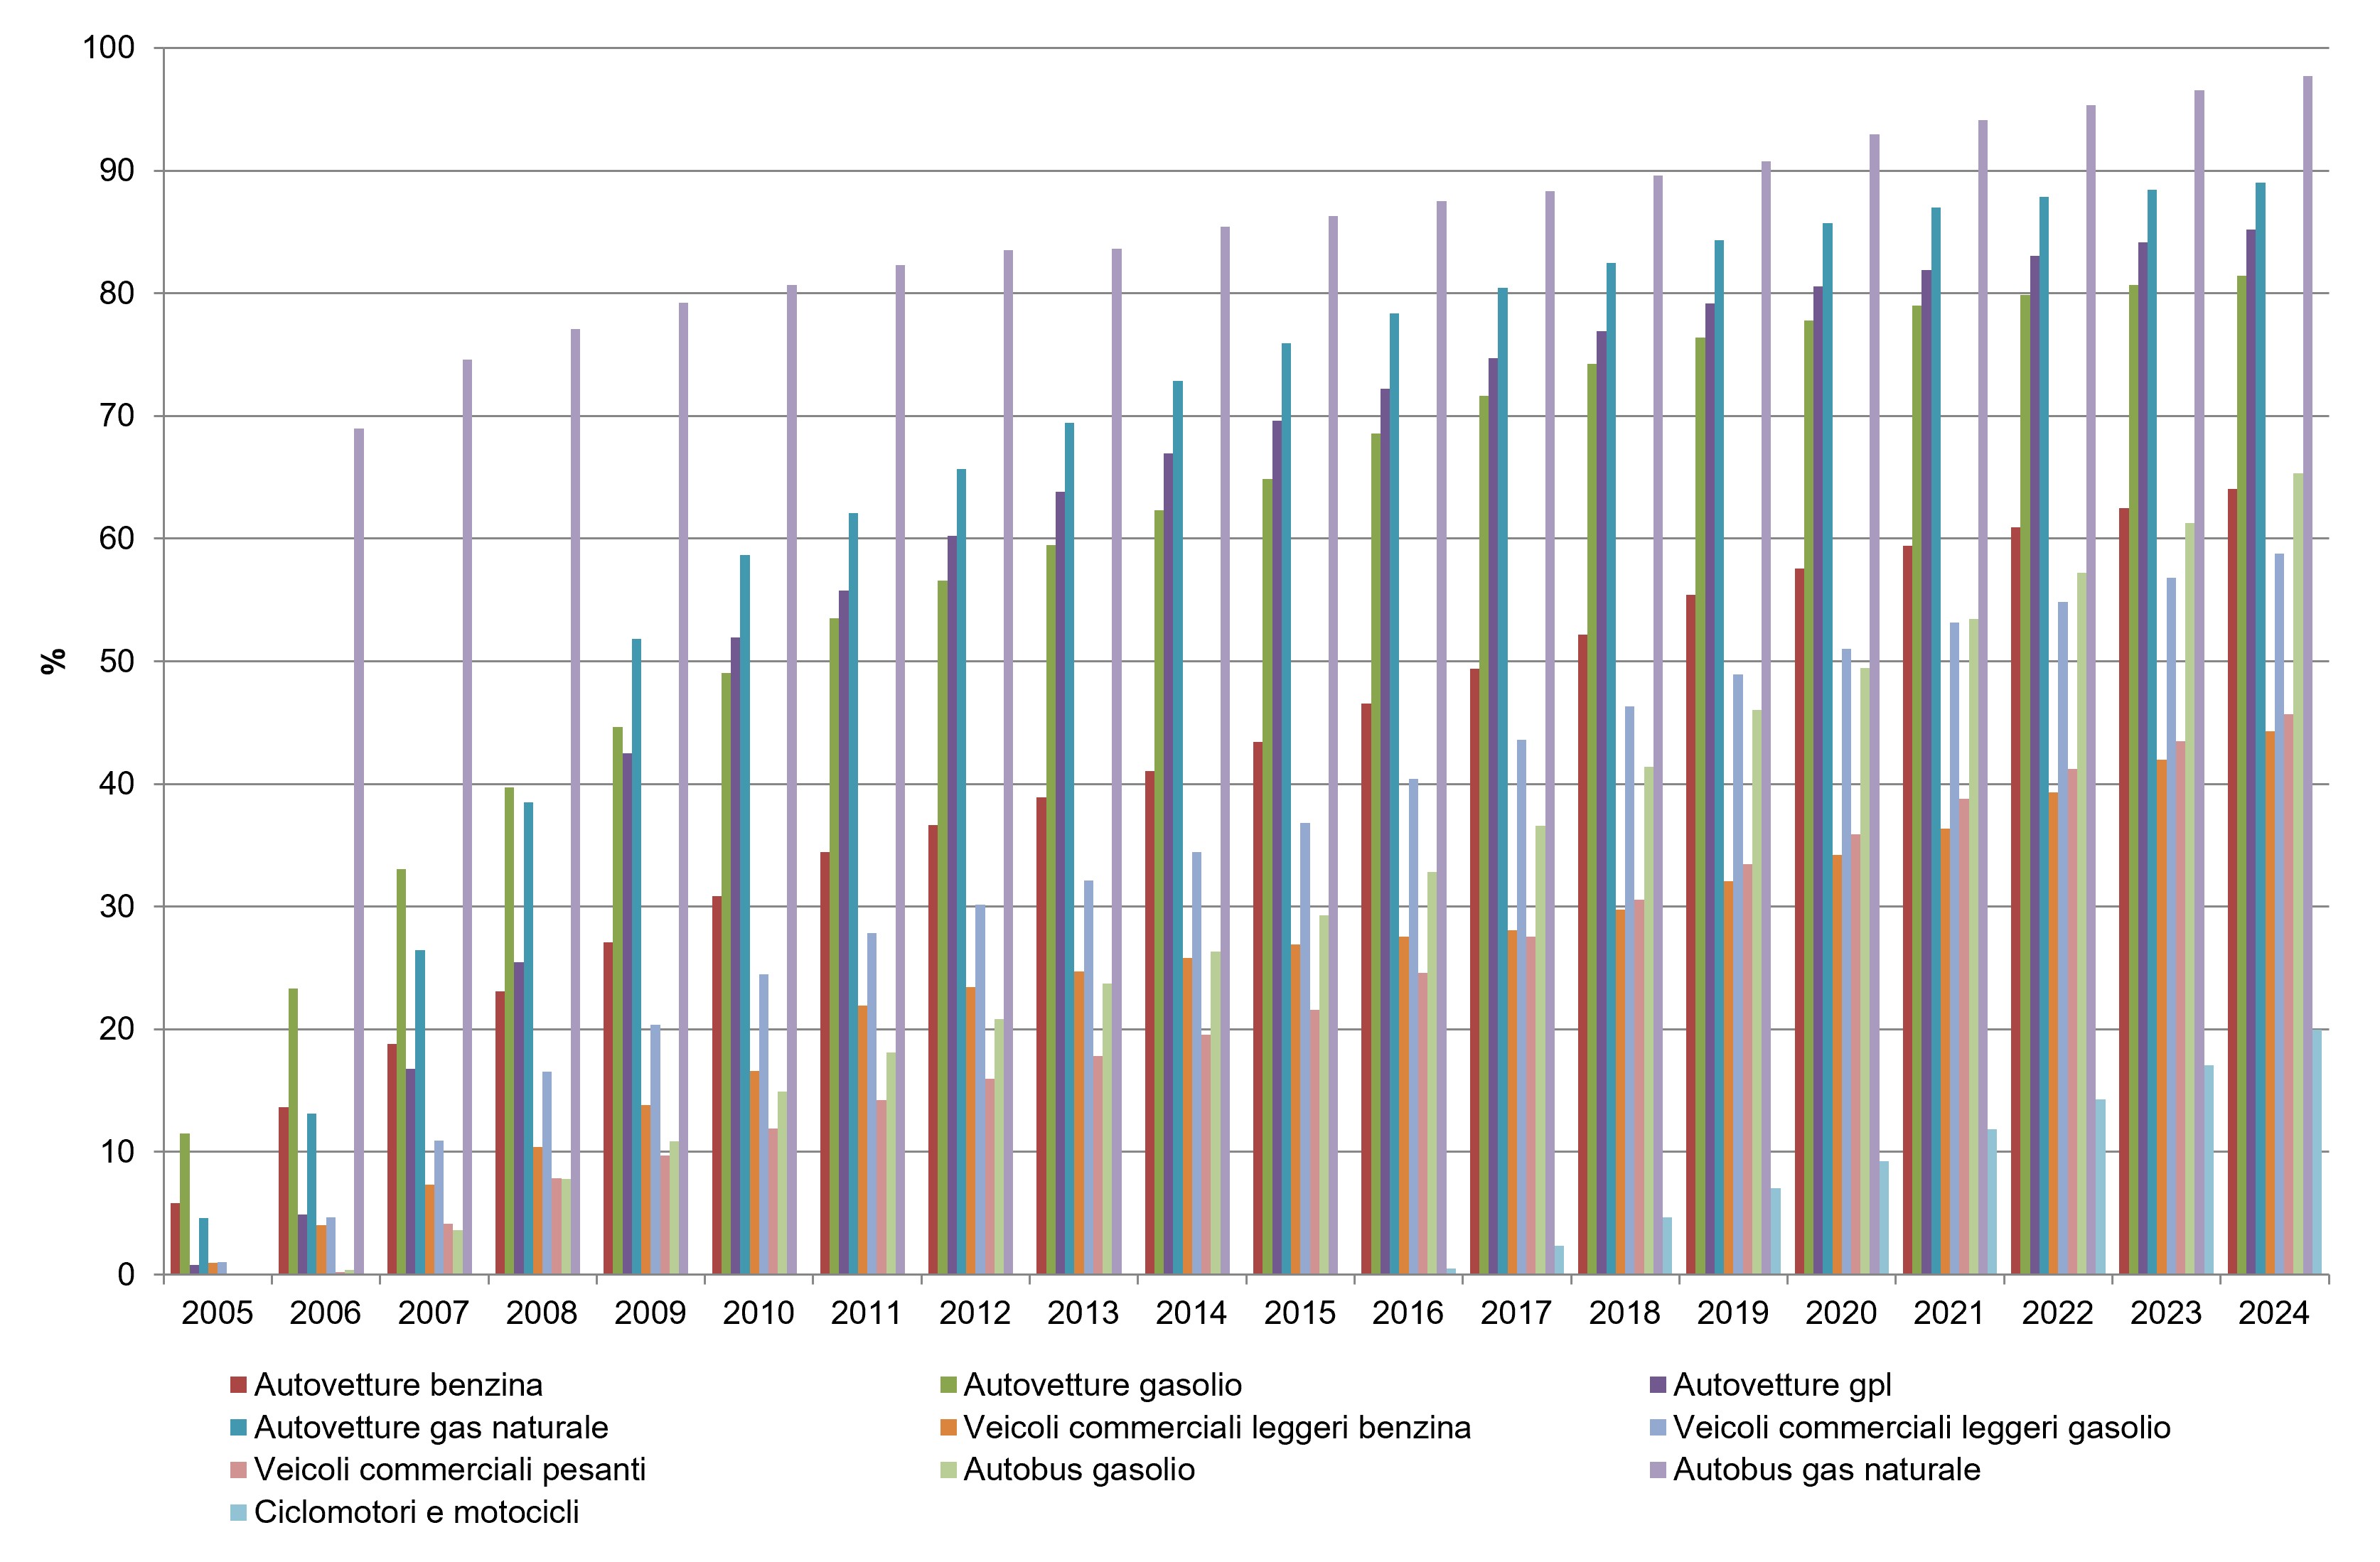
In the commercial and heavy vehicle sector, the dynamics reflect the different needs of logistics and collective transport. Light petrol vans record a high rate of obsolescence, with 18.4% of Euro 0 vehicles and 14.8% of Euro 2, while diesel versions - which constitute the backbone of light goods transport - are mainly concentrated between Euro 4 (16.1%) and Euro 5 (12%), reaching 14.4% in the Euro 6 d/e class (Table 1). Electric light commercial vehicles are 76.7% compliant with the Euro 6 d/e standard. Moving on to heavy commercial vehicles, a strong polarization emerges: 24.9% still belong to the Euro 0 class, a symptom of a partly dated fleet, but 19.4% have already reached the Euro VI D/E class. For commercial vehicles, only with the Euro IV class are there significant reductions in nitrogen oxide and particulate emissions. It should also be noted that, in the case of heavy commercial vehicles, road tests of Euro V vehicles did not show the expected reductions in nitrogen oxide and particulate emissions; more marked reductions were subsequently found for Euro VI. Among diesel buses, the most significant share is represented by the Euro VI D/E with 22.5%, followed by the Euro V at 20% and the Euro III at 17.5%. Technological excellence is found in diesel hybrid buses (97.3% in Euro VI D/E) and in electric ones (85.7% in Euro VI D/E), driven by the recent renewals of urban public fleets. Finally, the two-wheel sector (petrol mopeds and motorcycles) shows a more homogeneous distribution between the old and new approvals, with 25.6% of Euro 0 vehicles, 19.6% of Euro 3 and only 11.5% compliant with the Euro 5 standard (Table 1). In 2024, the share of the fleet compliant with Euro 4 standards or higher of petrol cars is 64.1%, diesel 81.4%, LPG cars 85.2%, natural gas cars 89%, petrol light commercial vehicles 44.3% and diesel 58.7%; in 2024 the share of the fleet compliant with Euro IV standards or higher of heavy commercial vehicles is 45.7%, of diesel buses 65.3%, of natural gas buses 97.7%, of mopeds and motorcycles 19.8%. The hybrid categories, which still represent a minority share in the fleet, comply with the most recent Euro standards (Figure 1).
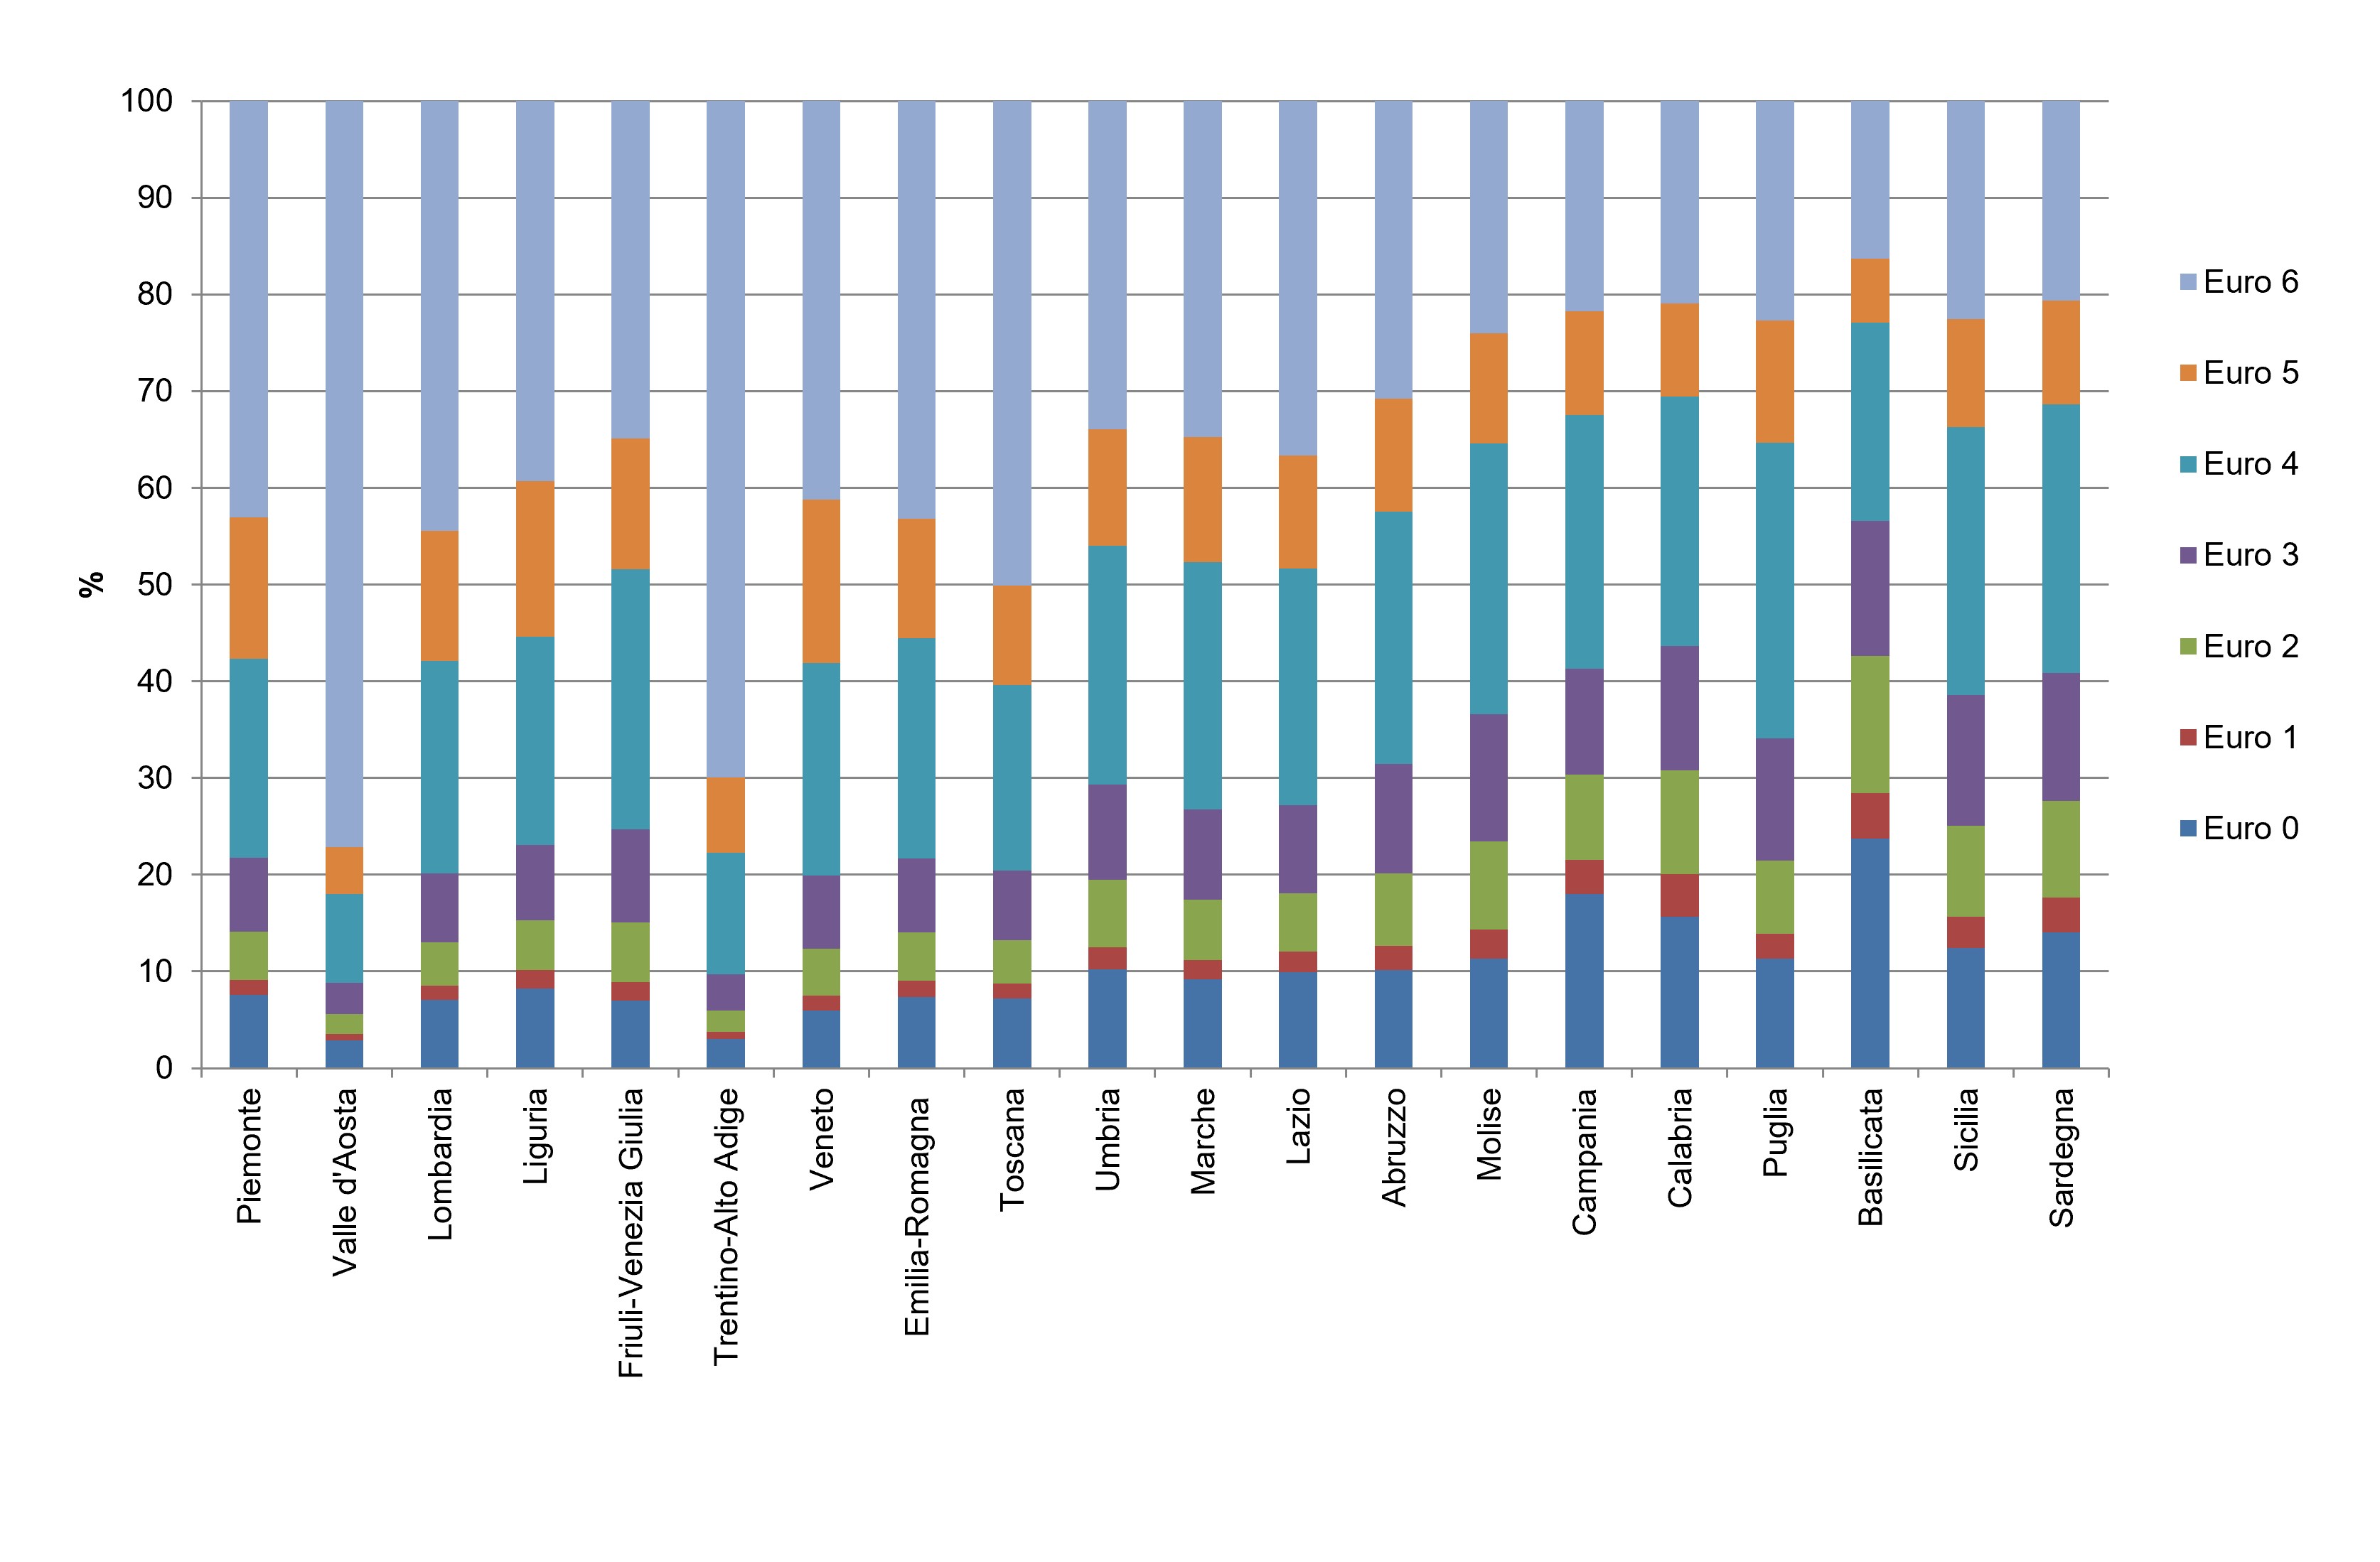
In 2024, cars in the regions of Basilicata, Sicily, Calabria, Campania, Puglia and Molise are still characterized by a presence of Euro 0 type vehicles equal to or greater than 10%. Furthermore, in Sicily, Calabria and Campania "old generation" vehicles (up to and including the Euro 2 standard) still make up more than 25% of the fleet. Conversely, in the regions of Veneto, Emilia-Romagna, Lombardy, Tuscany, Trentino Alto-Adige and Valle d'Aosta, the development of motorization is characterized by vehicles compliant with the most recent emission standards (Euro 4 - 6) for over 80% of the fleet (Figure 2).
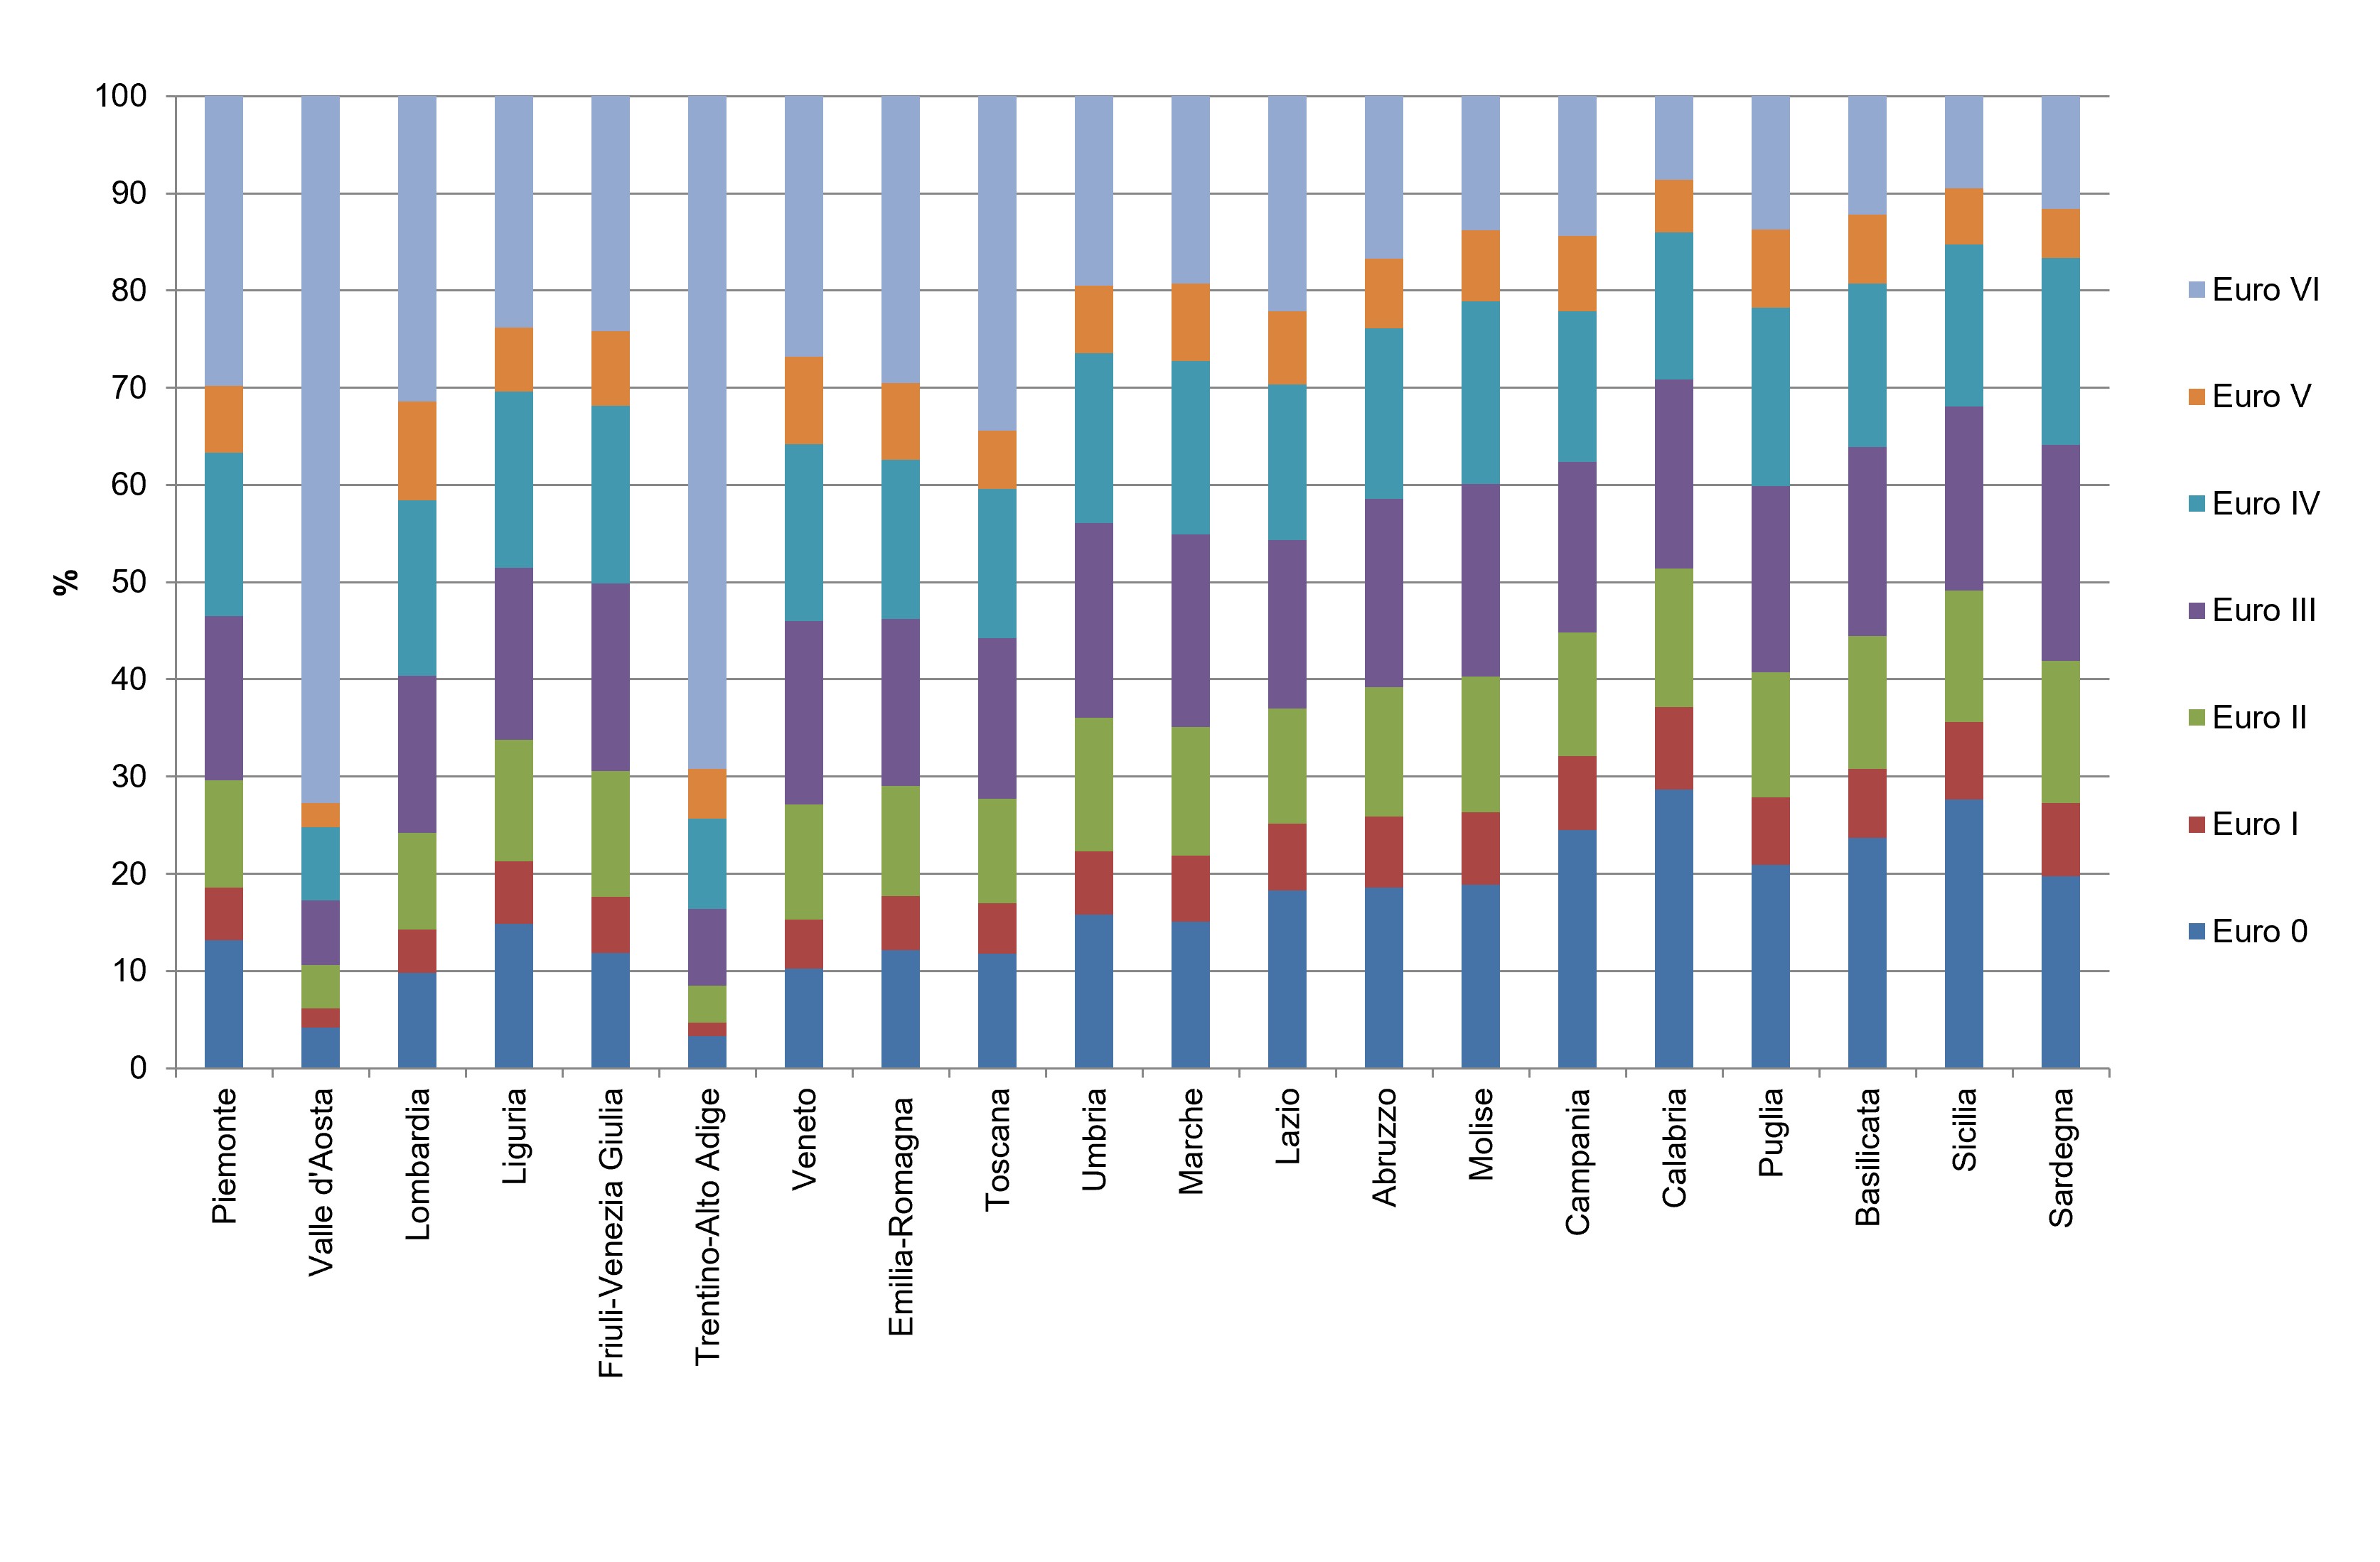
Also in 2024, the analysis of industrial vehicles, including light and heavy vehicles and road tractors, shows a more modern vehicle fleet (Euro IV - VI) in Piedmont, Emilia-Romagna, Veneto, Tuscany, Lombardy, Trentino-Alto Adige, and Valle d'Aosta (Figure 3).
Examining the evolution of the fleet on the basis of compliance with the Euro 4, Euro 5 and Euro 6 standards in the twenty years between 2005 and 2024, a constant and profound ecological transition is highlighted, characterized however by highly asymmetric speeds between the different sectors and the different fuels.
The start of the process in 2005 showed a scenario in which almost all vehicles on the road belonged to highly polluting categories, lower than Euro 4. In this initial context, diesel cars led the first real wave of renewal, doubling their share of compliance in just twelve months, going from 11.5% in 2005 to 23.3% in 2006. This rapid progression allowed diesel cars to exceed half of their fleet already in 2011 with 53.5%, before stabilizing in more recent years and closing 2024 at 81.4%. On the contrary, petrol cars have experienced a much more gradual and hesitant transformation: starting from a modest 5.9% in 2005, they crossed the 50% threshold only between 2017 and 2018, reaching a share of 64.1% in 2024. This gap of more than 17 percentage points compared to diesel reflects the remaining on the market of a large pool of older, low-mileage petrol second cars that are slower to replace (Figure 1).
The gaseous fuel sector for private use represents the most radical and massive transition phenomenon. LPG cars, which in 2005 recorded an almost non-existent compliant presence of 0.81%, experienced a real boom between 2007 and 2010, making a leap from 16.8% to 51.9% in just three years, and then reaching 85.2% in 2024. A similar trajectory, albeit with a higher starting point, was followed by LPG cars. Methane, which rose from 4.6% in 2005 to 51.8% in 2009, reaching the saturation rate of 89% at the end of the period considered (Figure 1).
Shifting our gaze to the transport of goods and work vehicles, the numerical analysis highlights strong resistance to change, probably linked to the depreciation costs of capital goods. Petrol and diesel light commercial vehicles both started from minimum shares close to 1% in 2005. Twenty years later, diesel vans have managed to reach 58.8%, while petrol vans stop at 44.3%, leaving over half of the fleet in circulation under the Euro 4 standards. The situation becomes even more critical for heavy commercial vehicles: trucks remained effectively immobile until 2006 (0.2%) and, despite regular growth in the last decade, they will close 2024 with just 45.7% of compliant vehicles (Figure 1).
The local public bus transport sector, on the other hand, offers a two-sided picture. On the one hand, the diesel bus fleet has followed a progressive but late renewal dynamic, going from the initial zero in 2005 to 26.3% in 2014, and then accelerating in the last five years up to 65.3% in 2024. On the other hand, natural gas buses are confirmed as the absolute excellence of the entire indicator: already in 2006 they had a compliant share of 69%, which has increased to 80.7% in 2010 and reached almost total ecological conversion in 2024 with 97.7% of the fleet (Figure 1).
Finally, the category of mopeds and motorcycles has only recently entered the picture, with the first significant findings starting from 0.5% in 2016. Although it is the segment with the lowest absolute value in 2024, stuck at 20%, the trajectory highlights a marked acceleration in the last four years, a period in which the percentage more than doubled compared to the 9.3% recorded in 2020 (Figure 1).
| Data |
|---|
Headline
Tabella 1: Ripartizione dei veicoli circolanti secondo la categoria e lo standard Euro (2024) Data source
Elaborazione ISPRA su dati del Ministero delle Infrastrutture e dei Trasporti. |
Thumbnail
Headline
Figura 1: Percentuali del parco circolante conformi agli standard Euro 4 o superiori Data source
Elaborazione ISPRA su: dati ACI, ANCMA, Ministero delle Infrastrutture e dei Trasporti |
Thumbnail
Headline
Figura 2: Composizione percentuale del parco autovetture per regione e per tecnologia (2024) Data source
Elaborazione ISPRA su dati ACI |
Thumbnail
Headline
Figura 3: Composizione percentuale del parco veicoli industriali per regione e per tecnologia (2024) Data source
Elaborazione ISPRA su dati ACI |
The reasons behind this scenario combine economic, structural and planning factors. The high rate of motorization and the use of private cars are fueled by the historical lack of competitive alternatives in local public transport and by fragmented urban planning models that distance residences from jobs. The composition of the fleet by Euro class instead responds to economic dynamics: the initially high cost of new electric or hybrid technologies and the reduced spending capacity of families and small businesses create an economic barrier, prolonging the useful life of old traditional combustion engines and obsolete light and heavy commercial vehicles. The diffusion of newer vehicles is not homogeneous at a national level. On the contrary, the strong acceleration towards the more virtuous Euro classes is strongly stimulated by public policies, such as the extraordinary financing plans for the green renewal of urban bus fleets, the national campaigns of state incentives conditioned on scrapping and local traffic restrictions (environmental ZTL) which push citizens residing in large agglomerations to replace the most polluting vehicles.
The identification of the "Euro" class to which a vehicle belongs refers to very different periods of applicability depending on the type of vehicle. Furthermore, the type of vehicle determines a high variability both in emissions per kilometer travelled, and in the percentage of reduction of regulated emissions (carbon monoxide, nitrogen oxides, volatile organic compounds and particulate matter) which increases when moving to the more advanced "Euro" classes. However, the emissions of the different types of vehicles are not directly comparable with each other; in particular, heavy vehicles have higher emissions per kilometer traveled than cars/light commercial vehicles. However, the distinction by Euro class provides a concise overall picture that allows us to appreciate the diffusion of less polluting vehicles in the circulating fleet.