Roberto Daffinà, Giovanni Finocchiaro
The indicator evaluates the extent and evolution of Italian families' spending on transport, analyzing whether this item has a fixed or variable impact on the overall family budget. In 2024, the average monthly expenditure on transport stood at 297.22 euros. Comparing this data with 2015, two different weights can be seen depending on the prices considered: at current prices there is a decrease of around 12%, while at constant prices an increase of 10%. The evolution of spending in the last decade clearly shows the impact of socioeconomic events: in the period 2015-2018 there was a phase of constant growth, with an increase of 10%. In 2019 there was a first sign of a reversal of the trend, with a slight reduction, followed the following year by the vertical collapse of mobility and a 25% contraction in spending. In the last period (2021-24) there is a progressive recovery, even if the full return to pre-pandemic levels was only achieved in 2024. The negative peak of 2020 spared very few sectors: all expenditure items suffered a contraction, with the exception of food products, which remained constant during the pandemic and grew progressively in the following years. In the budget of Italian families, transport spending is consolidated as the second most important cost item. However, spending on housing and utilities remains firmly in first place, the economic value of which exceeds that for mobility by more than three times.
The indicator considers family spending on transport, the share of which reflects changes in income and therefore in lifestyle, net of changes in prices. The determination of transport prices constitutes, in fact, an important tool for regulating the related demand.
Assess the extent and methods of household expenditure on transport, and whether a fixed or variable portion of one's budget is spent in this sector.
The reason why this economic indicator is "translated" into an environmental key is linked to national and international regulations that measure consumption habits as vectors of pollution. Regulation (EU) No. 691/2011 on European environmental economic accounts: Defines the framework for GDP satellite accounts (such as the physical energy and material flows module). It forces families to cross-reference the monetary expenditure of families on transport with the actual consumption of tonnes of oil equivalent (TOE) and atmospheric emissions. The PNIEC (National Integrated Plan for Energy and Climate): Drawn up in implementation of Regulation (EU) 2018/1999, the PNIEC uses the transport spending indicator to monitor the energy efficiency of the private sector and plan vehicle electrification targets. Definition of "Energy and Transport Poverty" (EU Directive 2023/1791 on Energy Efficiency): European legislation and Italian ministerial implementing decrees use the share of fixed expenditure for transport on the family budget to identify vulnerable population groups (those who spend too high percentages of their income on moving), regulating the provision of incentives and bonuses for public transport or sustainable mobility.
The indicator of personal mobility expenses presents structural limits of distortion if used in a strictly environmental context, since it measures the monetary value and not the physical impact of transport. In fact, spending in currency is often inversely proportional to the ecological impact: the purchase of electric vehicles or high-speed rail passes involves high outlays with low emissions, while the use of obsolete and polluting vehicles is economically economical. Furthermore, fluctuations in fuel prices and inflation alter the financial data regardless of the kilometers travelled, just as active mobility trends (walking and cycling) eliminate spending but represent the maximum sustainability scenario. Finally, the indicator is strongly affected by family income, reflecting economic availability rather than real anthropic pressure on the territory. For correct environmental reporting, it is therefore necessary to integrate or replace monetary data with physical indicators, such as modal split, sectoral energy consumption and monitoring of direct greenhouse gas emissions.
To faithfully capture all the elements of transport spending, the indicator should cover different types of costs, which however in some cases - such as in the case of public transport - are difficult to determine.
Istat, ACI
Istat, Family consumption expenditure report
ACI, Statistical Year Report https://aci. gov. it/attivita-e-progetti/studi-e-ricerche/open-data/
Istat, I. Stat database. https://esploradati. istat. it/databrowser/#/it/dw
National and Regional
2000-2024
The survey on household expenditure; conducted by Istat, uses a two-stage random sampling scheme (municipalities-families) with stratification of first-stage units.
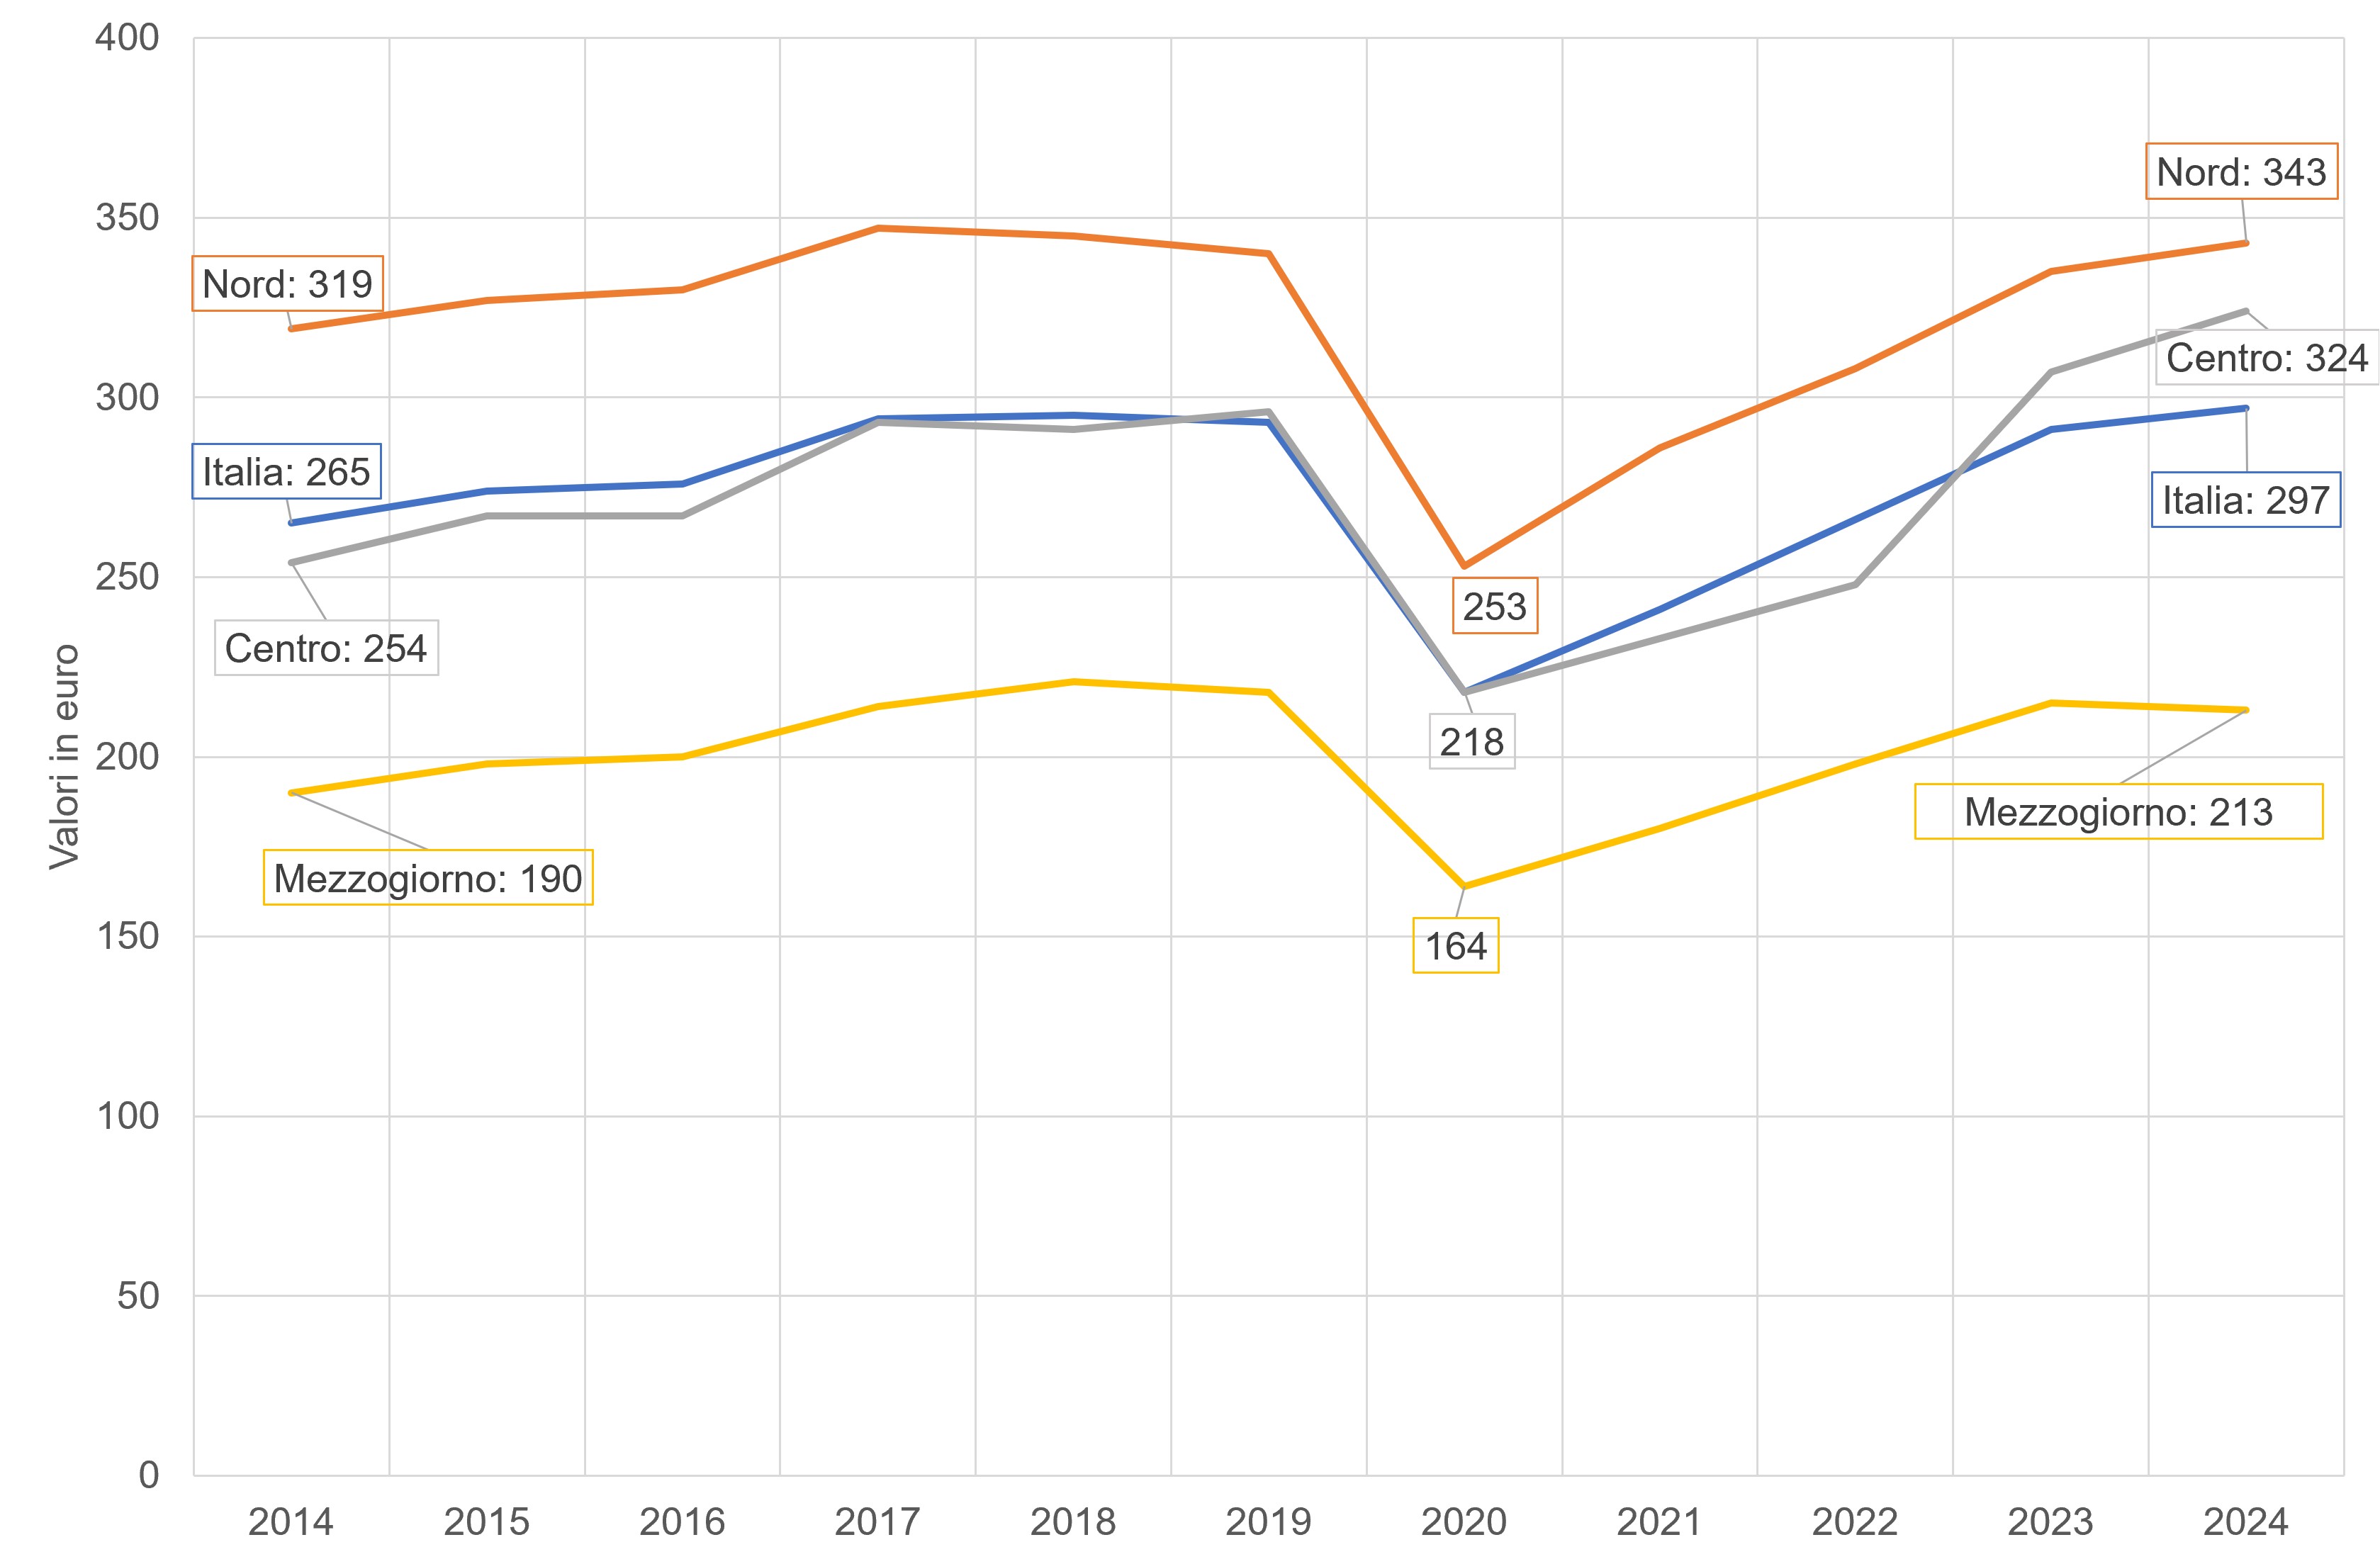
In 2024, the average monthly expenditure of families residing in Italy reached 2,755 euros compared to 2,738 the previous year. Analyzing the basket of goods and services, transport is confirmed as the second largest expenditure item for Italian families, surpassed only by housing costs (equal to 984 euros per month). In detail, the average monthly expenditure for transport is equal to 239.7 euros (in current values), compared to 237.1 euros in 2023 (Table 1). The incidence of this item on the total budget remains stable at 11%, although showing slight territorial asymmetries: in fact, it ranges from a minimum of 10% in the South to a maximum of 12% in the North of the country.
In 2024, the average monthly expenditure on transport stood at 297.22 euros. Comparing this data with 2015, two different weights can be seen depending on the prices considered: at current prices there is a decrease of around 12%, while at constant prices an increase of 10%. The evolution of spending in the last decade clearly shows the impact of socioeconomic events: in the period 2015-2018 there was a phase of constant growth, with an increase of 10%. In 2019 there was a first sign of a reversal of the trend, with a slight reduction, followed the following year by the vertical collapse of mobility and a 25% contraction in spending. In the last period (2021-24) there is a progressive recovery, even if the full return to pre-pandemic levels was only achieved in 2024. The negative peak of 2020 spared very few sectors: all expenditure items suffered a contraction, with the exception of food products, which remained constant during the pandemic and grew progressively in the following years. In the budget of Italian families, transport spending is consolidated as the second most important cost item. However, spending on housing and utilities remains firmly in first place, the economic value of which exceeds that for mobility by more than three times.
| Allegati |
|---|
Thumbnail
Headline
Figura 1: Spesa dei trasporti per macoarea Data source
Elaborazione ISPRA su dati ISTAT |
Thumbnail
Headline
Figura 2: Spese trasporti per condizione professionale Data source
Elaborazione ISPRA su dati ISTAT |
Headline
Tabella 1: Trasporti spesa media Data source
Elaborazione ISPRA su dati ISTAT |
Headline
Tabella 2: Trasporti spesa auto in Italia Data source
Elaborazione ISPRA su dati ISTAT |
In 2024, 65.8% of the average monthly expenditure of families for transport (66.2% in 2023) is allocated to the operating costs of means of transport and, among these, 65% is allocated to the purchase of fuel; families spent on average more on fuel (102.5 euros per month - Table 1) than on the purchase of some categories of food, including meat (111.28 euros), bread and cereals (83.01 euros) and health services and health expenses, i. e. Medicines plus specialist medical services, glasses, etc. (116.22 euros) (data not present in the Table).
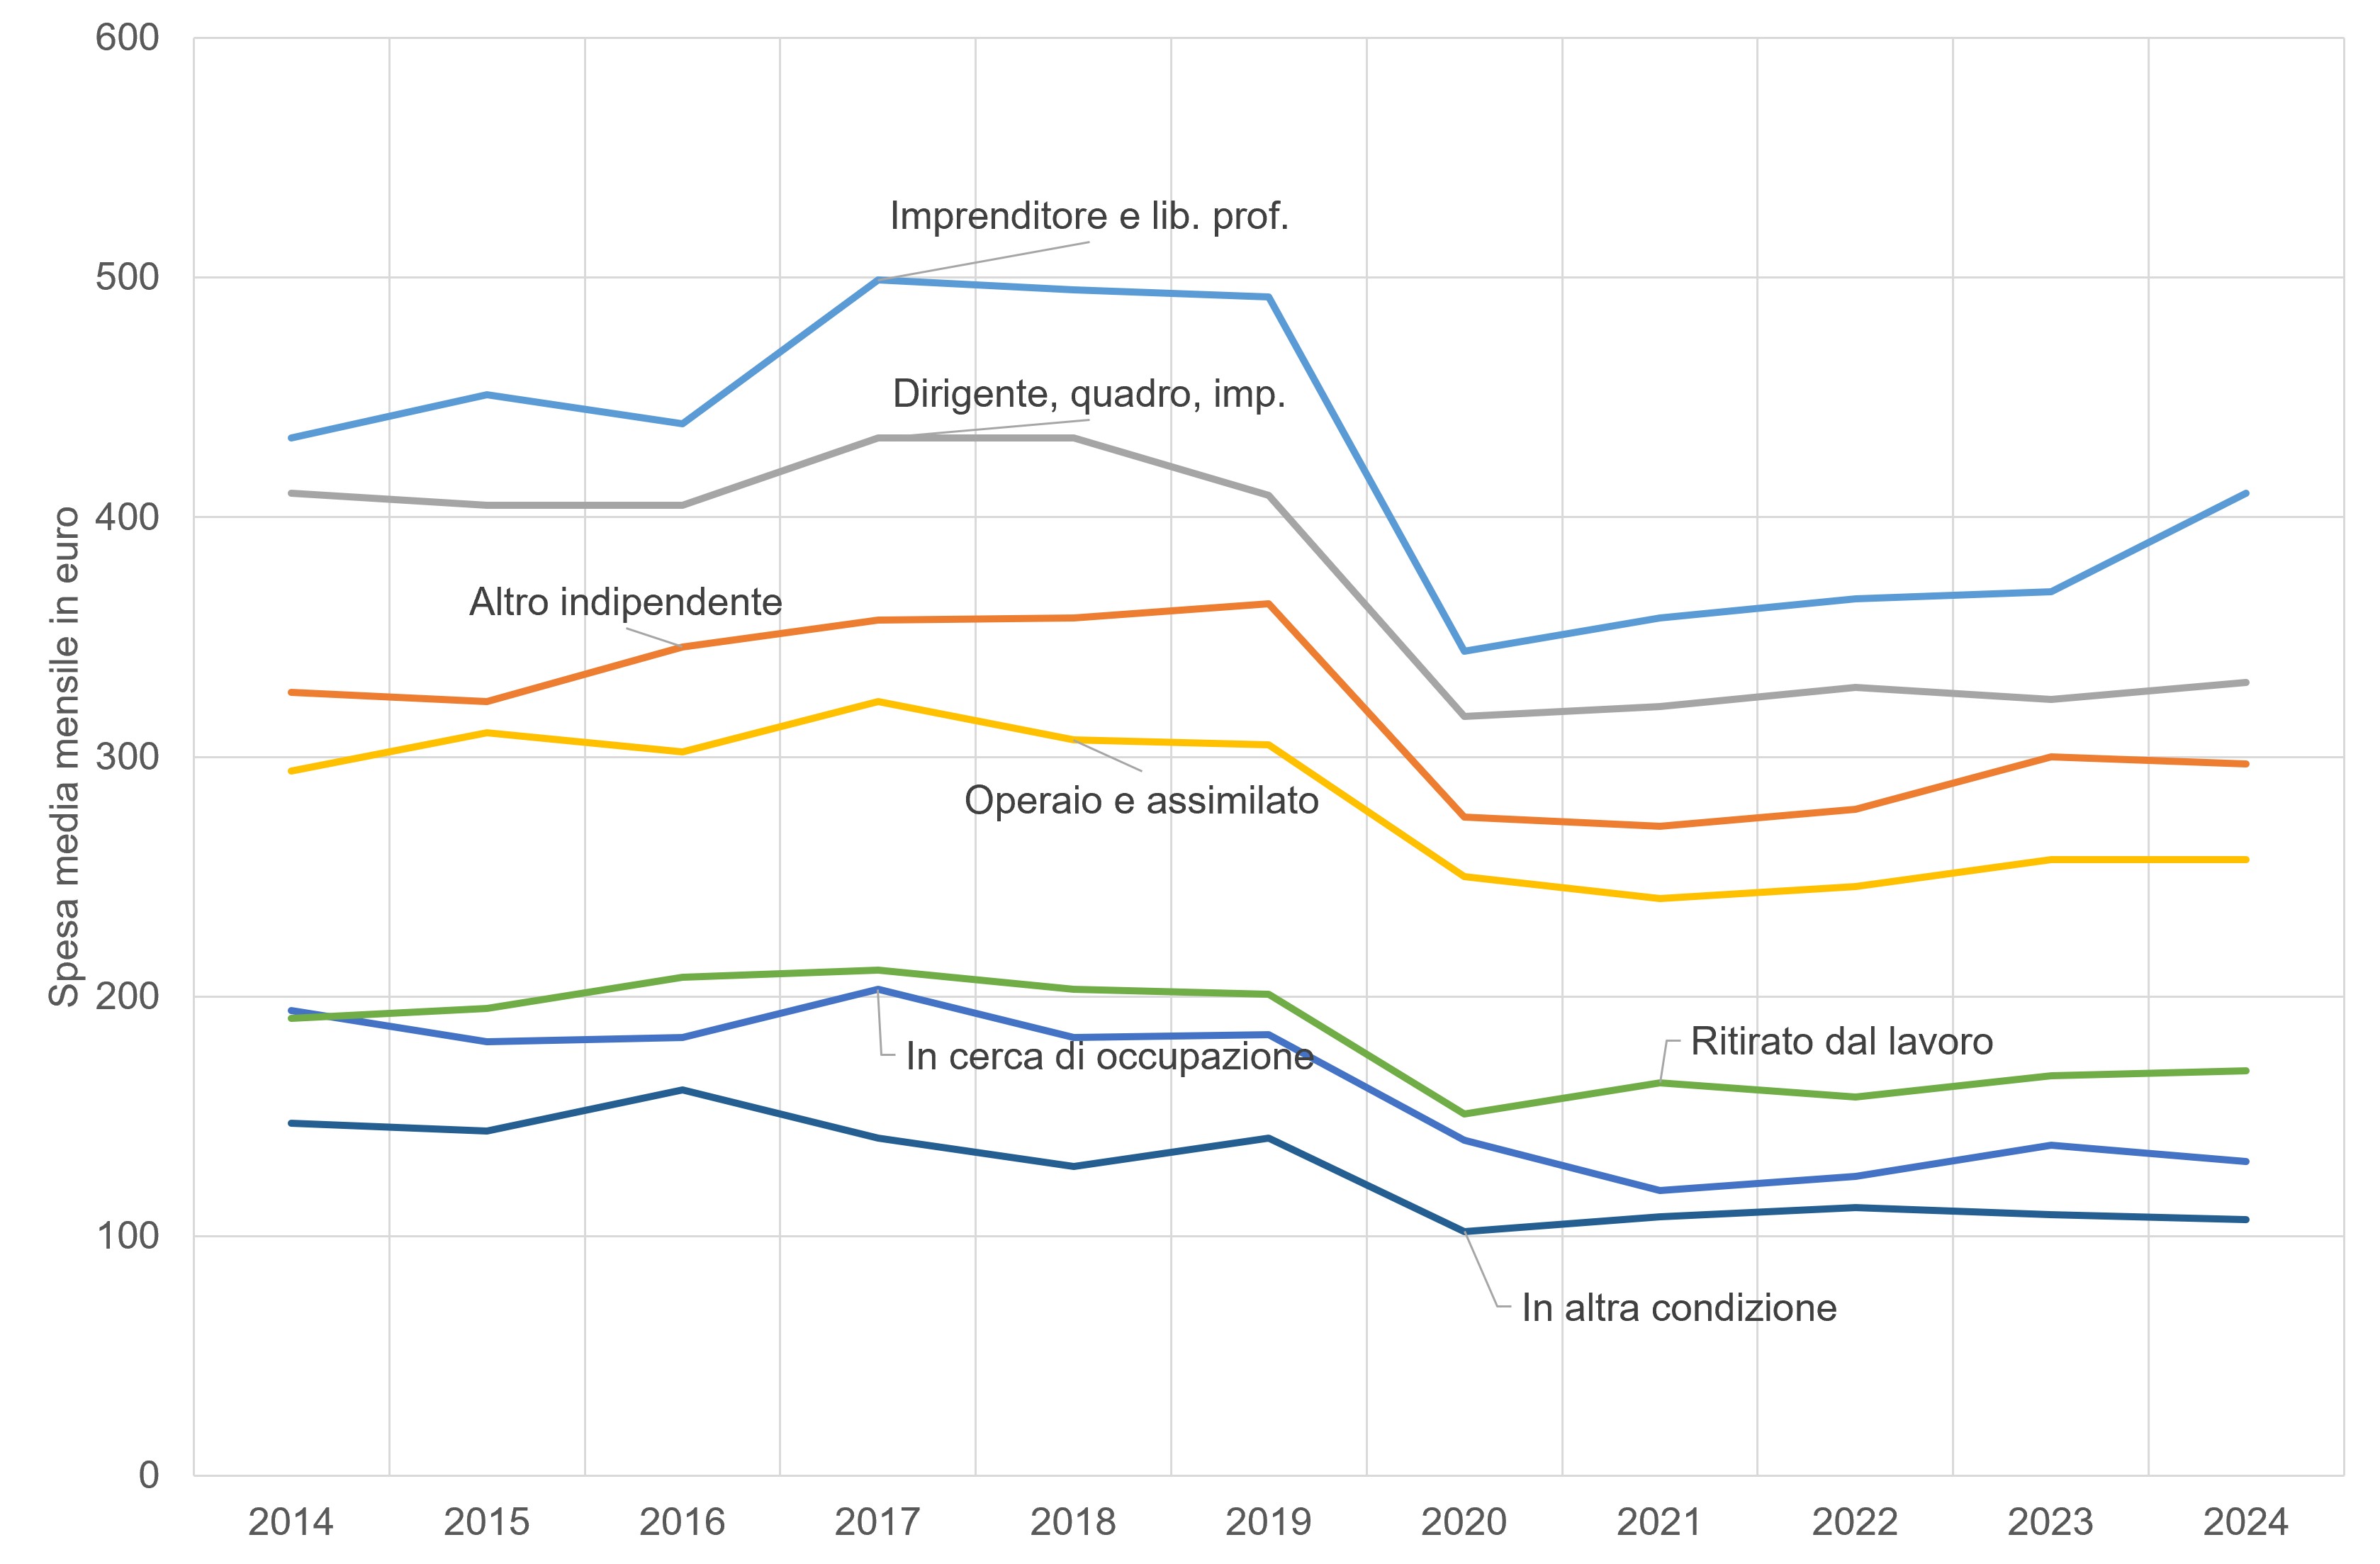
In the Islands and in the South (South) the average monthly expenditure of families for transport is lower than the national average (Figure 1). Approximately 195 euros separate the average monthly expenditure for transport incurred by families of workers (329.29 euros) from that of families of entrepreneurs and freelancers (524.71 euros) (Figure 2). The average expenditure drops to 136.51 euros per month for families headed by a person in another condition (other than retired from work). In 2024, the total expenditure (ACI estimate) incurred by motorists for the use of their own vehicle is increasing compared to the previous year by approximately 3.1% and is equal to approximately 165 million euros (160,766 million euros in 2023 - Table 2), while compared to 2000 (133,606 million euros) it is even more significant, +24%. In 2024, the main share of expenses, equal to 32%, is made up of expenses for the purchase and interest on capital (39% in 2000), followed by expenses for fuel (25%) and those for maintenance and repairs (18%).
The data contained in Tables 1 and 2 are not comparable with each other, as they are produced by different sources and with different methodologies; However, it was deemed useful to present them here, as they are descriptive of the phenomenon being analysed.