Gabriele Leoni, Daniele Spizzichino, Valerio Comerci
As of December 31, 2024, 16,729 cultural heritage sites are located in municipalities classified as areas with a high probability of strong earthquakes, representing 7.3% of the total cultural heritage.
This indicator provides the number of cultural heritage sites exposed to seismic hazard across the national territory. The estimate was made using the following input data: architectural, monumental, and archaeological sites from the VIR (Vincoli in Rete) database managed by the ISCR (Istituto Superiore per la Conservazione ed il Restauro); the new seismic classification adopted by regions and autonomous provinces following the OPCM 20 March 2003, No. 3274 and OPCM 28 April 2006, No. 3519.
To provide an initial overview, at national, regional, and municipal levels, of the distribution of cultural heritage exposed to seismic hazard.
Implementation by the Regions and Autonomous Provinces of OPCM 20 March 2003, No. 3274 and OPCM 28 April 2006, No. 3519.
Acts of implementation were completed by 31 January 2020.
Abruzzo: DGR 29/3/03, n. 438. Basilicata: DCR 19/11/03, n. 731. Calabria: DGR 10/2/04, n. 47. Campania: DGR 7/11/02, n. 5447. Emilia-Romagna: DGR 23/07/18, n. 1164. Friuli-Venezia Giulia: DGR 6/5/10, n. 845. Lazio: DGR 22/5/09, n. 387. Liguria: DGR 17/03/17, n. 216. Lombardia: DGR 11/7/14, n. X/2129 Marche: DGR 29/7/03, n. 1046. Molise: DGR 20/9/06, n. 194. Piemonte: DGR 15 febbraio 2019, n. 17-8404. Puglia: DGR 2/3/04, n. 153. Sardegna: DGR 30/3/04, n. 15/31. Sicilia: DDG 11/03/22, n. 64. Toscana: DGR 26/5/14, n. 421. Trentino-Alto Adige-Bolzano, DGP 6/11/06, n. 4047; Trento, DGP 27/12/12, n. 2919/S049/2020-21.3. Umbria: DGR 18/9/12, n. 1111. Veneto: DGR n. 244 del 09 marzo 2021. Valle d'Aosta: DGR 4/10/13 n. 1603.
-
The indicator is subject to approximations due to the scale of analysis, which is conducted at the municipal level.
Future actions aimed at improving this indicator will be carried out by incorporating, where present, seismic microzonation studies on a municipal basis and, where possible, associating expected seismic acceleration values directly with the individual asset. Implementation of the ISCR VIR database.
ISCR
ISPRA
Civil Defense
Basic data on Italy's cultural heritage can be found and accessed at: http://vincoliinrete.beniculturali.it/VincoliInRete/vir/utente/login
National, based on municipalities
2024
Geostatistical alignment and analysis on a GIS platform of data from various databases.
As of December 31, 2024, 16,729 cultural heritage sites are located in municipalities classified as high seismic risk areas, making up 7.3% of the total cultural heritage. A total of 109,346 cultural heritage sites are located in municipalities in seismic class 1 or 2.
Qualitative changes in the indicator can only occur following updates to seismic classification and/or the information on exposed cultural heritage sites. The slight variation in the total number of exposed sites compared to the previous survey arises from corrections to the database, both qualitative (geolocation) and quantitative (integration of site numbers). The seismic classification at the municipal level was updated in September 2024. The trend is not definable.
| Allegati |
|---|
Titolo
Tabella 1: Numero dei beni culturali per comuni classificati secondo la diversa pericolosità sismica (2024) Fonte
Elaborazione ISPRA su dati ISPRA, ISCR, Protezione Civile Legenda
Zona sismica con probabilità di superamento pari al 10% in 50 anni (ag): 1 = ag > 0,25; 2 = 0,15<ag≤0,25; 3 = 0,05<ag≤0,15; 4 = ag≤0,05 |
Titolo
Tabella 2: Beni culturali, in classe sismica 1 o 2, per regione (2024) Fonte
Elaborazione ISPRA su dati SPRA, ISCR e Protezione Civile Legenda
Zona sismica con probabilità di superamento pari al 10% in 50 anni (ag): 1 = ag > 0,25; 2 = 0,15<ag≤0,25 |
Titolo
Tabella 3: Comuni con il maggior numero di beni culturali in classe sismica 1 (2024) Fonte
Elaborazione ISPRA su dati ISPRA, ISCR e Protezione Civile |
Thumbnail
Titolo
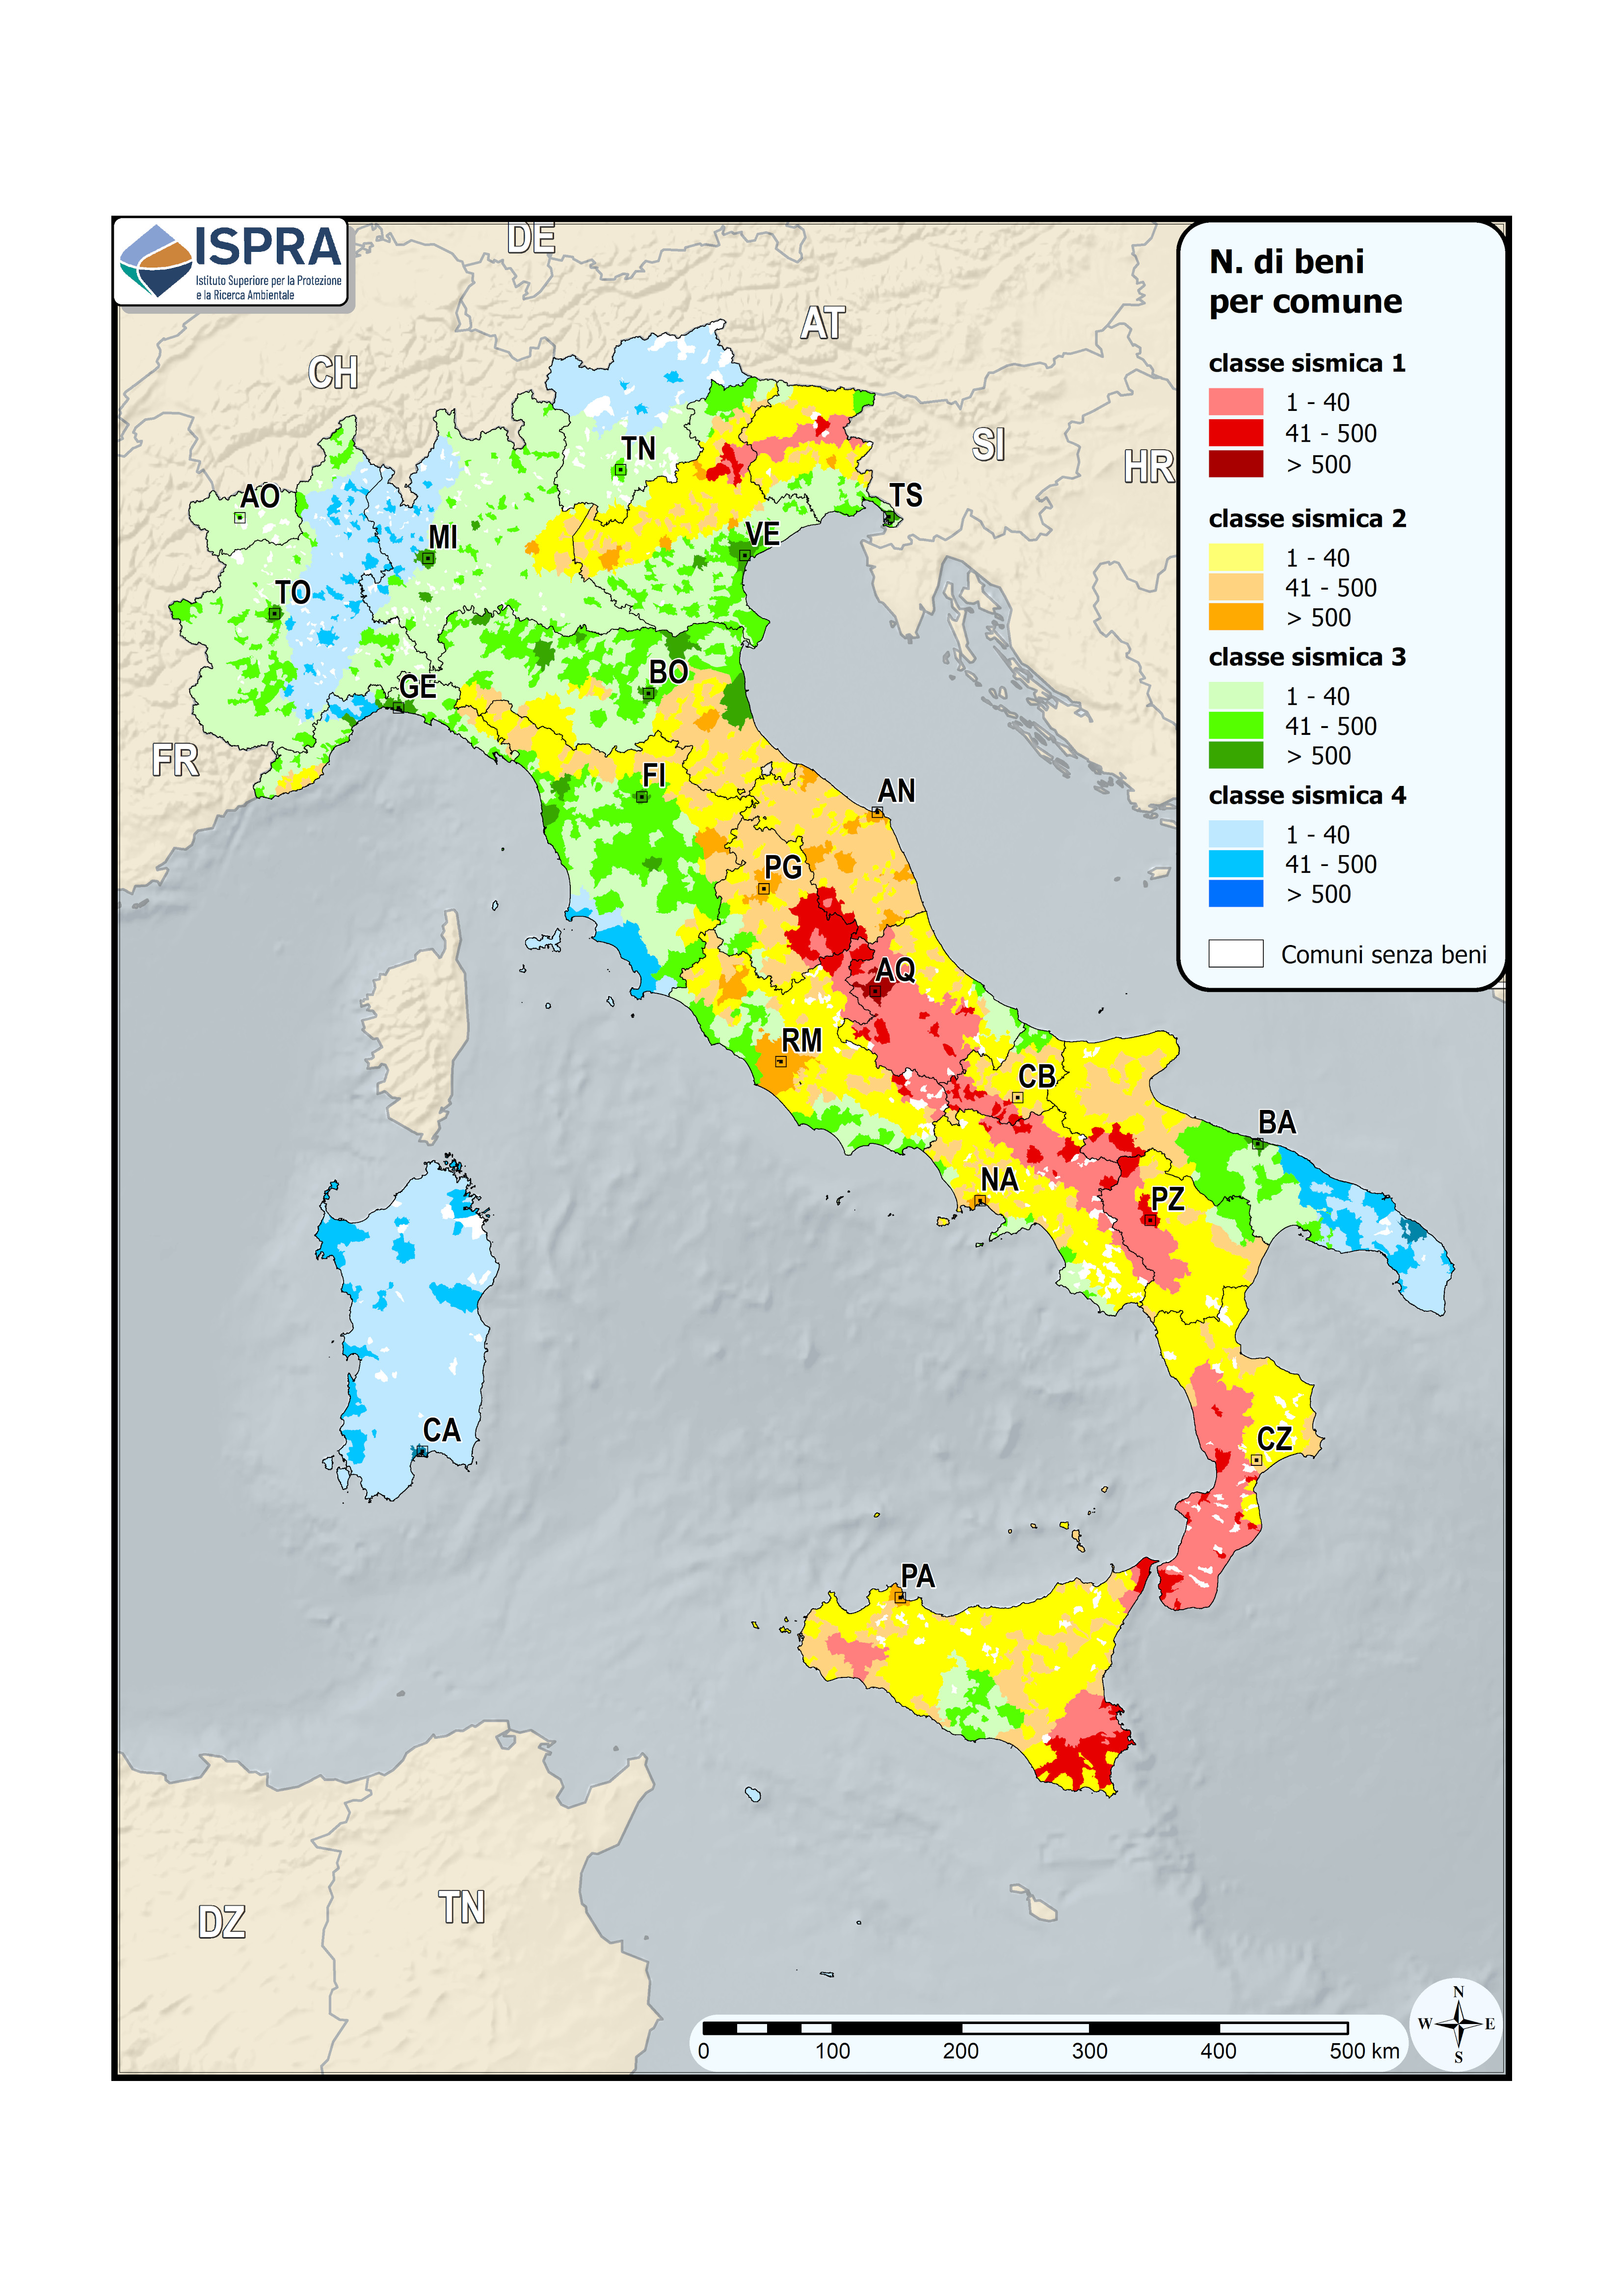
Figura 1: Beni culturali per le diverse classi sismiche su base comunale (2024) Fonte
Elaborazione ISPRA su dati ISPRA, ISCR e Protezione Civile |
As of December 31, 2024, 16,729 cultural heritage sites (Table 1) are located in municipalities classified as areas with a high probability of strong earthquakes (zones 1 and 1-2A), representing 7.3% of the total cultural heritage.
Regions with the highest number of cultural heritage sites in seismic class 1 or 2 municipalities (where strong earthquakes are possible) are:
Marche: 22,885 sites (9.9%)
Lazio: 12,139 sites (5.3%)
Veneto: 11,800 sites (5.1%)
Campania: 11,331 sites (4.9%)
Sicily: 7,906 sites (3.4%)
In total, 109,346 cultural heritage sites are located in municipalities classified as seismic class 1 or 2 (Table 2).
Municipalities in seismic class 1 with the most cultural heritage sites (over 300) are:
L'Aquila (714)
Messina (422)
Spoleto (419)
Foligno (353)
Reggio Calabria (328)
Benevento (320) (Table 3).