Giovanni Finocchiaro, Silvia Iaccarino
The indicator analyzes the average CO₂ emissions per passenger in air travel, as proxy of the climate impact of air transport associated with tourism. It is calculated as the ratio between the total CO₂ emissions of passenger flights and the number of passengers transported. After the increase recorded in the two-year pandemic period, due to the strong reduction in passengers compared to operational flights, the indicator shows a progressive improvement: in Italy it goes from 87.67 kg CO₂/passenger in 2019 to 77 in 2023, reaching 81.12 kg CO₂/passenger in 2024, rising in the last available year. In the European comparison, Italy is placed at values lower than the EU27 average (94.80 in 2024), but still distant from the best performances observed in some countries (values around 57 kg CO₂/passenger), signaling margins for further decarbonisation actions in the sector.
The indicator is part of the "green" pillar relating to environmental impacts of the European Union Tourism Dashboard. It measures average CO emissions 2 per air travel passenger and is relevant for assessing the impact of tourism on climate change. It is calculated by dividing the quantity of CO 2 issued by all passenger flights for the number of passengers in a year.
The quantities of emissions and the number of air passengers are associated with the airport of departure of the flights. The indicator therefore takes into account, for each airport, both residents departing for a tourist destination and tourists returning home. Lower values indicate lower emissions per airline passenger. Higher domestic values are usually associated with long-haul flights.
Help monitor the impact of tourism on climate change.
The indicator has no reference legislation or related objectives.
Batista, Filipe; Ricardo Barranco (2022): UDP - Air travel emission intensity. European Commission, Joint Research Center (JRC) [Dataset] PID: http://data. europa. eu/89h/a9878ba6-6826-47af-9ef4-6664587f1250
Air travel emission intensity - Green pillar - National | Indicator Map view (europa. eu)
Eurostat
Eurocontrol
National
2019-2024
The indicator is obtained by dividing the amount of CO emissions 2 of departing aircraft for departing passengers in a year. CO emissions are excluded 2 of purely cargo flights. The indicator therefore takes into account, for each airport, both residents departing for a tourist destination and tourists returning home. Lower values indicate lower emissions per airline passenger. Higher domestic values are usually associated with long-haul flights.
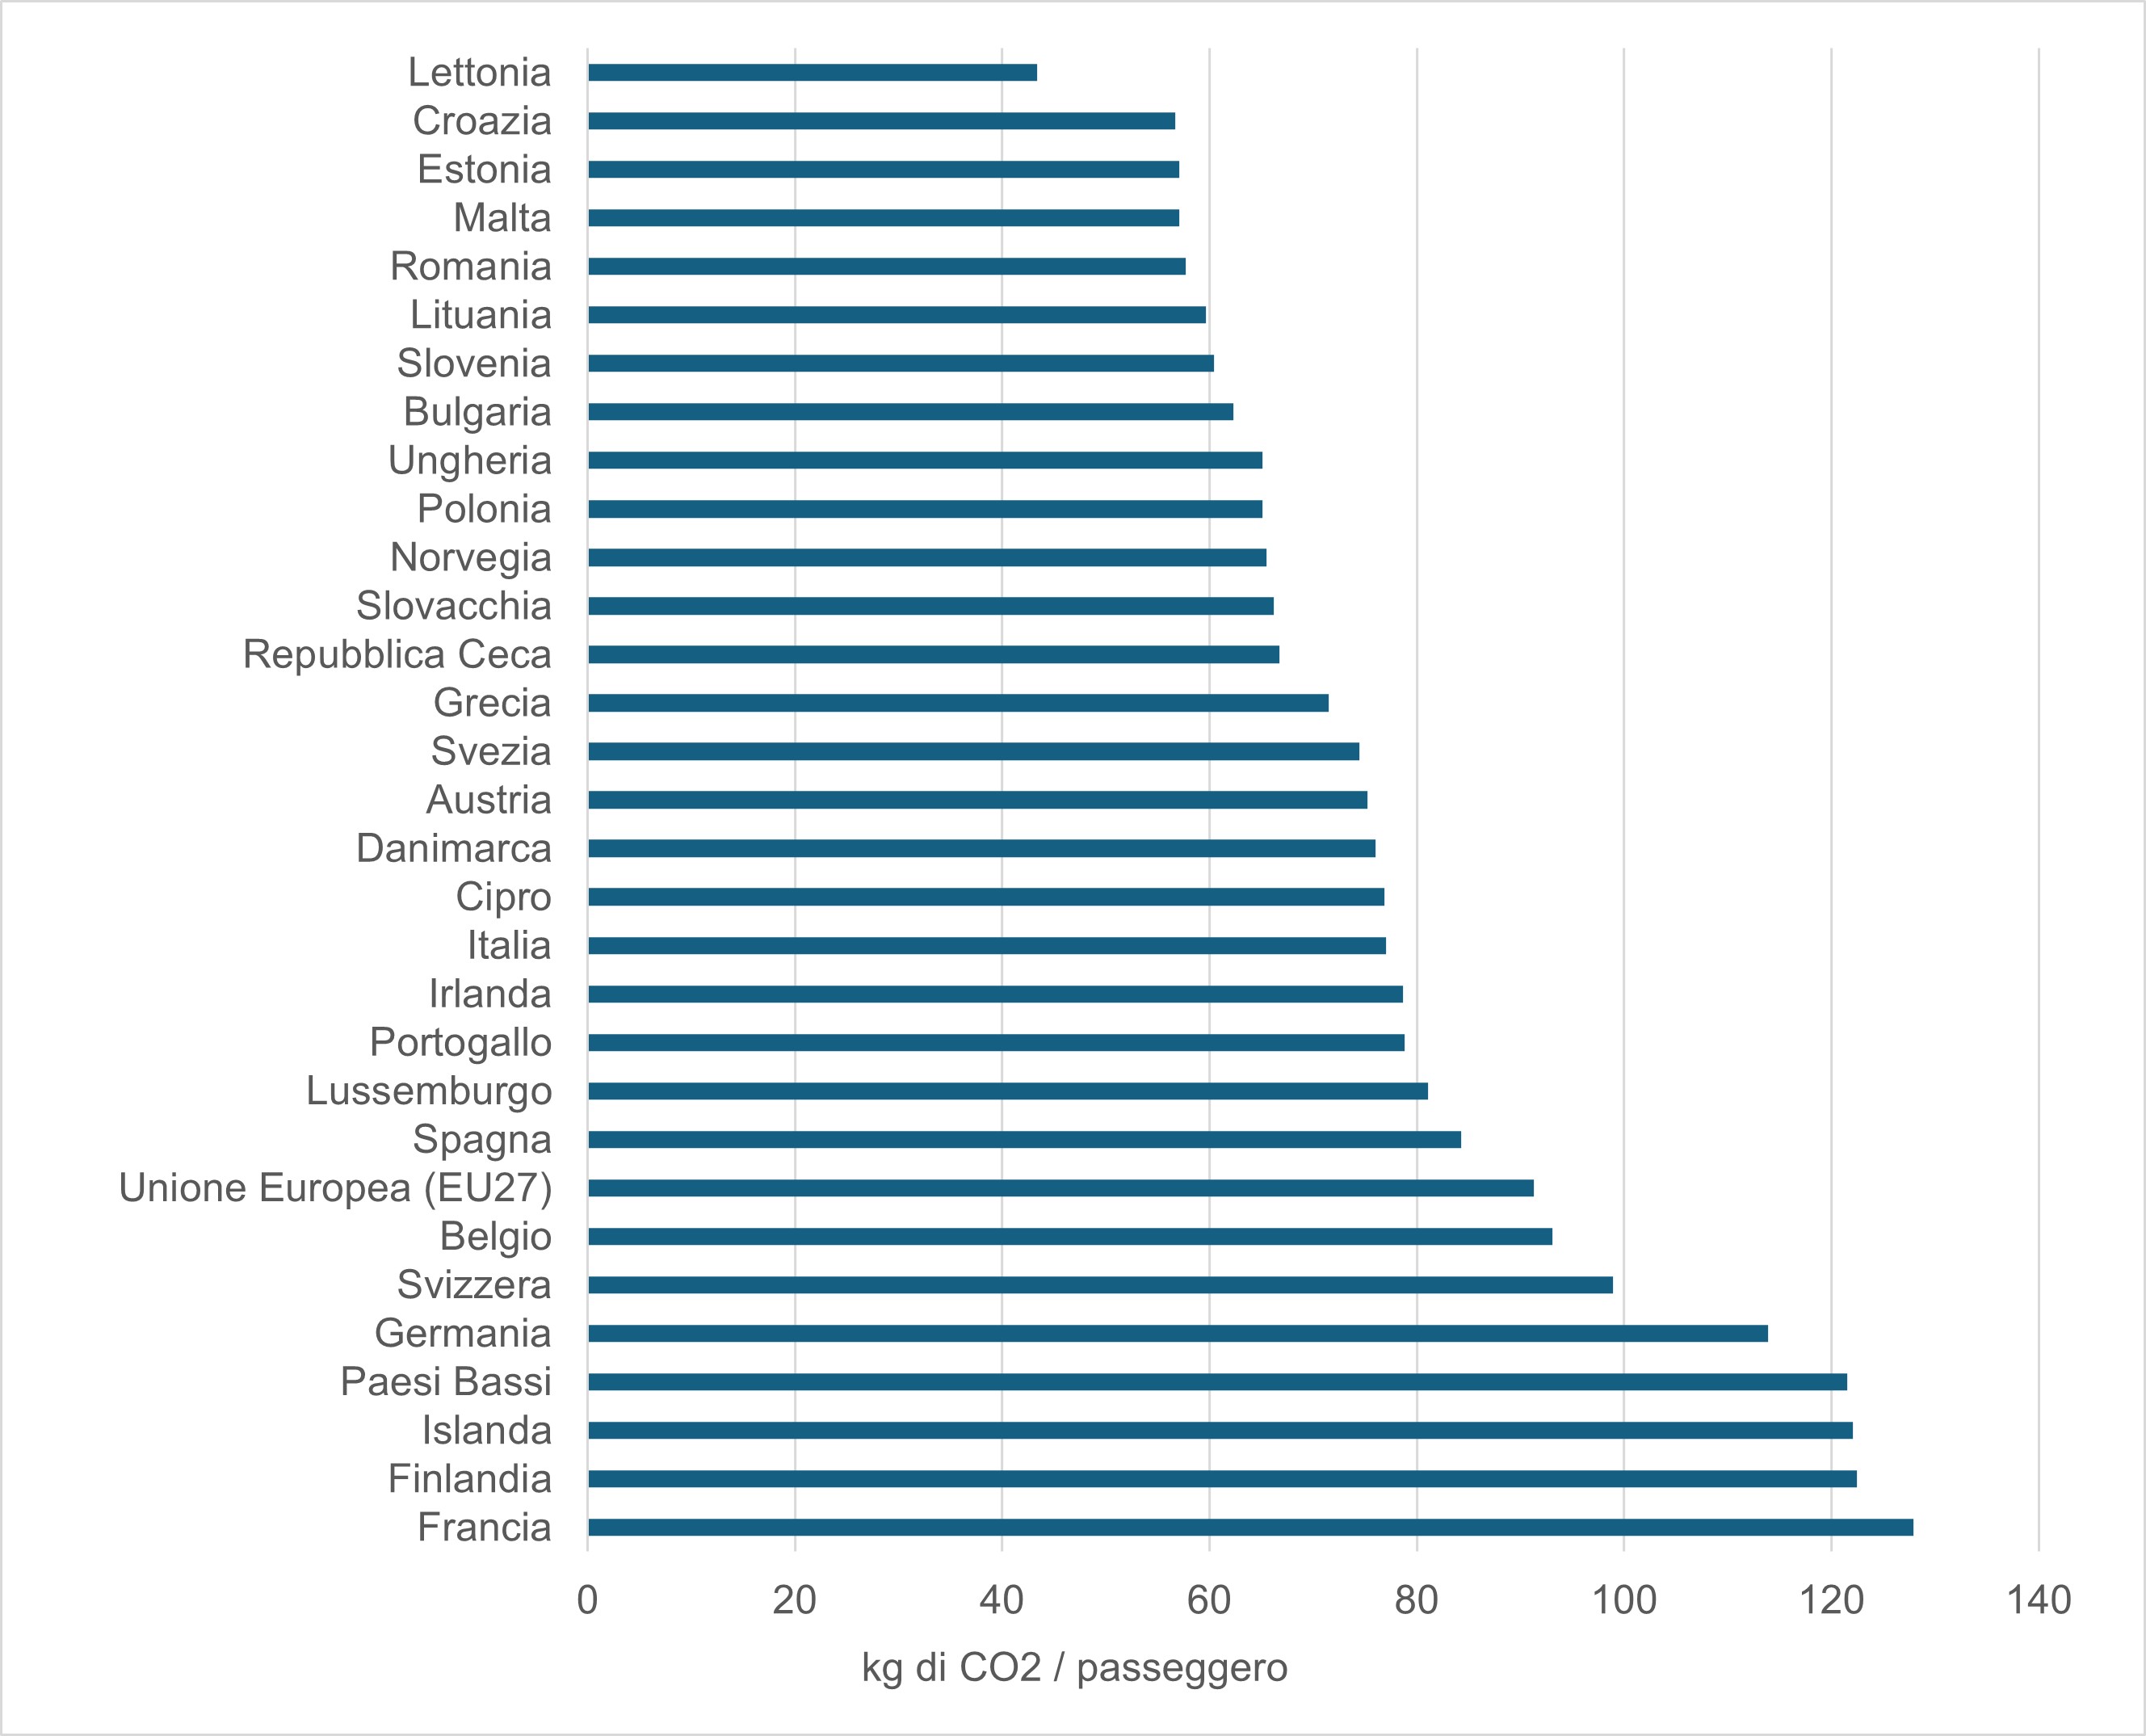
In 2024 the intensity of emissions from air travel in Italy is equal to 81.12 kg CO₂ per passenger, a higher value than in 2023 (77.00) but still lower than the pre-pandemic level of 2019 (87.67) and better than the EU27 average (94.80 in 2024). The state can be assessed as average: Italy is positioned in a relatively favorable range compared to the European average, but still remains far from countries with lower values (for example in 2024 Estonia 56.99, Latvia 57.01, Croatia 57.41) (Figure 1).
In the period 2019–2024, a dynamic consistent with the pandemic effect can be seen: an increase in 2020 (112.58 kg CO₂ per passenger) and still high values in 2021 (99.30), followed by a marked reduction in 2022 (78.83) and 2023 (77.00). In 2024, a slight rise is observed (81.12), which suggests a partial rebound compared to the recent minimum (Table 1). Overall, the trend remains positive compared to pre-pandemic, but the 2023–2024 variation indicates the need to consolidate and accelerate decarbonization measures to avoid reversals and stabilize the reduction.
| Allegati |
|---|
Titolo
Table 1: Distribution of emission intensities from air travel in European countries Fonte
JRC, on Eurocontrol and Eurostat data |
Thumbnail
Titolo
JRC, on Eurocontrol and Eurostat data Fonte
ISPRA processing on JRC, Eurocontrol and Eurostat data |
In the European comparison, Italy presents values lower than the EU27 average both in 2023 (77.00 vs 91.68) and in 2024 (81.12 vs 94.80), therefore placing itself in a relatively favorable position. However, Italy is not yet among the best performing countries, which stand at around 57 kg CO₂/passenger). The increase recorded in 2024 compared to 2023 signals that the improvement is not automatically guaranteed and more incisive policies on fleet efficiency, operational optimization and increased use of sustainable fuels are strategic, so as to consolidate the reduction in emission intensity over time.