Carla Iadanza, Alessandro Trigila
The indicator provides information on the landslide-prone areas of the Hydrogeological Management Plans (PAI) on the national territory. The total surface area, in Italy, of the PAI landslide hazard areas and the areas of attention is equal to 69,530 km 2 (23% of the national territory), of which 28,801 km 2 (9.5%) are areas of high P3 and very high P4 danger, subject to the most restrictive land use constraints.
The indicator provides information on the areas at risk from landslides delimited in the Hydrogeological Management Plans (PAI), drawn up by the District Basin Authorities (formerly Basin Authorities) and, for the territories of respective competence, by the Autonomous Provinces of Trento and Bolzano. The areas at risk from landslides include, in addition to landslides that have already occurred, also the areas of possible evolution of the phenomena and the areas potentially susceptible to new landslide phenomena.
ISPRA has developed the new national mosaic (v. 5.0 - 2024) of the dangerous areas of the Hydrogeological Management Plans - PAI, according to the legend harmonized in 5 classes for the entire national territory: very high danger P4, high P3, medium P2, moderate P1 and AA attention areas. The legend was defined by ISPRA in 2015, in line with the Guidance and Coordination Act (Prime Ministerial Decree of 29 September 1998), and used for previous versions of the mosaic.
Provide a framework on the landslide hazard areas of the PAI on a national, regional, provincial and municipal basis.
Collection, processing, archiving and dissemination of data regarding soil protection and hydrogeological instability referring to the entire national territory (art. 55 of Legislative Decree 152/2006 “Regulations on environmental matters”); D. L. 180/98 “Sarno Decree” converted into Law 267/1998, Prime Ministerial Decree of 09/29/98 (Guidance and coordination act), L. 365/00.
Trigila A., Lastoria B., Iadanza C., Bussettini M., Mariani S., D'Ascola F., Salmeri A., Cassese M. L., Pesarino V., Di Paola G., Romeo S., Rischia I., Dessì B., Spizzichino D., Licata V., Gallozzi P. L. (2025) Hydrogeological instability in Italy: hazards and risk indicators - 2024 Edition. ISPRA, Reports 415/2025
-
-
National mosaicing: https://idrogeo. isprambiente. it/
Cartography of Hydrogeological Management Plans: sites of the District Basin Authorities and the Autonomous Provinces of Trento and Bolzano.
National, Regional, Provincial, Municipal
2024
The mosaicking of the areas at risk from landslides was carried out through the analysis and harmonisation, according to a legend in 5 classes for the entire national territory (very high danger P4, high P3, medium P2, moderate P1 and AA attention areas), of the data provided by the District Basin Authorities and the Autonomous Provinces of Trento and Bolzano.
the surface area of the landslide-prone areas of the PAI was then calculated on a regional, provincial and municipal basis.
The total surface area, in Italy, of the PAI landslide hazard areas and the areas of attention is equal to 69,530 km 2 (23% of the national territory), of which 28,801 km 2 (9.5%) are areas of high P3 and very high P4 danger, subject to the most restrictive land use constraints.
At present, a trend for the indicator cannot be defined due to the limitations of the historical series available (2015, 2017, 2021, 2024).
| Data |
|---|
Headline
Table 1: Landslide hazard areas PAI at regional level – Mosaic 2024 Data source
ISPRA Data legend
* ISTAT administrative boundaries 2024 Note
The data are affected by mapping and classification inconsistencies, mainly due to the different methodologies used by the District Basin Authorities and the Autonomous Provinces for the assessment of landslide hazard. |
Headline
Table 2: Landslide hazard areas PAI at provincial level – Mosaic 2024 Data source
ISPRA Data legend
*ISTAT administrative boundaries 2024 Note
The data are affected by mapping and classification inconsistencies, mainly due to the different methodologies used by the District Basin Authorities and the Autonomous Provinces for the assessment of landslide hazard. |
Thumbnail
Headline
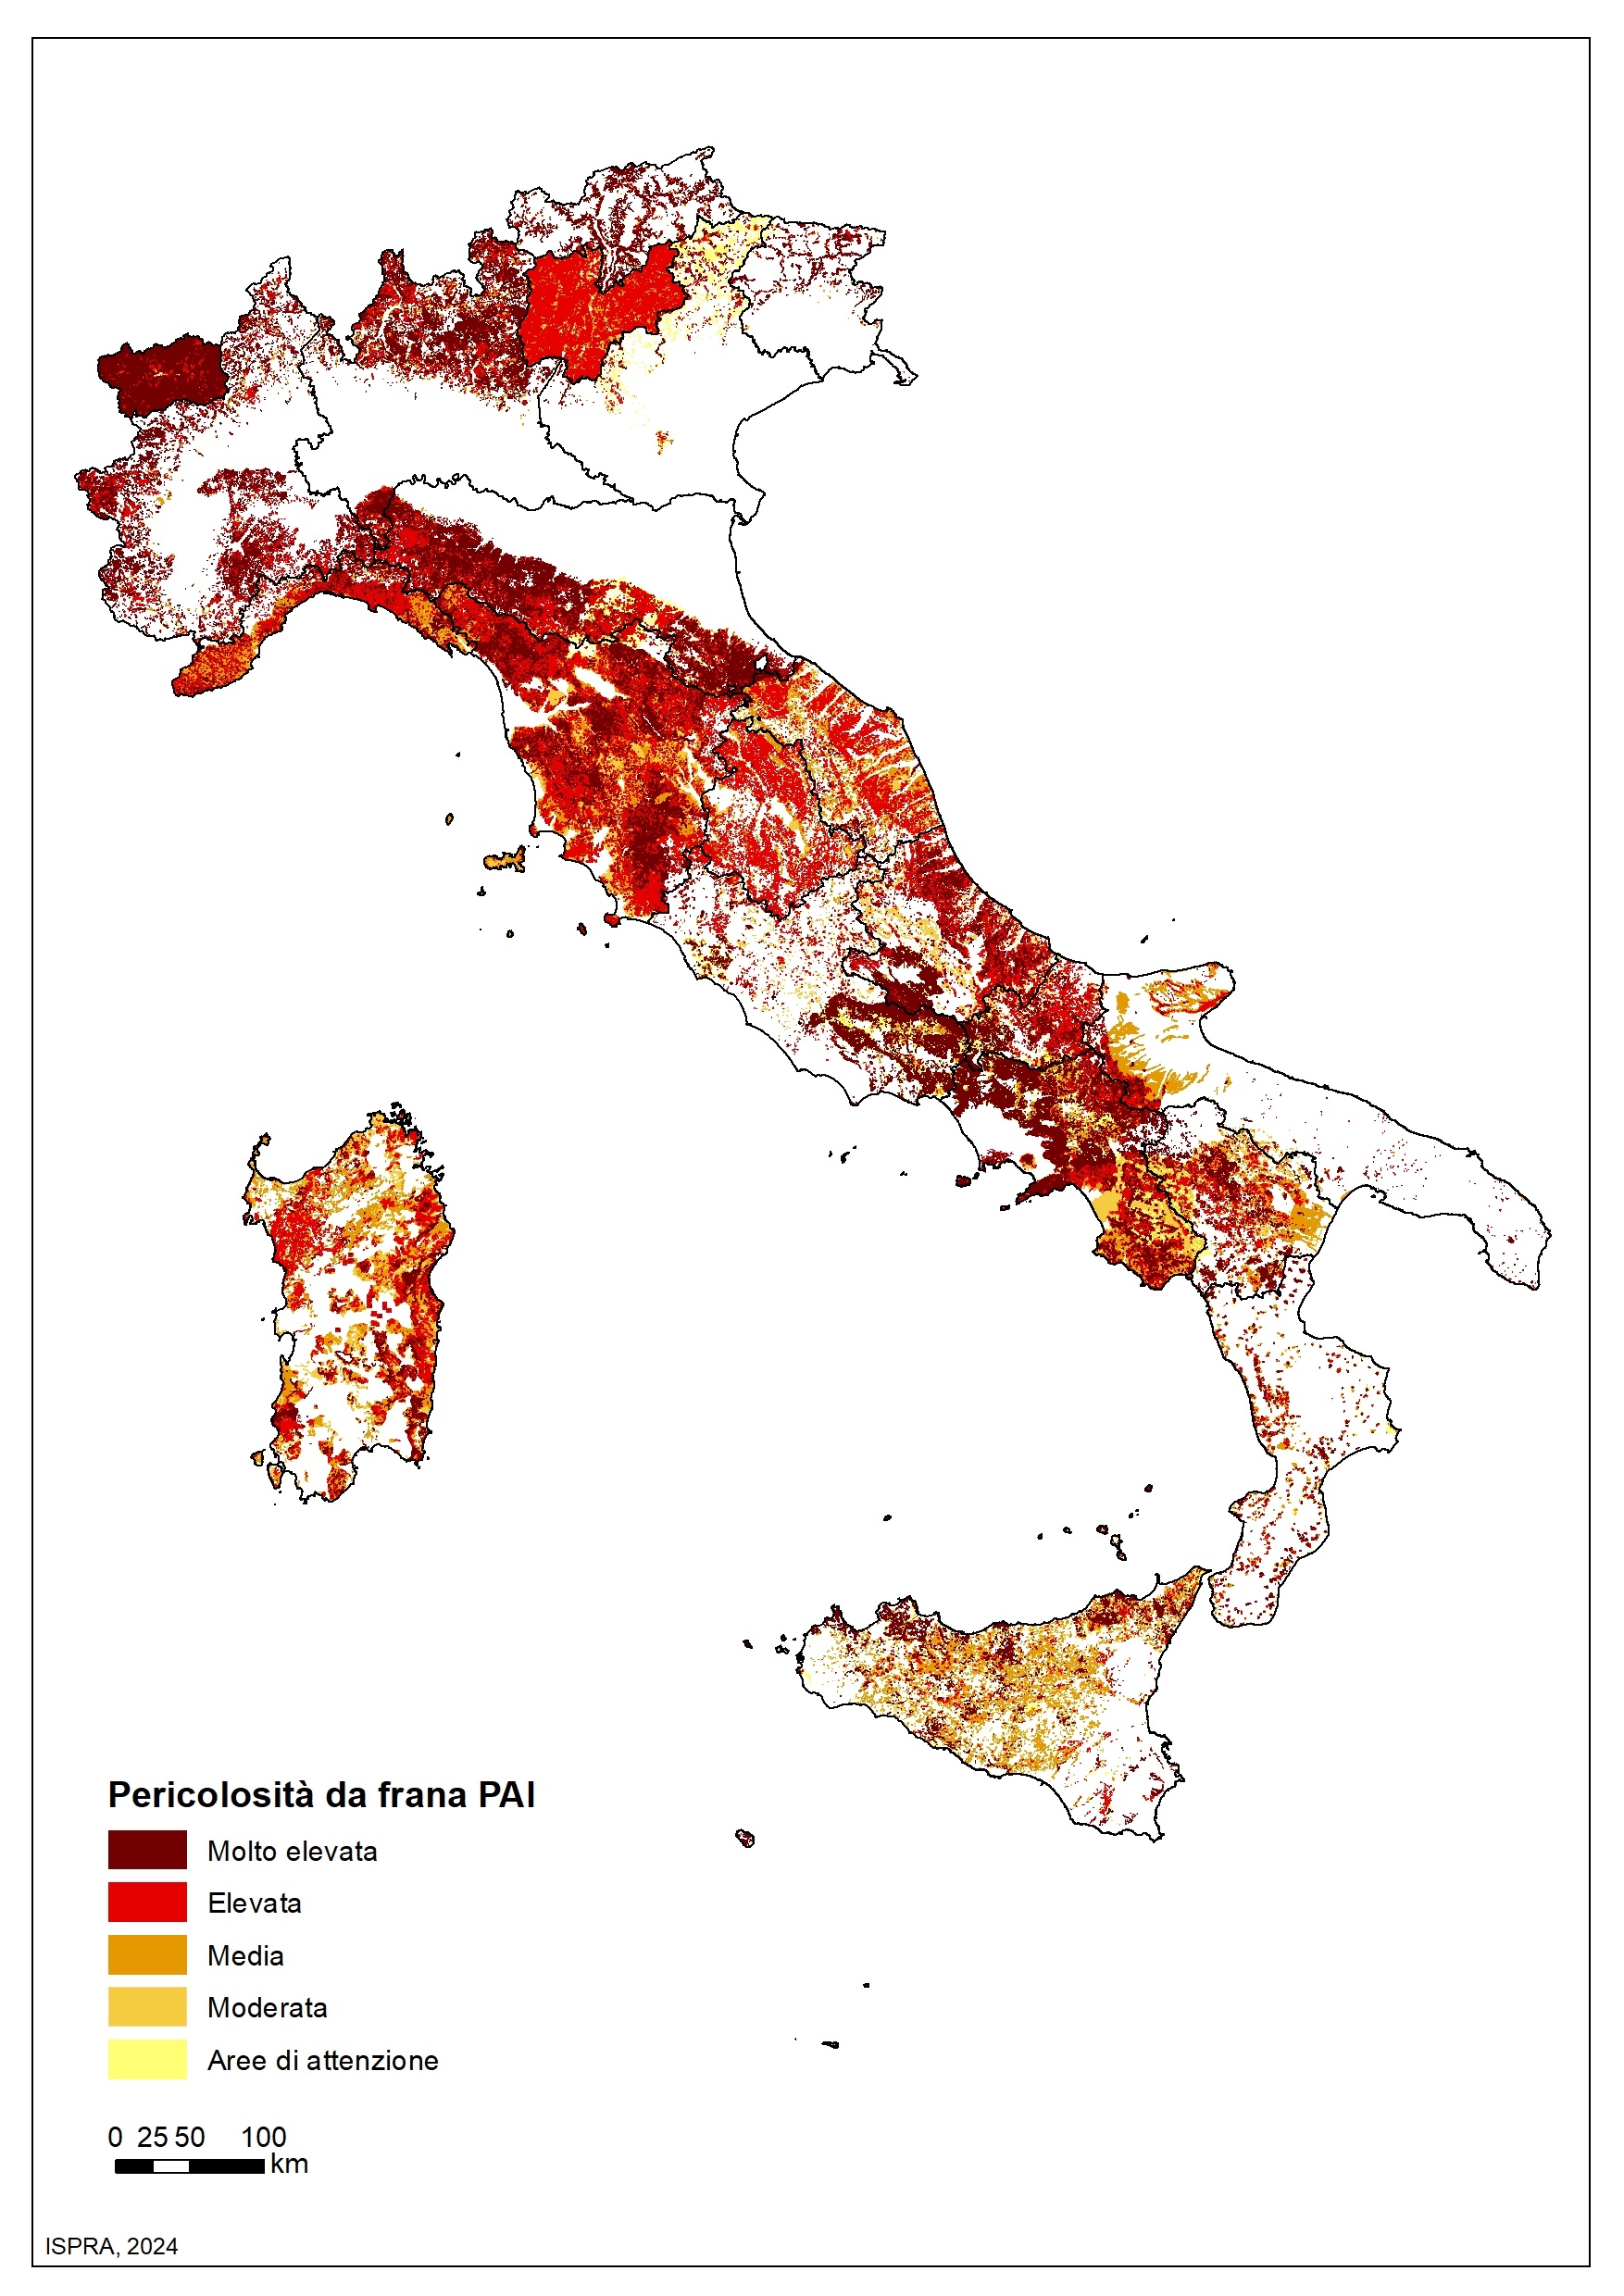
Figure 1: Landslide hazard areas PAI on the national territory – Mosaic 2024 Data source
ISPRA |
Thumbnail
Headline
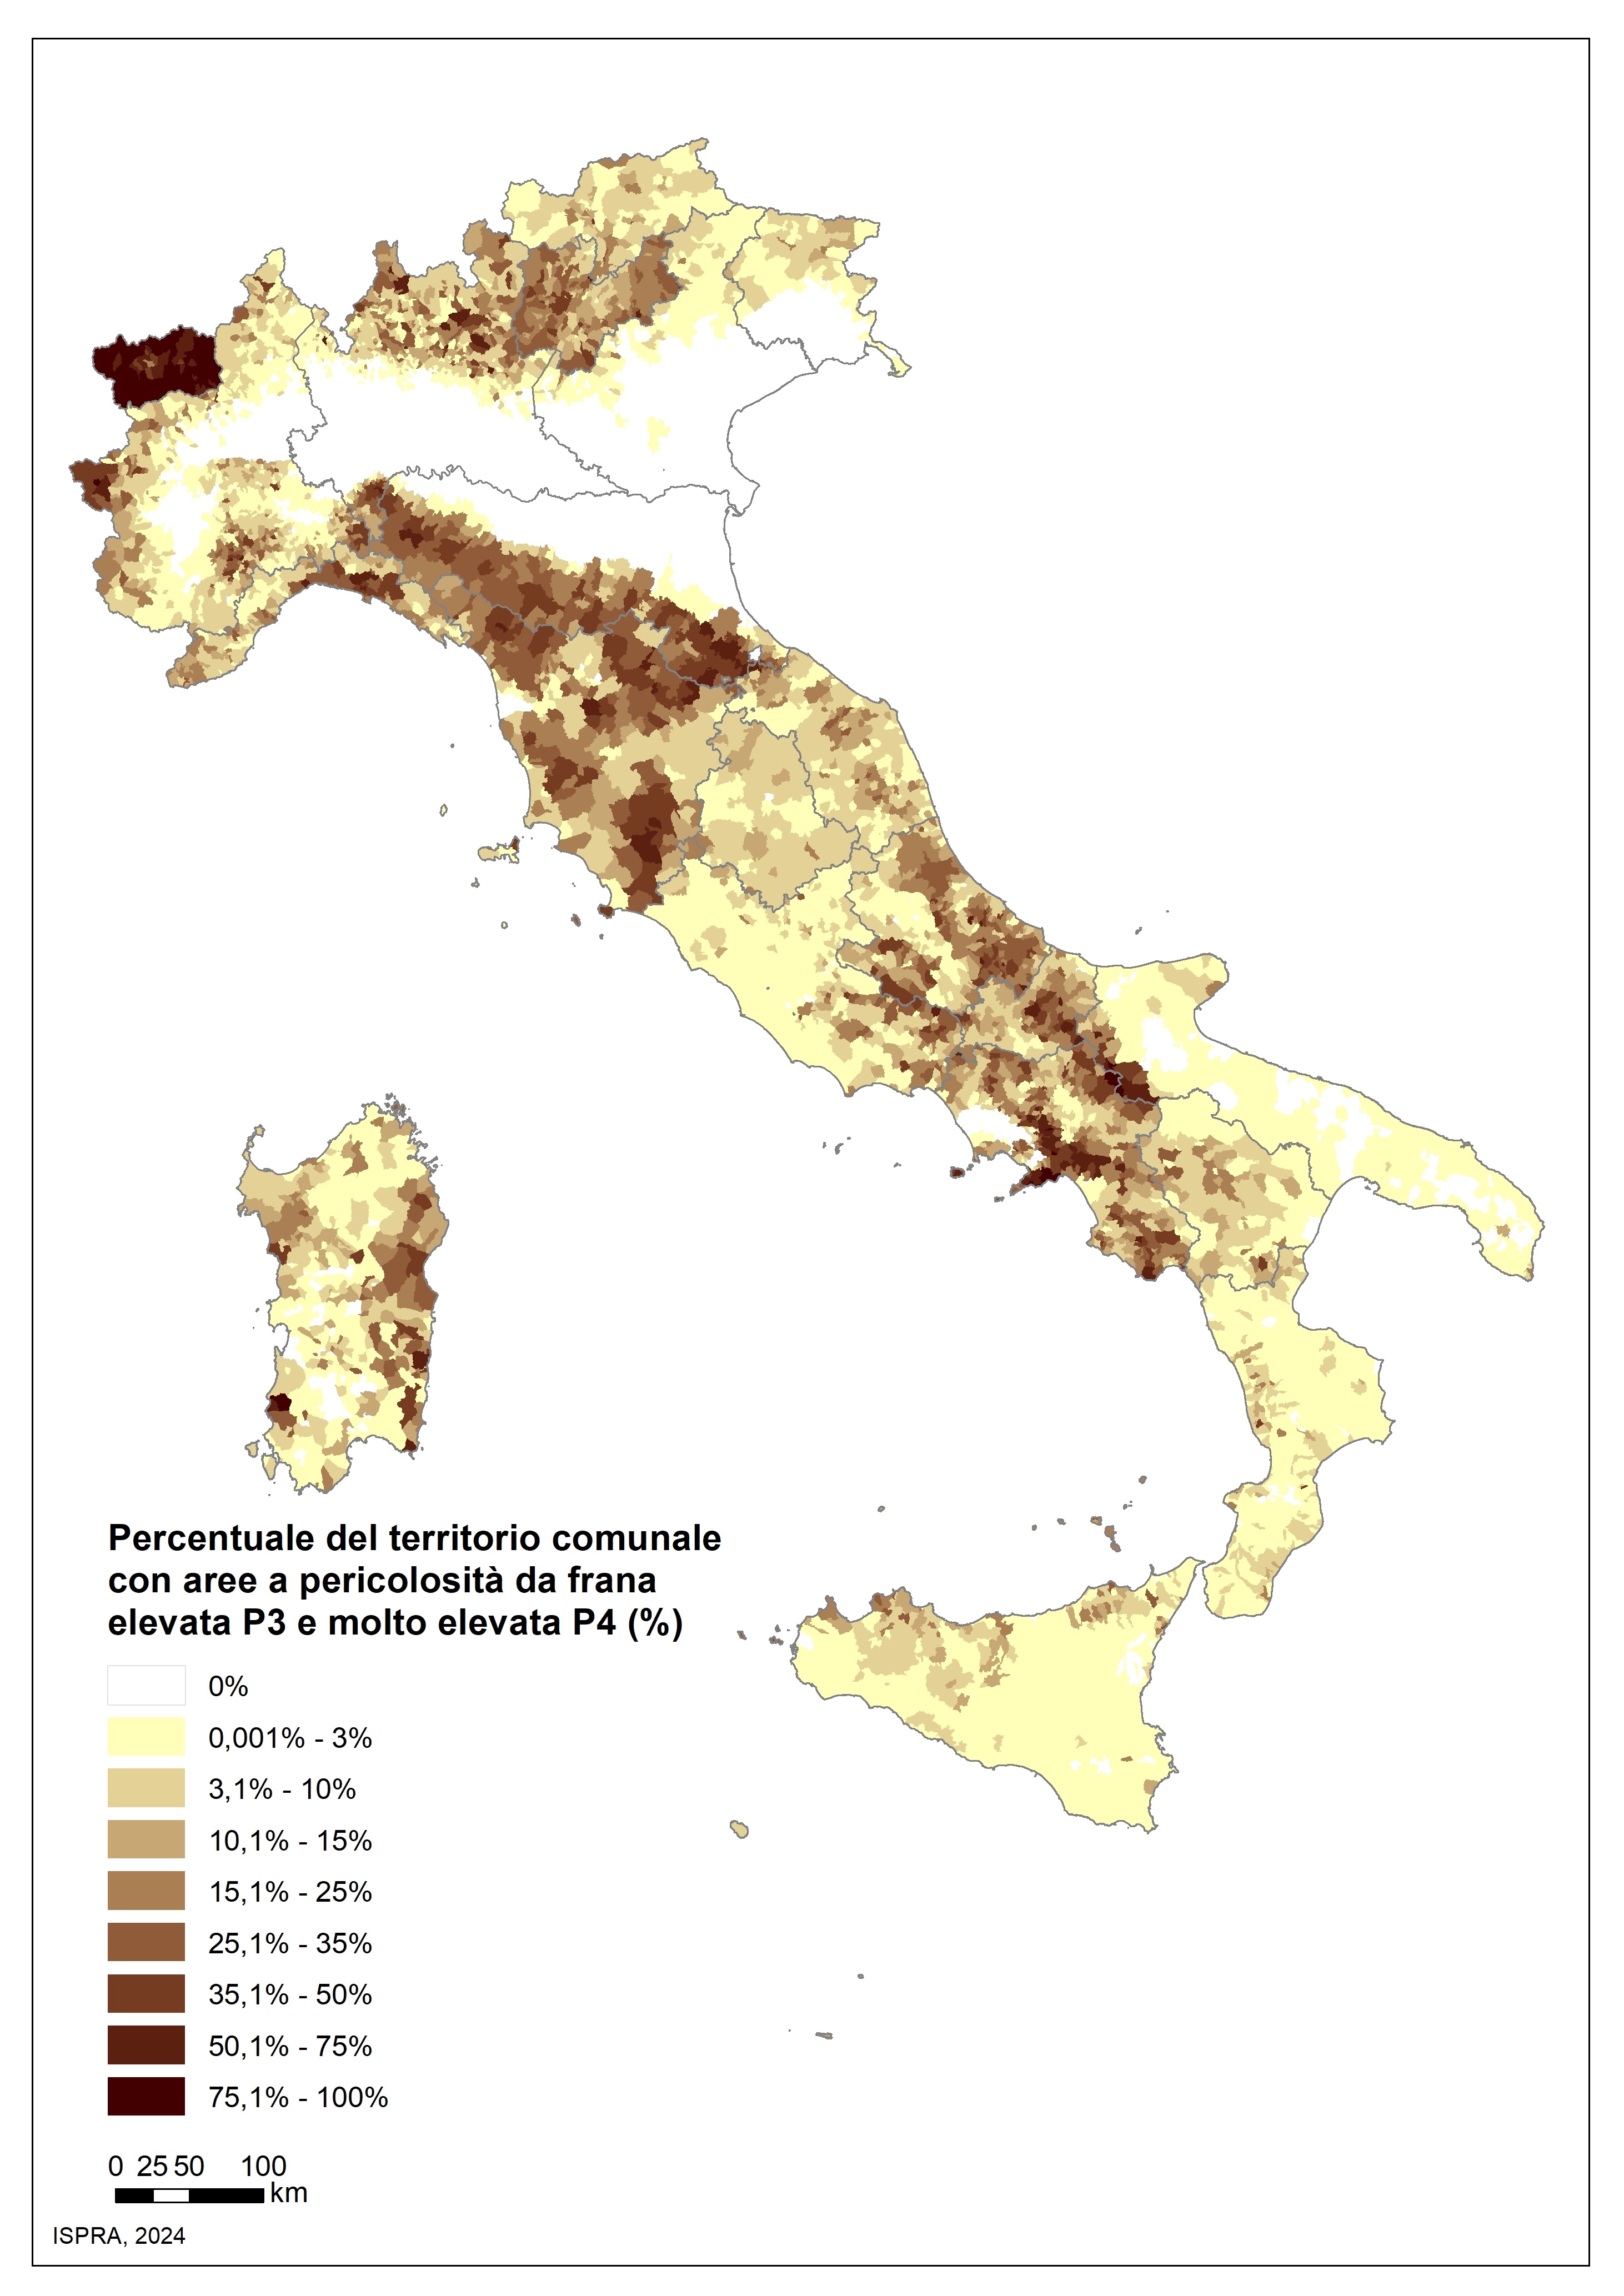
Figure 2: Percentage of territory with high hazard P3 and very high hazard P4 landslide areas at municipal level – Mosaic 2024 Data source
ISPRA |
Thumbnail
Headline
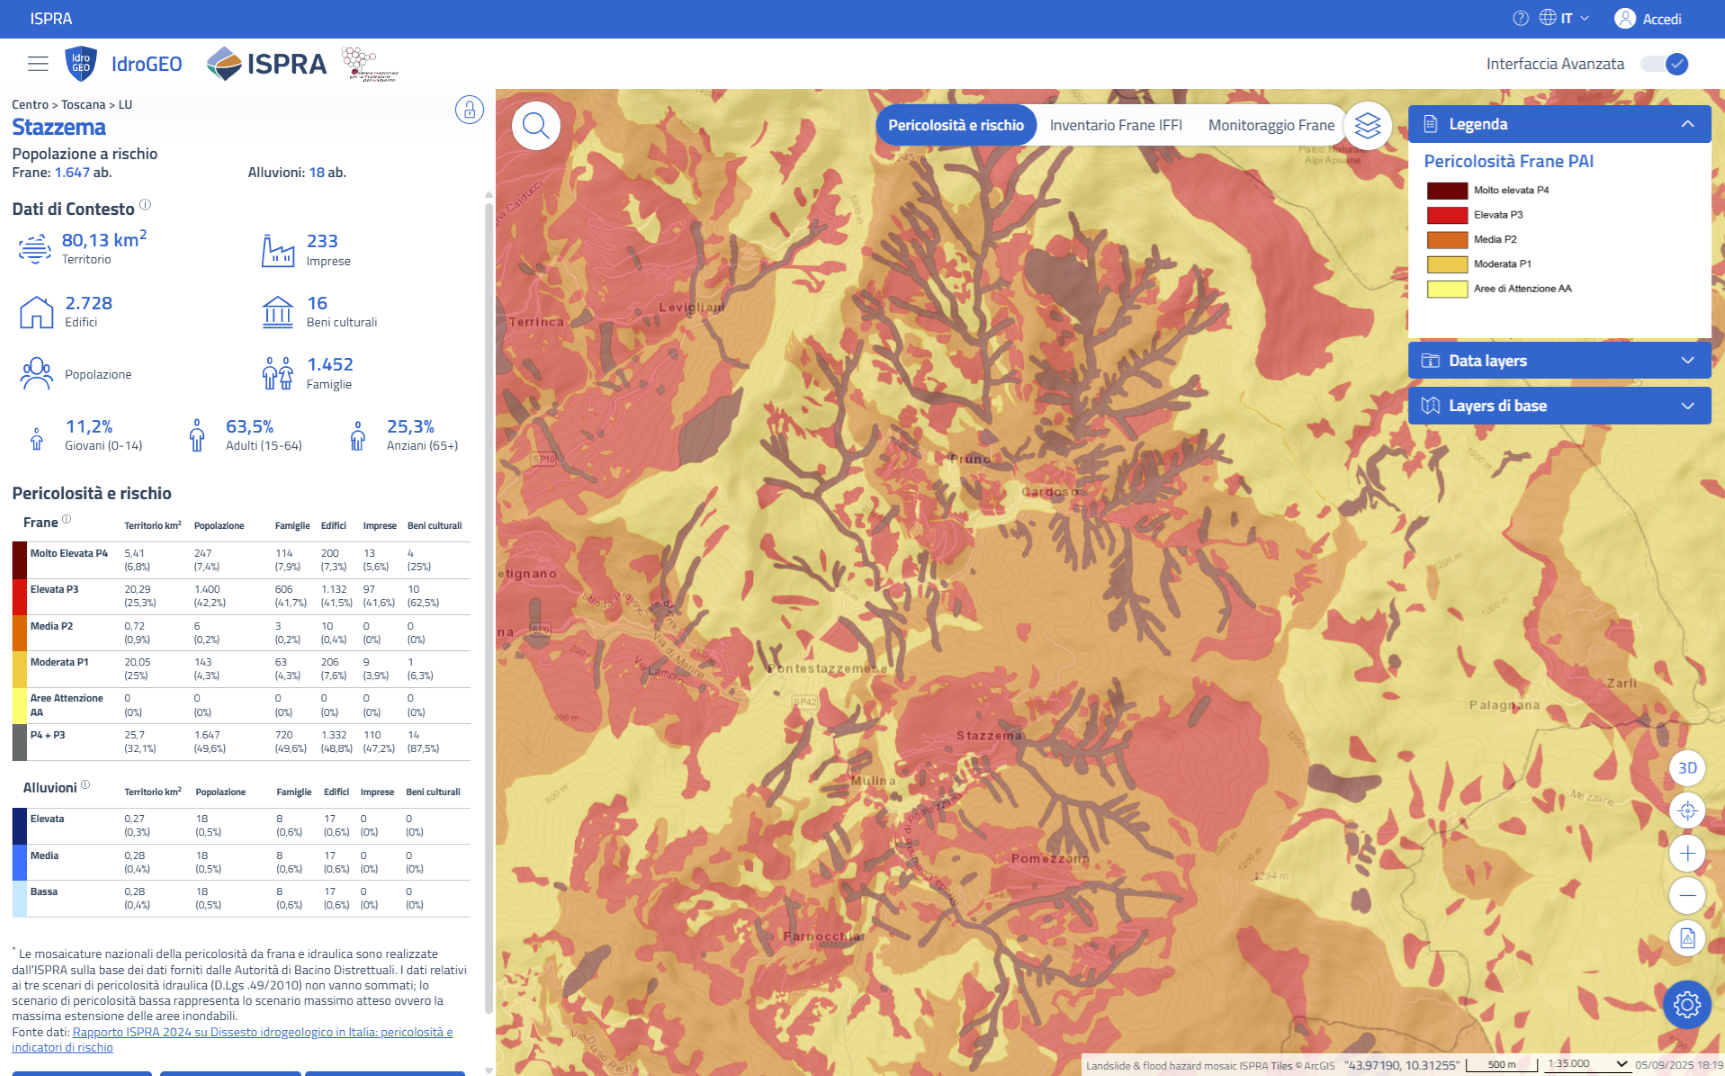
Figure 3: Mosaic of PAI landslide hazard areas on the ISPRA IdroGEO Platform Data source
ISPRA |
The total surface area, in Italy, of the PAI landslide hazard areas and the areas of attention is equal to 69,530 km 2 (23% of the national territory) (Figure 1). The surface area of the areas with very high landslide danger is equal to 10,598 km 2 (3.5%), the highly dangerous one is equal to 18,203 km 2 (6%), with medium danger at 18,074 km 2 (6%), moderately dangerous at 15,489 km 2 (5.1%) and the areas of attention are equal to 7,165 km 2 (2.4%). Considering the most dangerous classes (high P3 and very high P4), subject to the most restrictive land use constraints, the areas amount to 28,801 km 2, equal to 9.5% of the national territory.
From the Mosaic analysis of landslide hazards on the national territory (Figure 1), local inhomogeneities in mapping and classification emerge.
Tuscany, Emilia-Romagna, Valle d'Aosta, Campania, Sardinia, Piedmont, Abruzzo, Lombardy and the Autonomous Province of Trento present the largest surfaces (in km 2) at high risk P3 and very high risk P4 (Table 1).
From the comparison between the 2024 ISPRA national Mosaicing and that of 2020-2021, a 15% increase in the overall surface classified by the PAI (classes P4, P3, P2, P1 and AA) and 9.2% in the most dangerous classes (high P3 and very high P4) emerges. Between the 2020-2021 ISPRA national mosaicing and the 2017 one, the percentage increase was 0.8% of the total surface classified by the PAI and 3.8% of the most dangerous classes; between Mosaicing 2017 and 2015, it was 2.9% of the overall surface and 6.2% in P3-P4. These changes are mainly linked to the integration/revision of the perimeters by the District Basin Authorities and the Autonomous Provinces, also with more detailed studies or in areas not previously covered and to the mapping of new landslide phenomena. The most significant increases in the high and very high risk surface area between the 2024 and 2021 national mosaics concerned the Autonomous Province of Bolzano, the regions of Sardinia, Sicily and Tuscany.
The national mosaic (Figure 3) can be consulted on the IdroGEO national platform ( https://idrogeo. isprambiente. it/).