Giovanni Braca, Stefano Mariani
The indicator provides an evaluation of humidity conditions ( precipitation surplus compared to climatology ) and drought ( precipitation deficit compared to climatology ) to which the national territory is subject, in terms of status and trends. For each month from 1952 to 2025, the percentage of Italian territory subject to deficit and/or surplus precipitation conditions is expressed using the Standardized Precipitation Index (SPI) relating to the aggregate precipitation on the 3 and 12 month time scale.
Overall on a national scale, 2025 was characterized by substantially average precipitation, where however Northern Italy recorded a surplus while Central Italy, the South and the major islands continued to be characterized by a precipitation deficit, although less burdensome than the previous year.
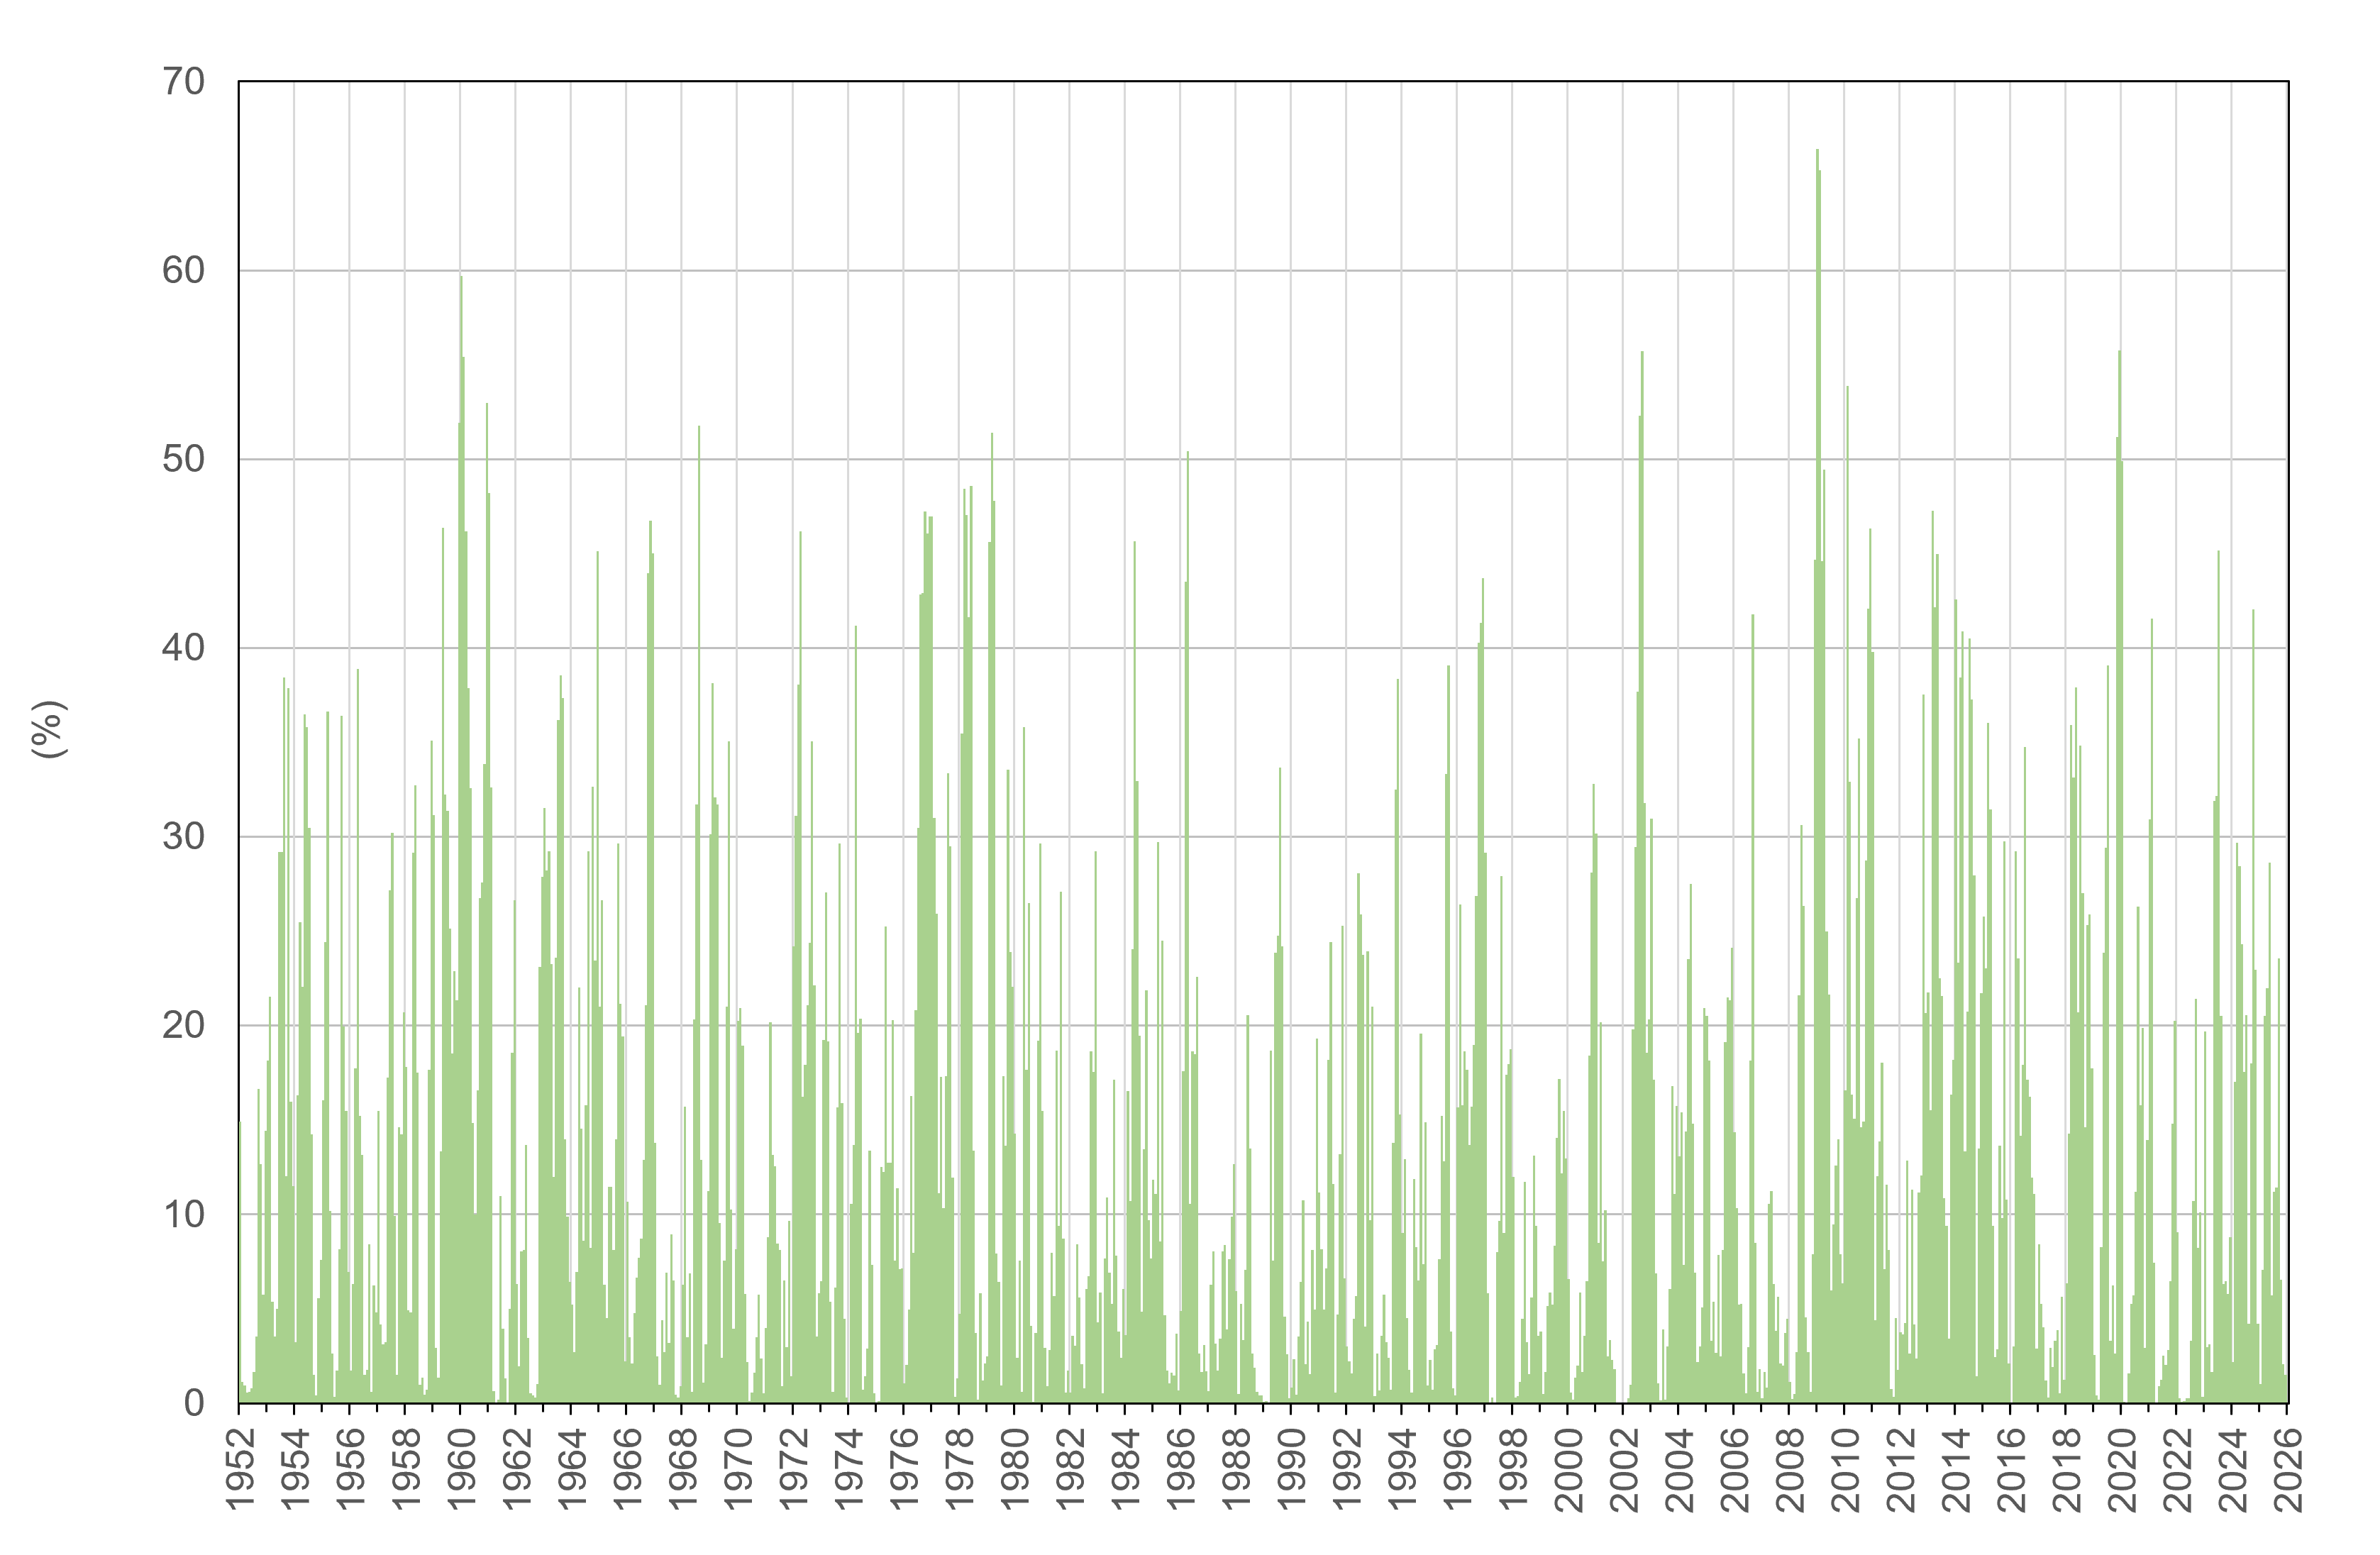
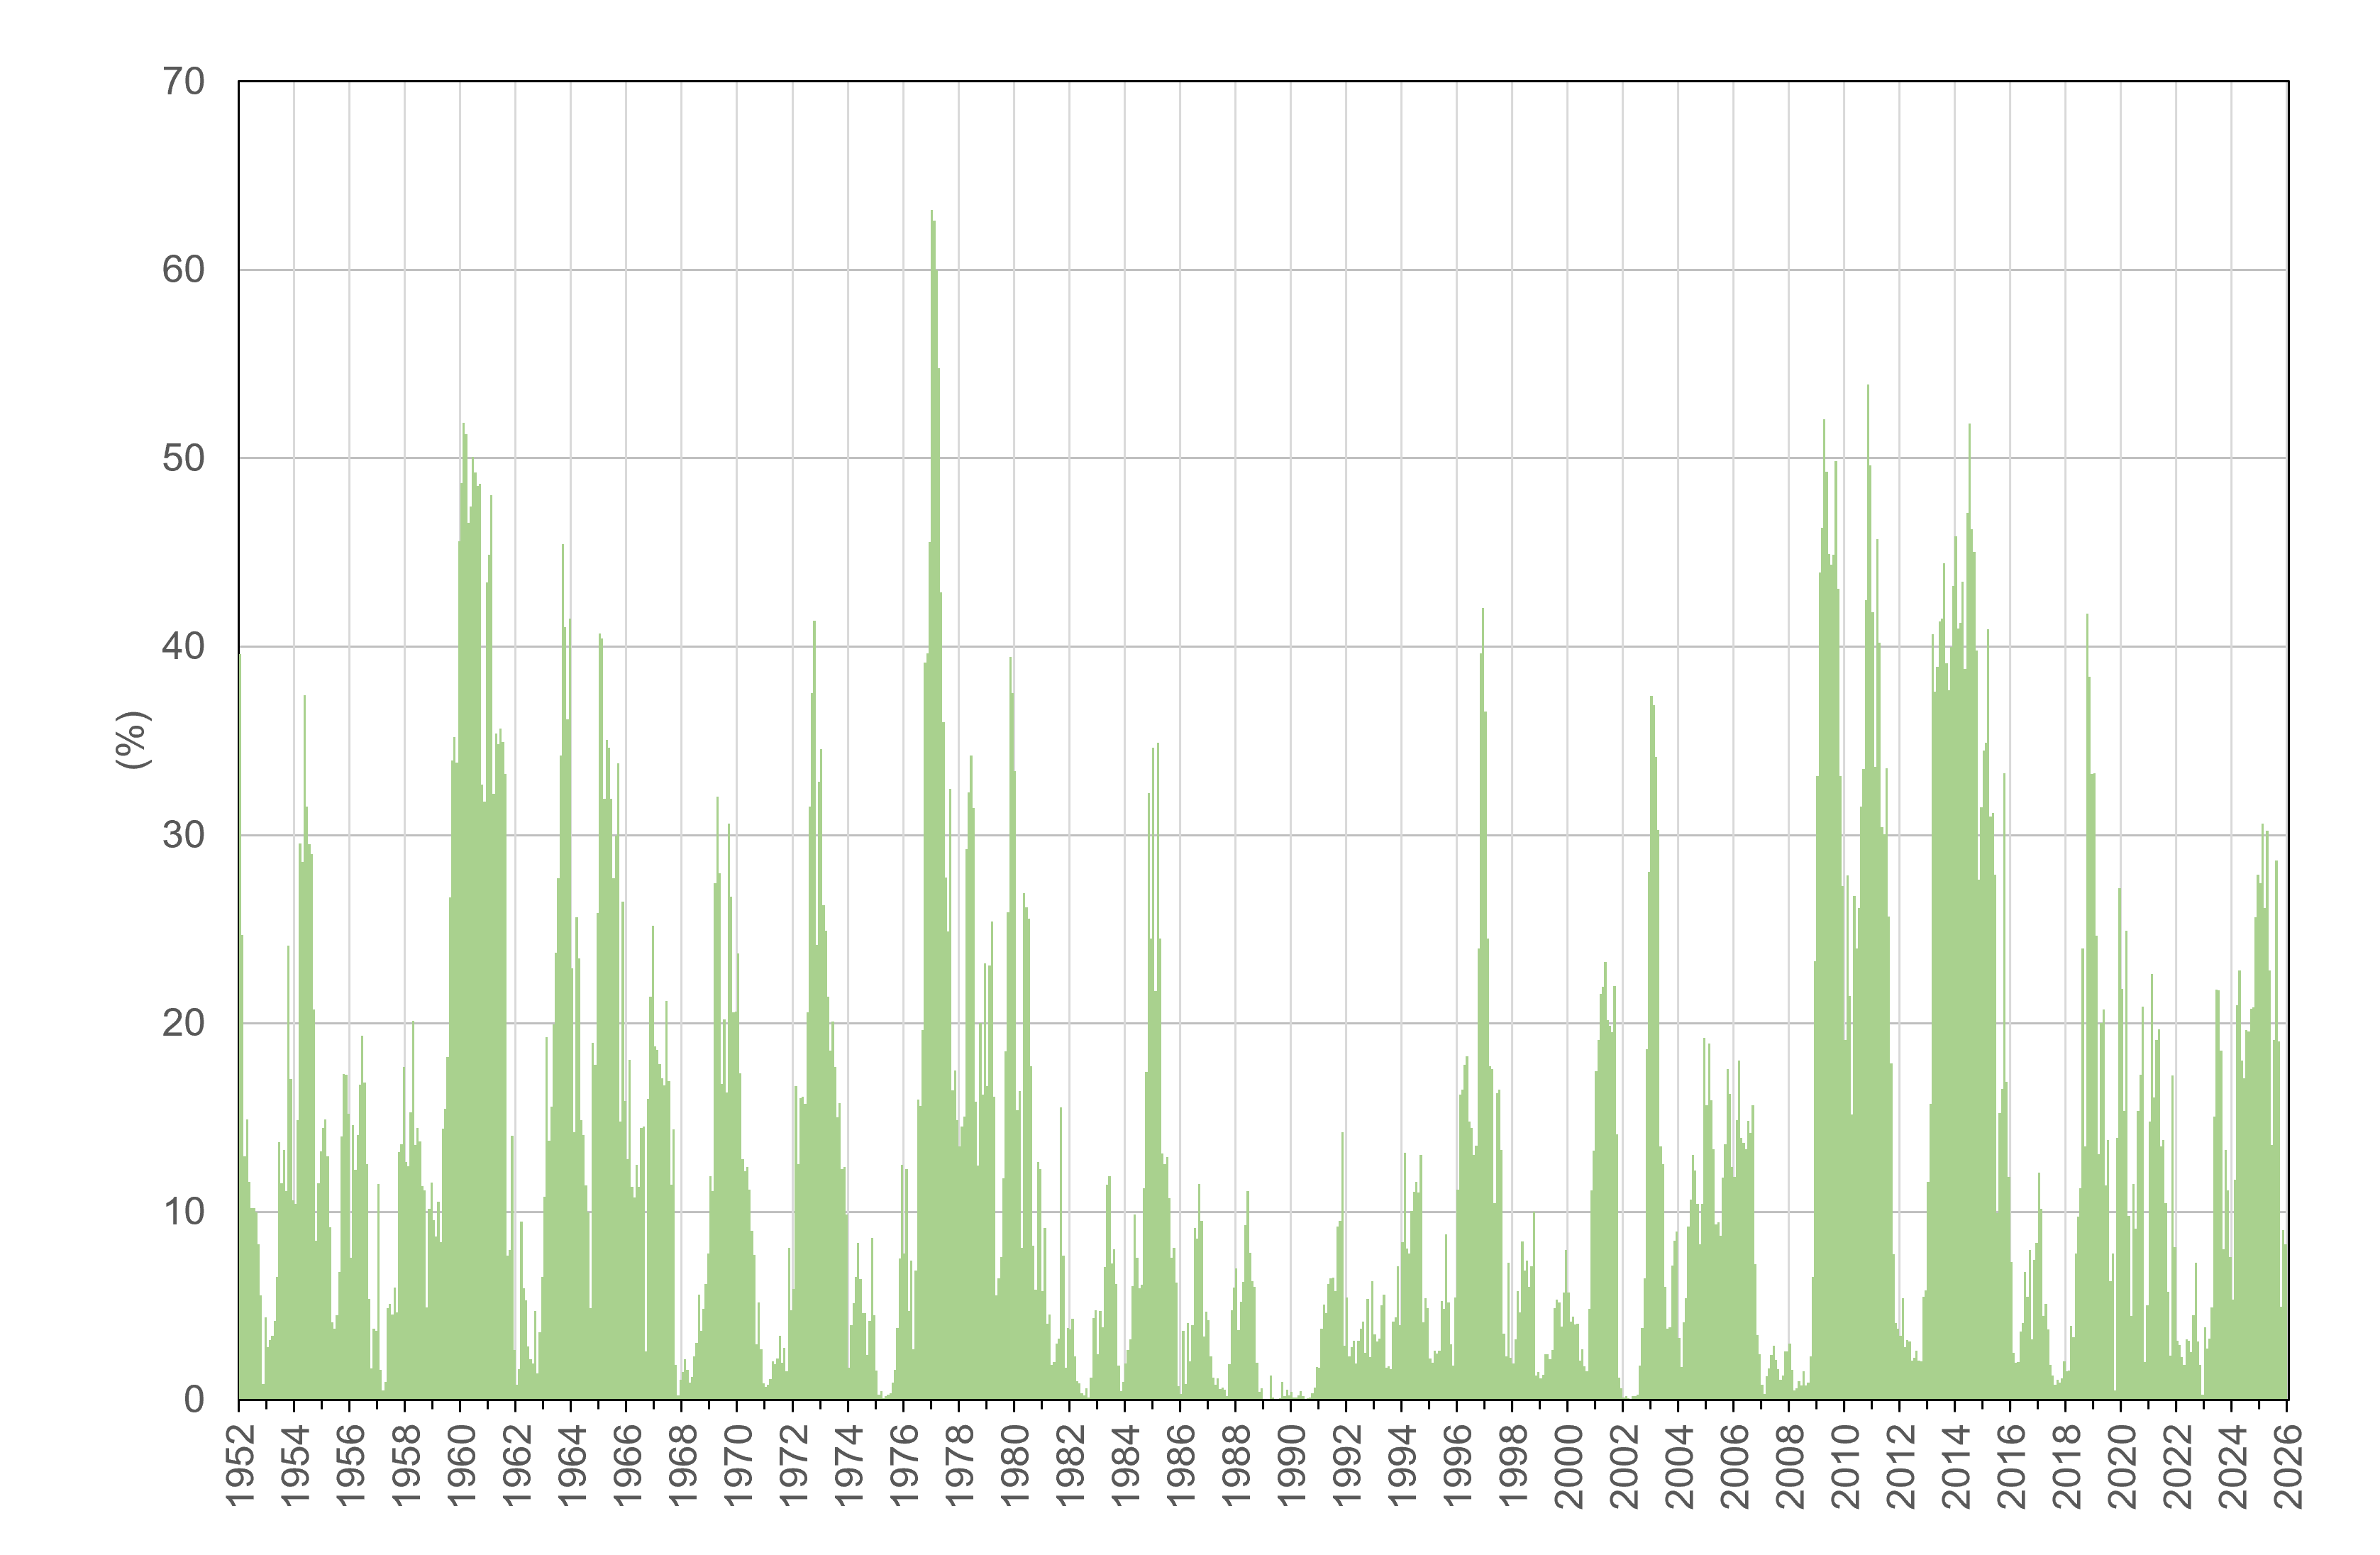
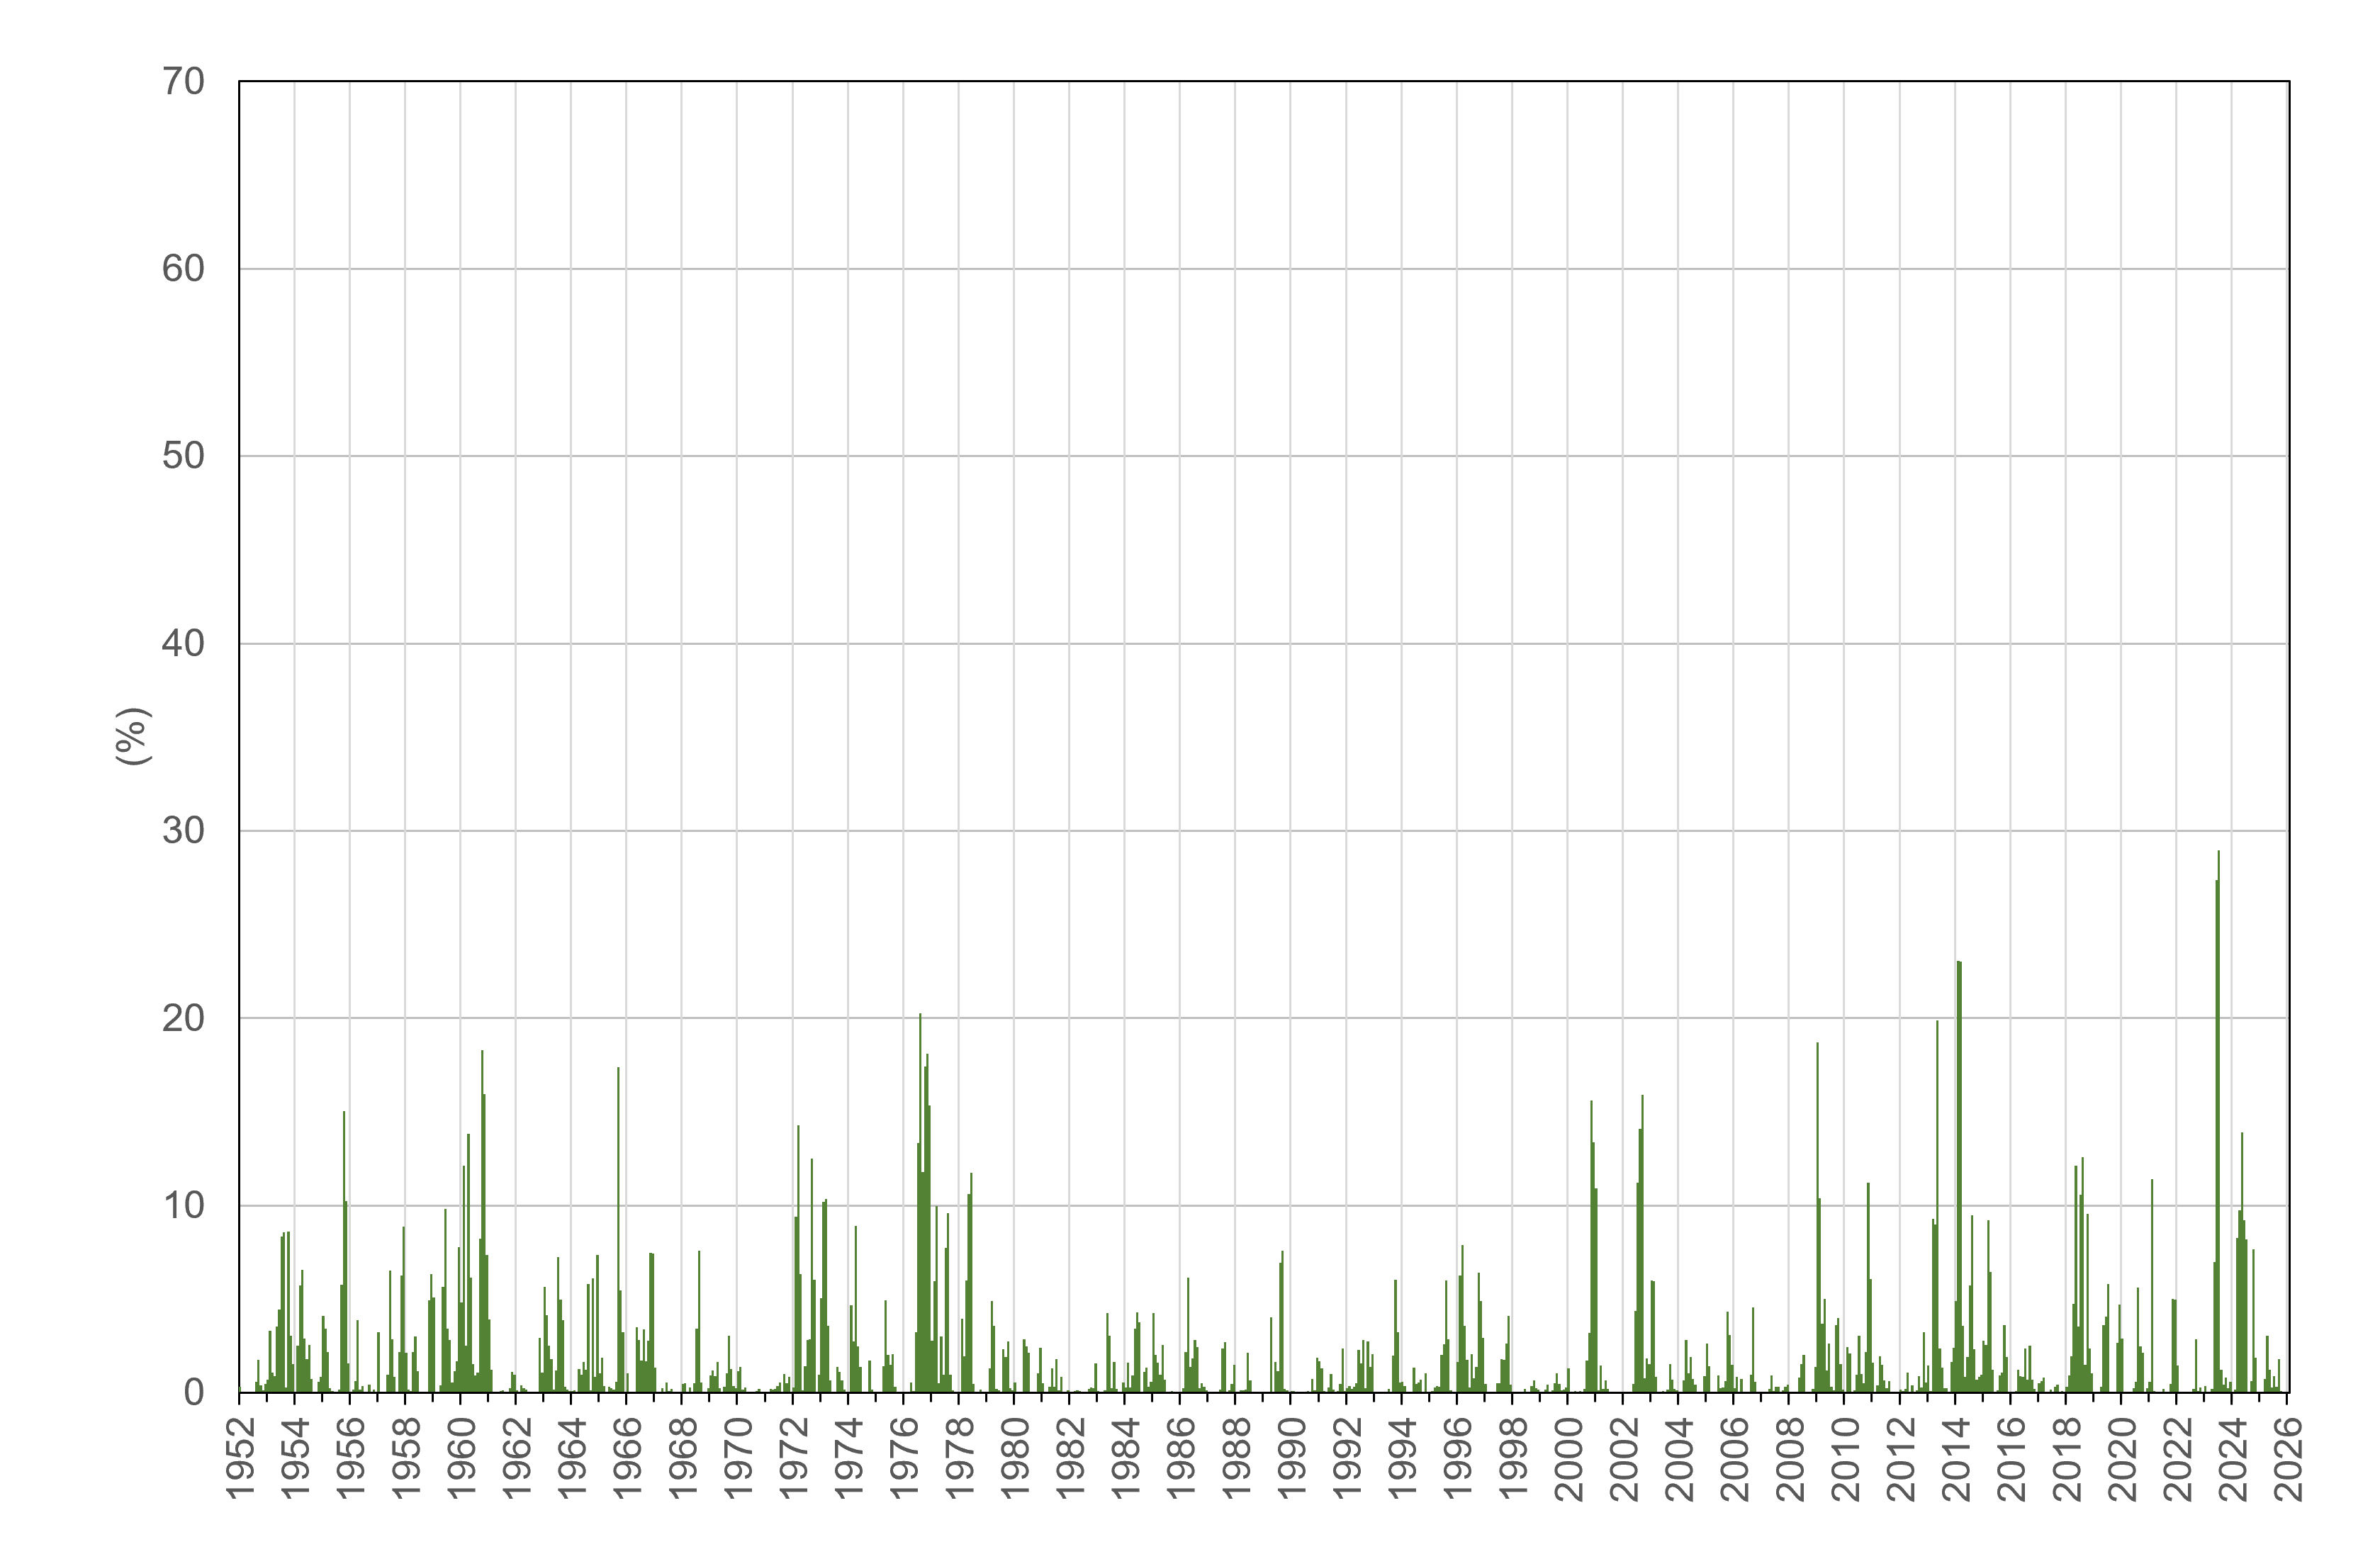
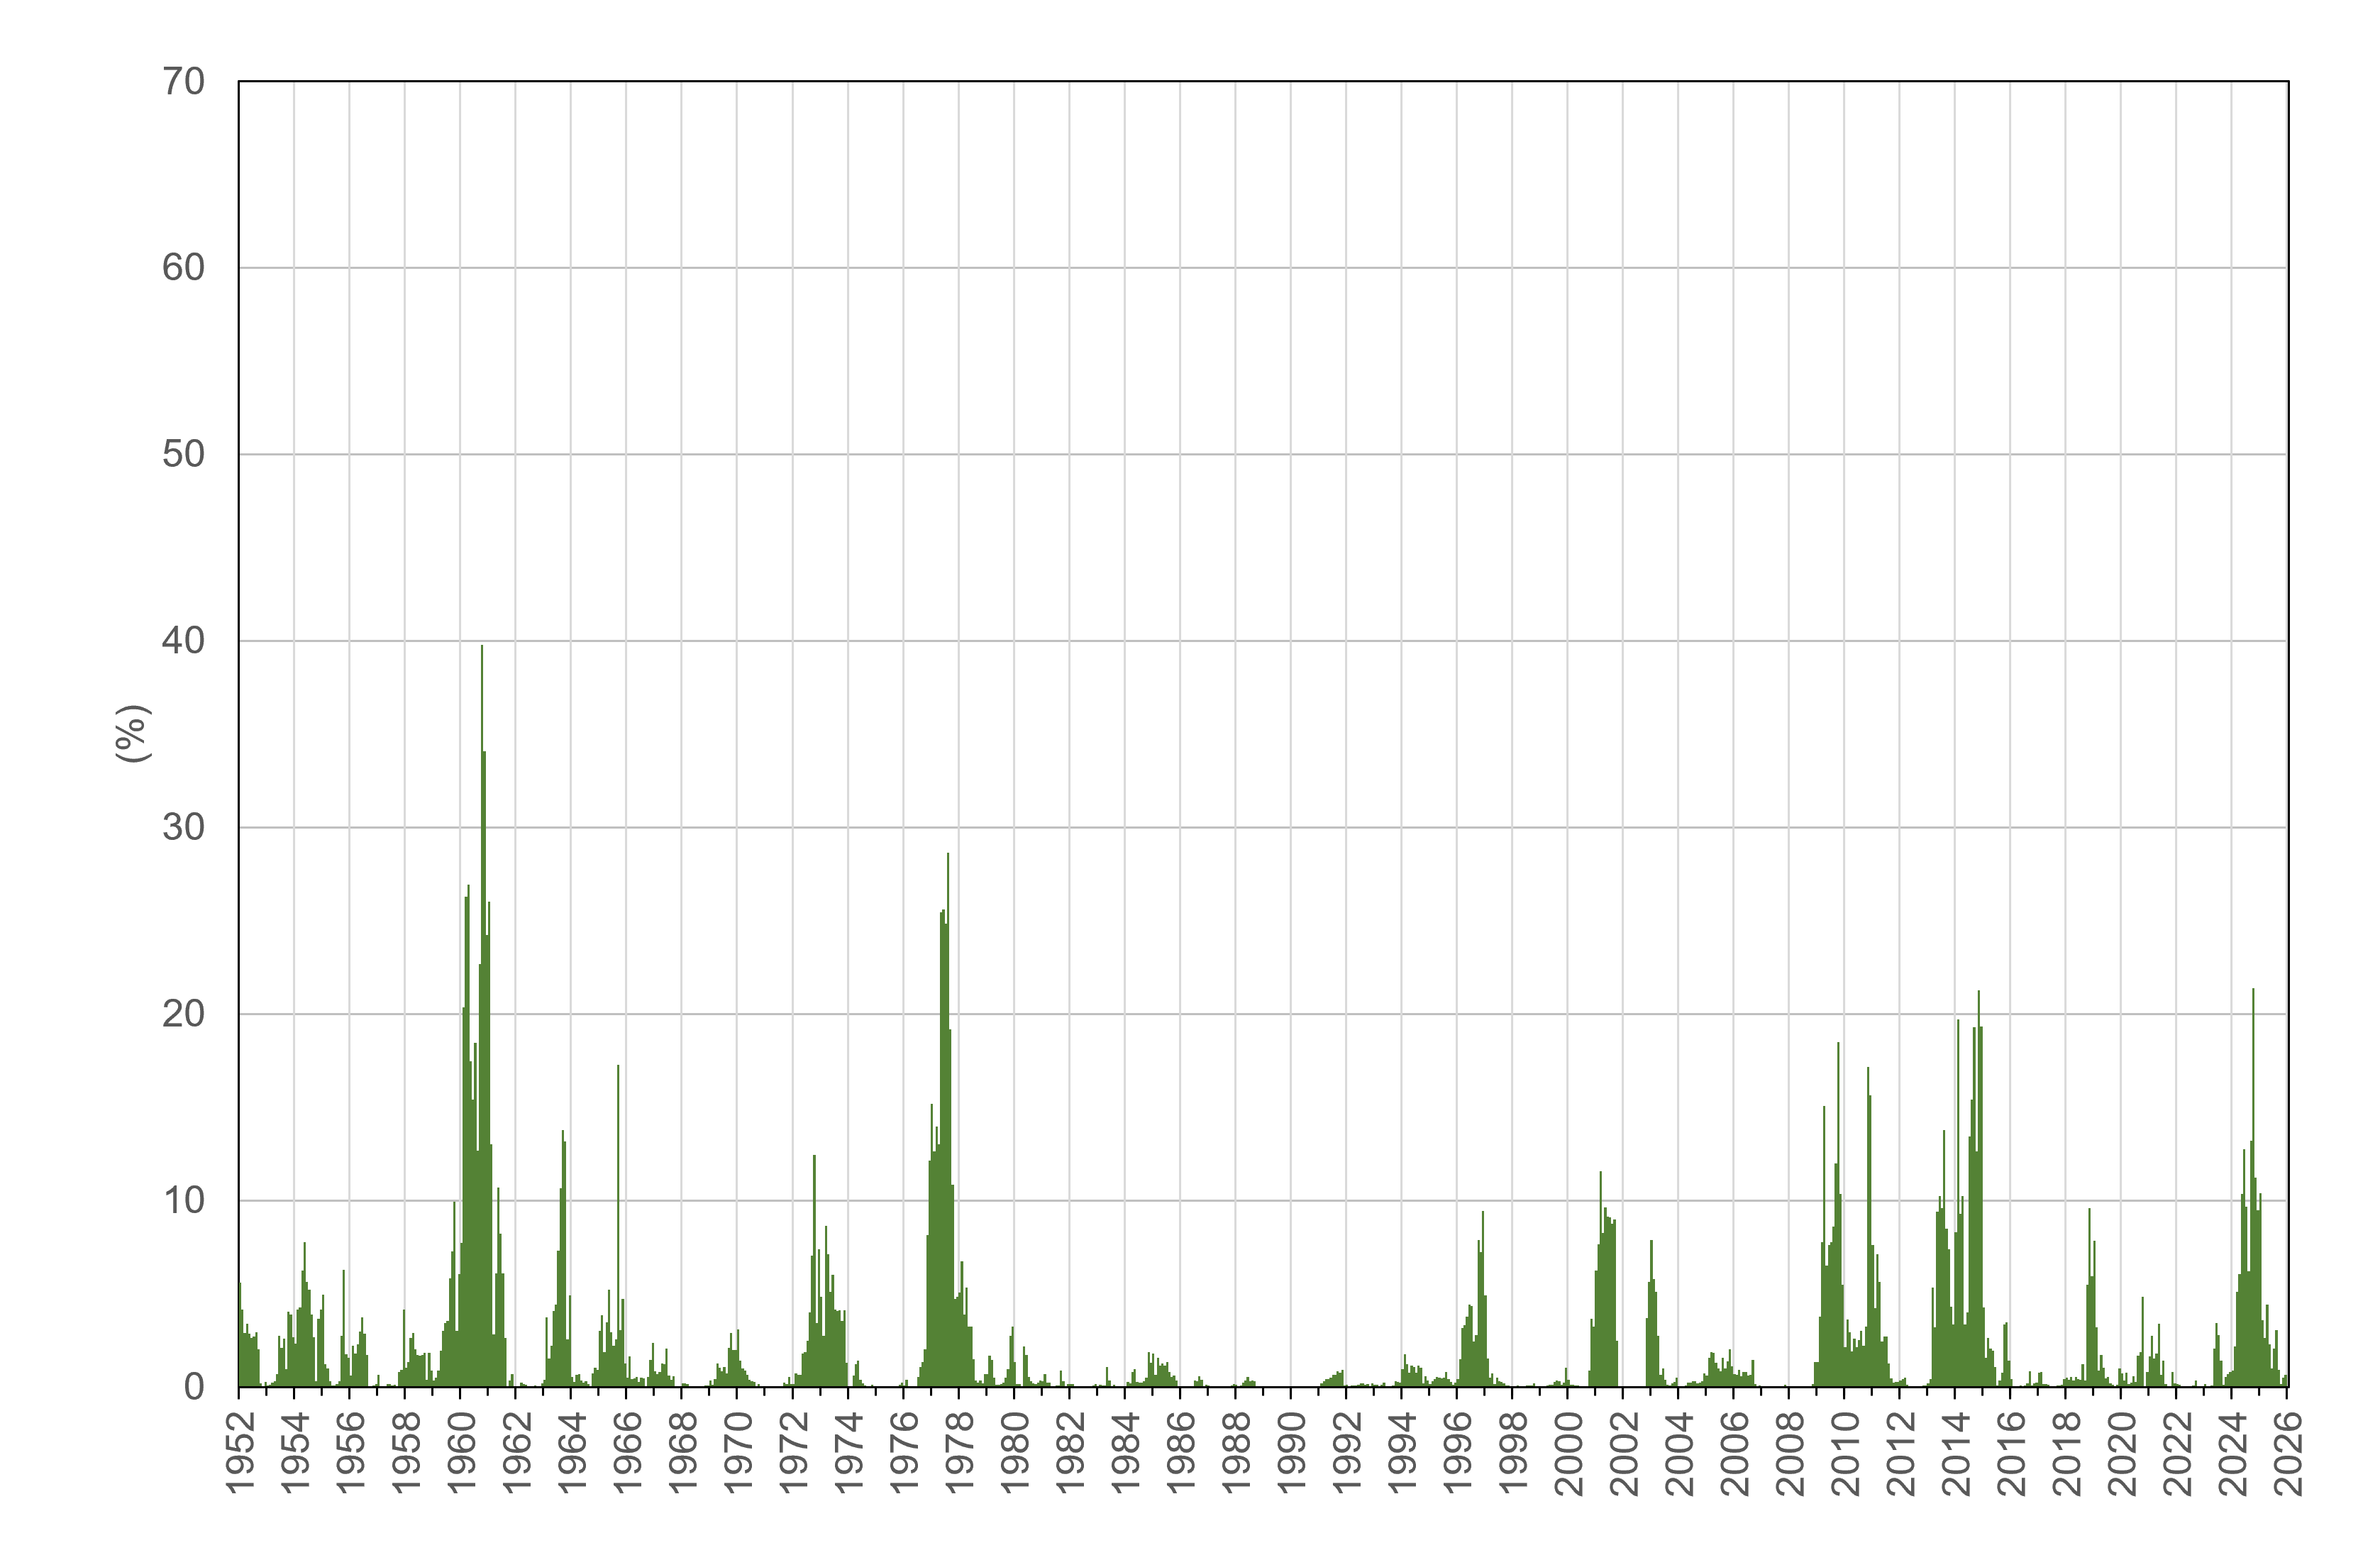
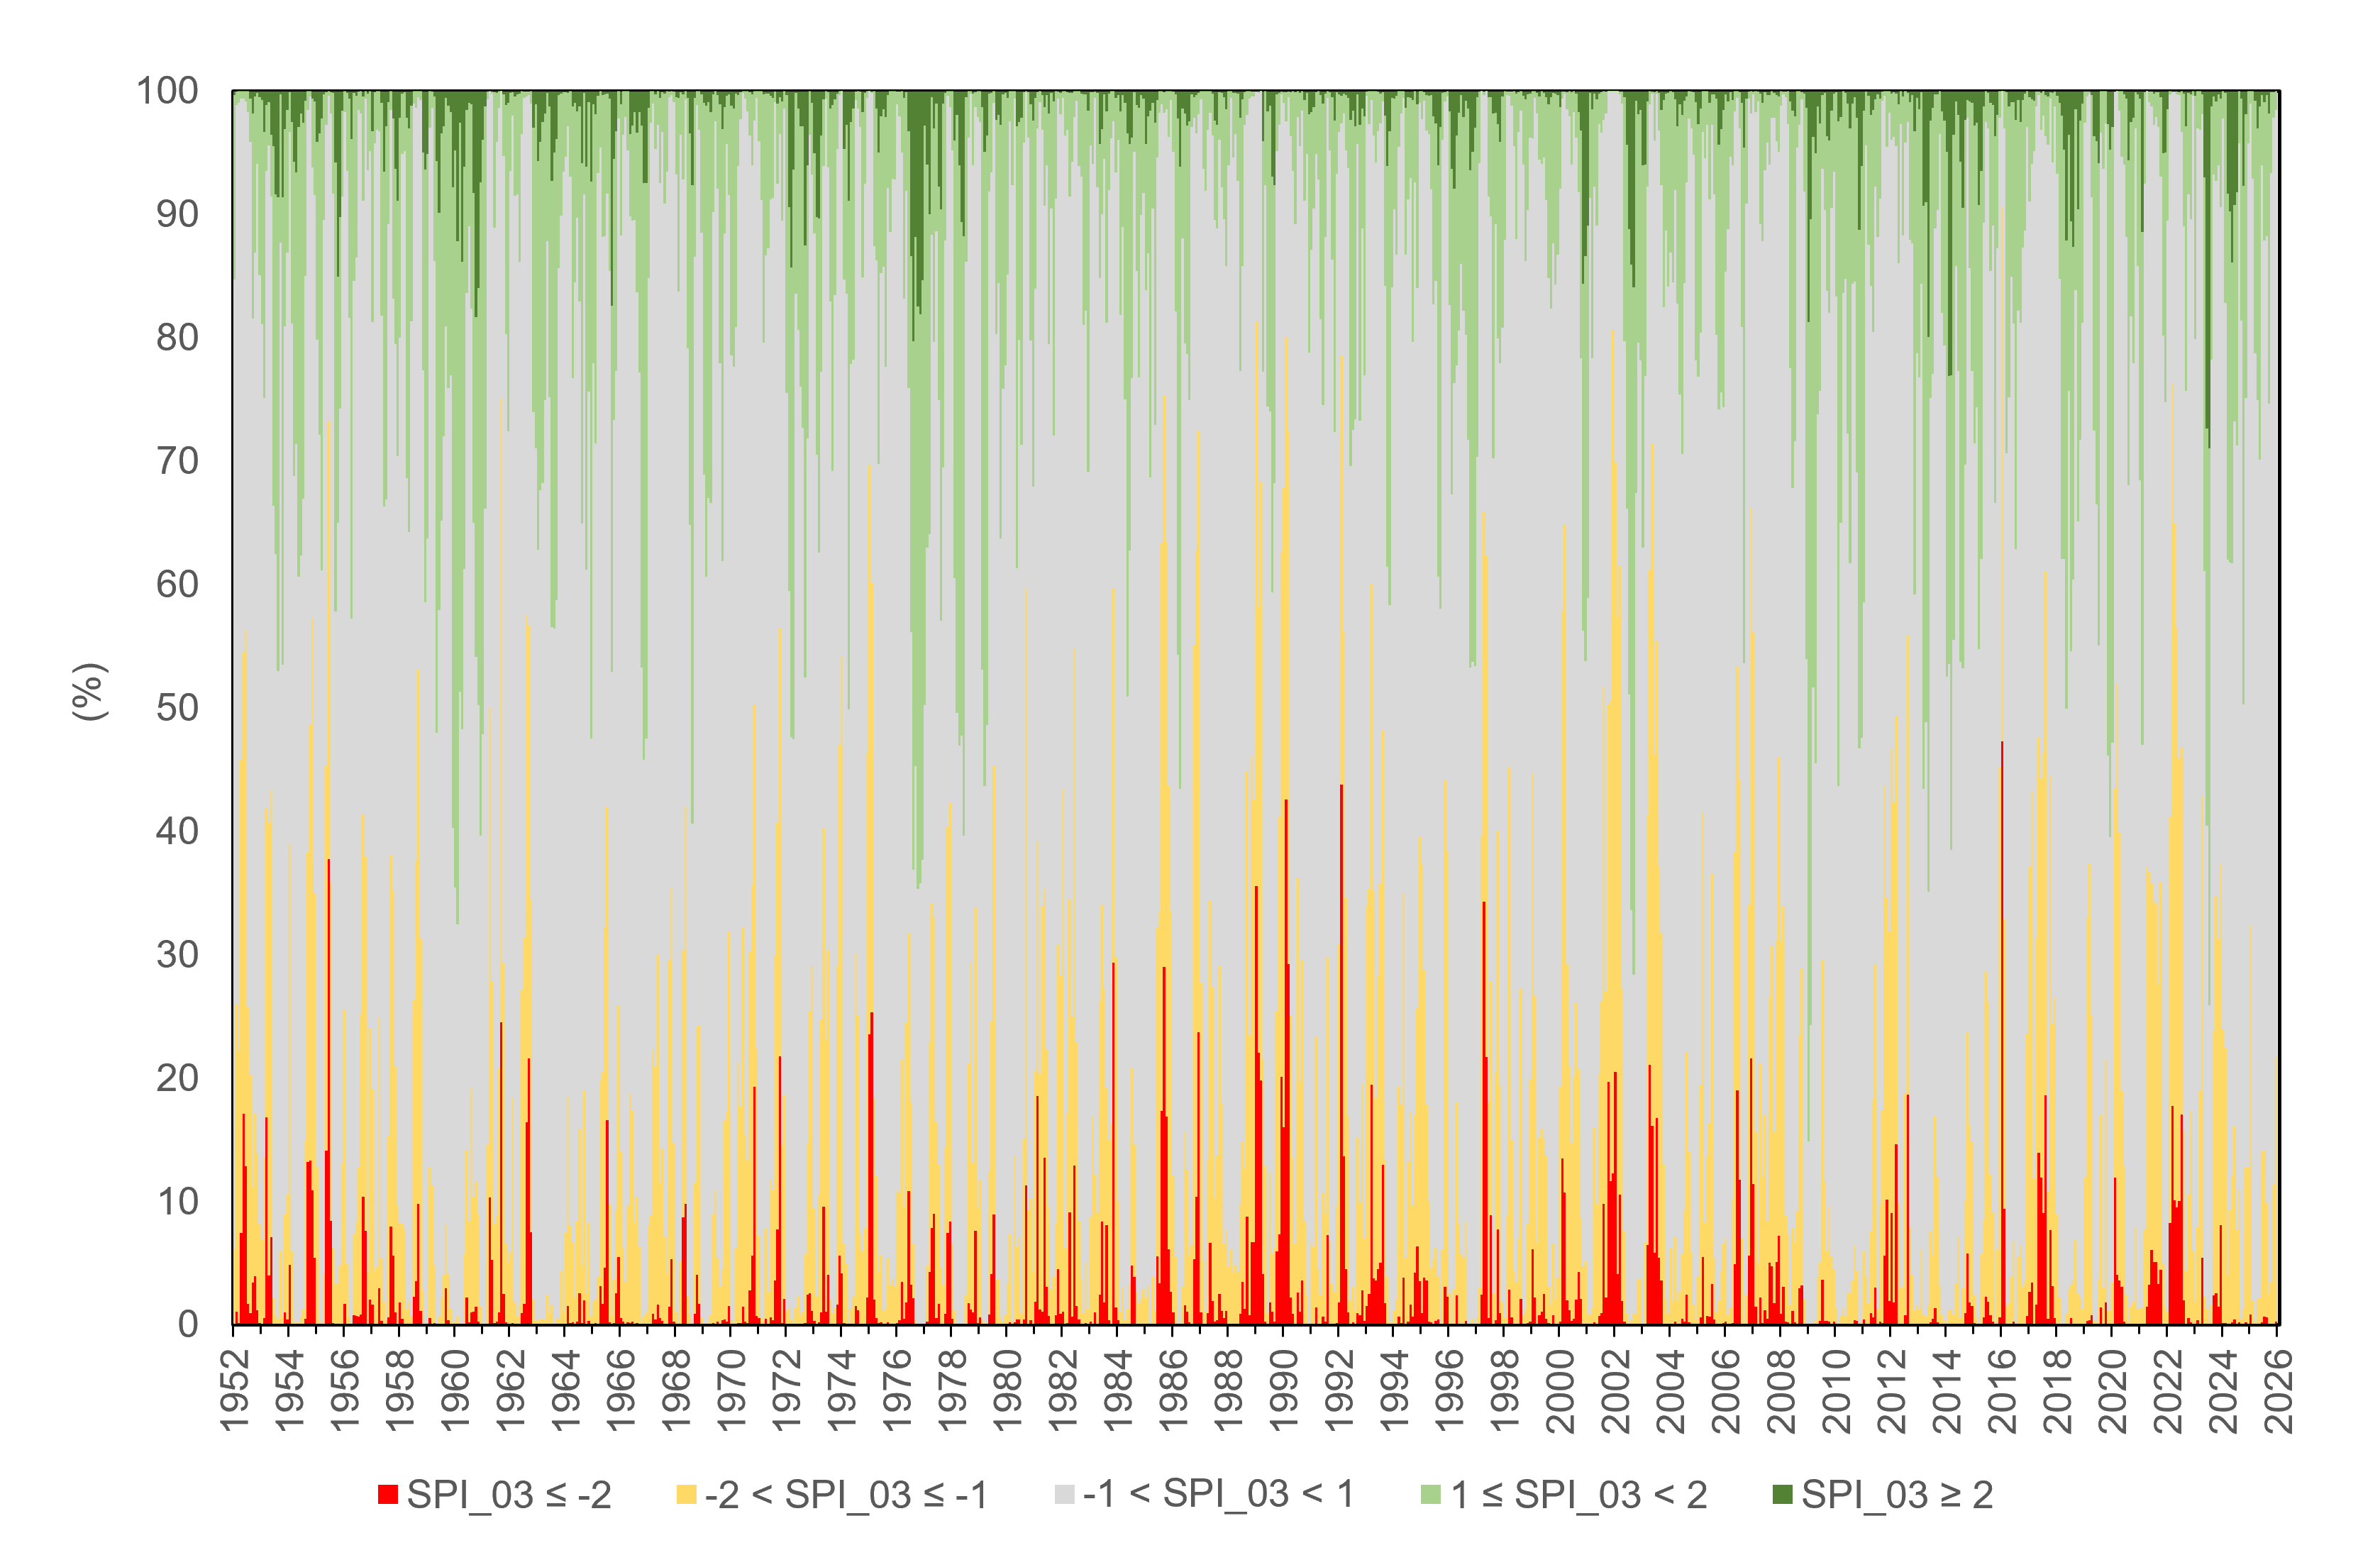
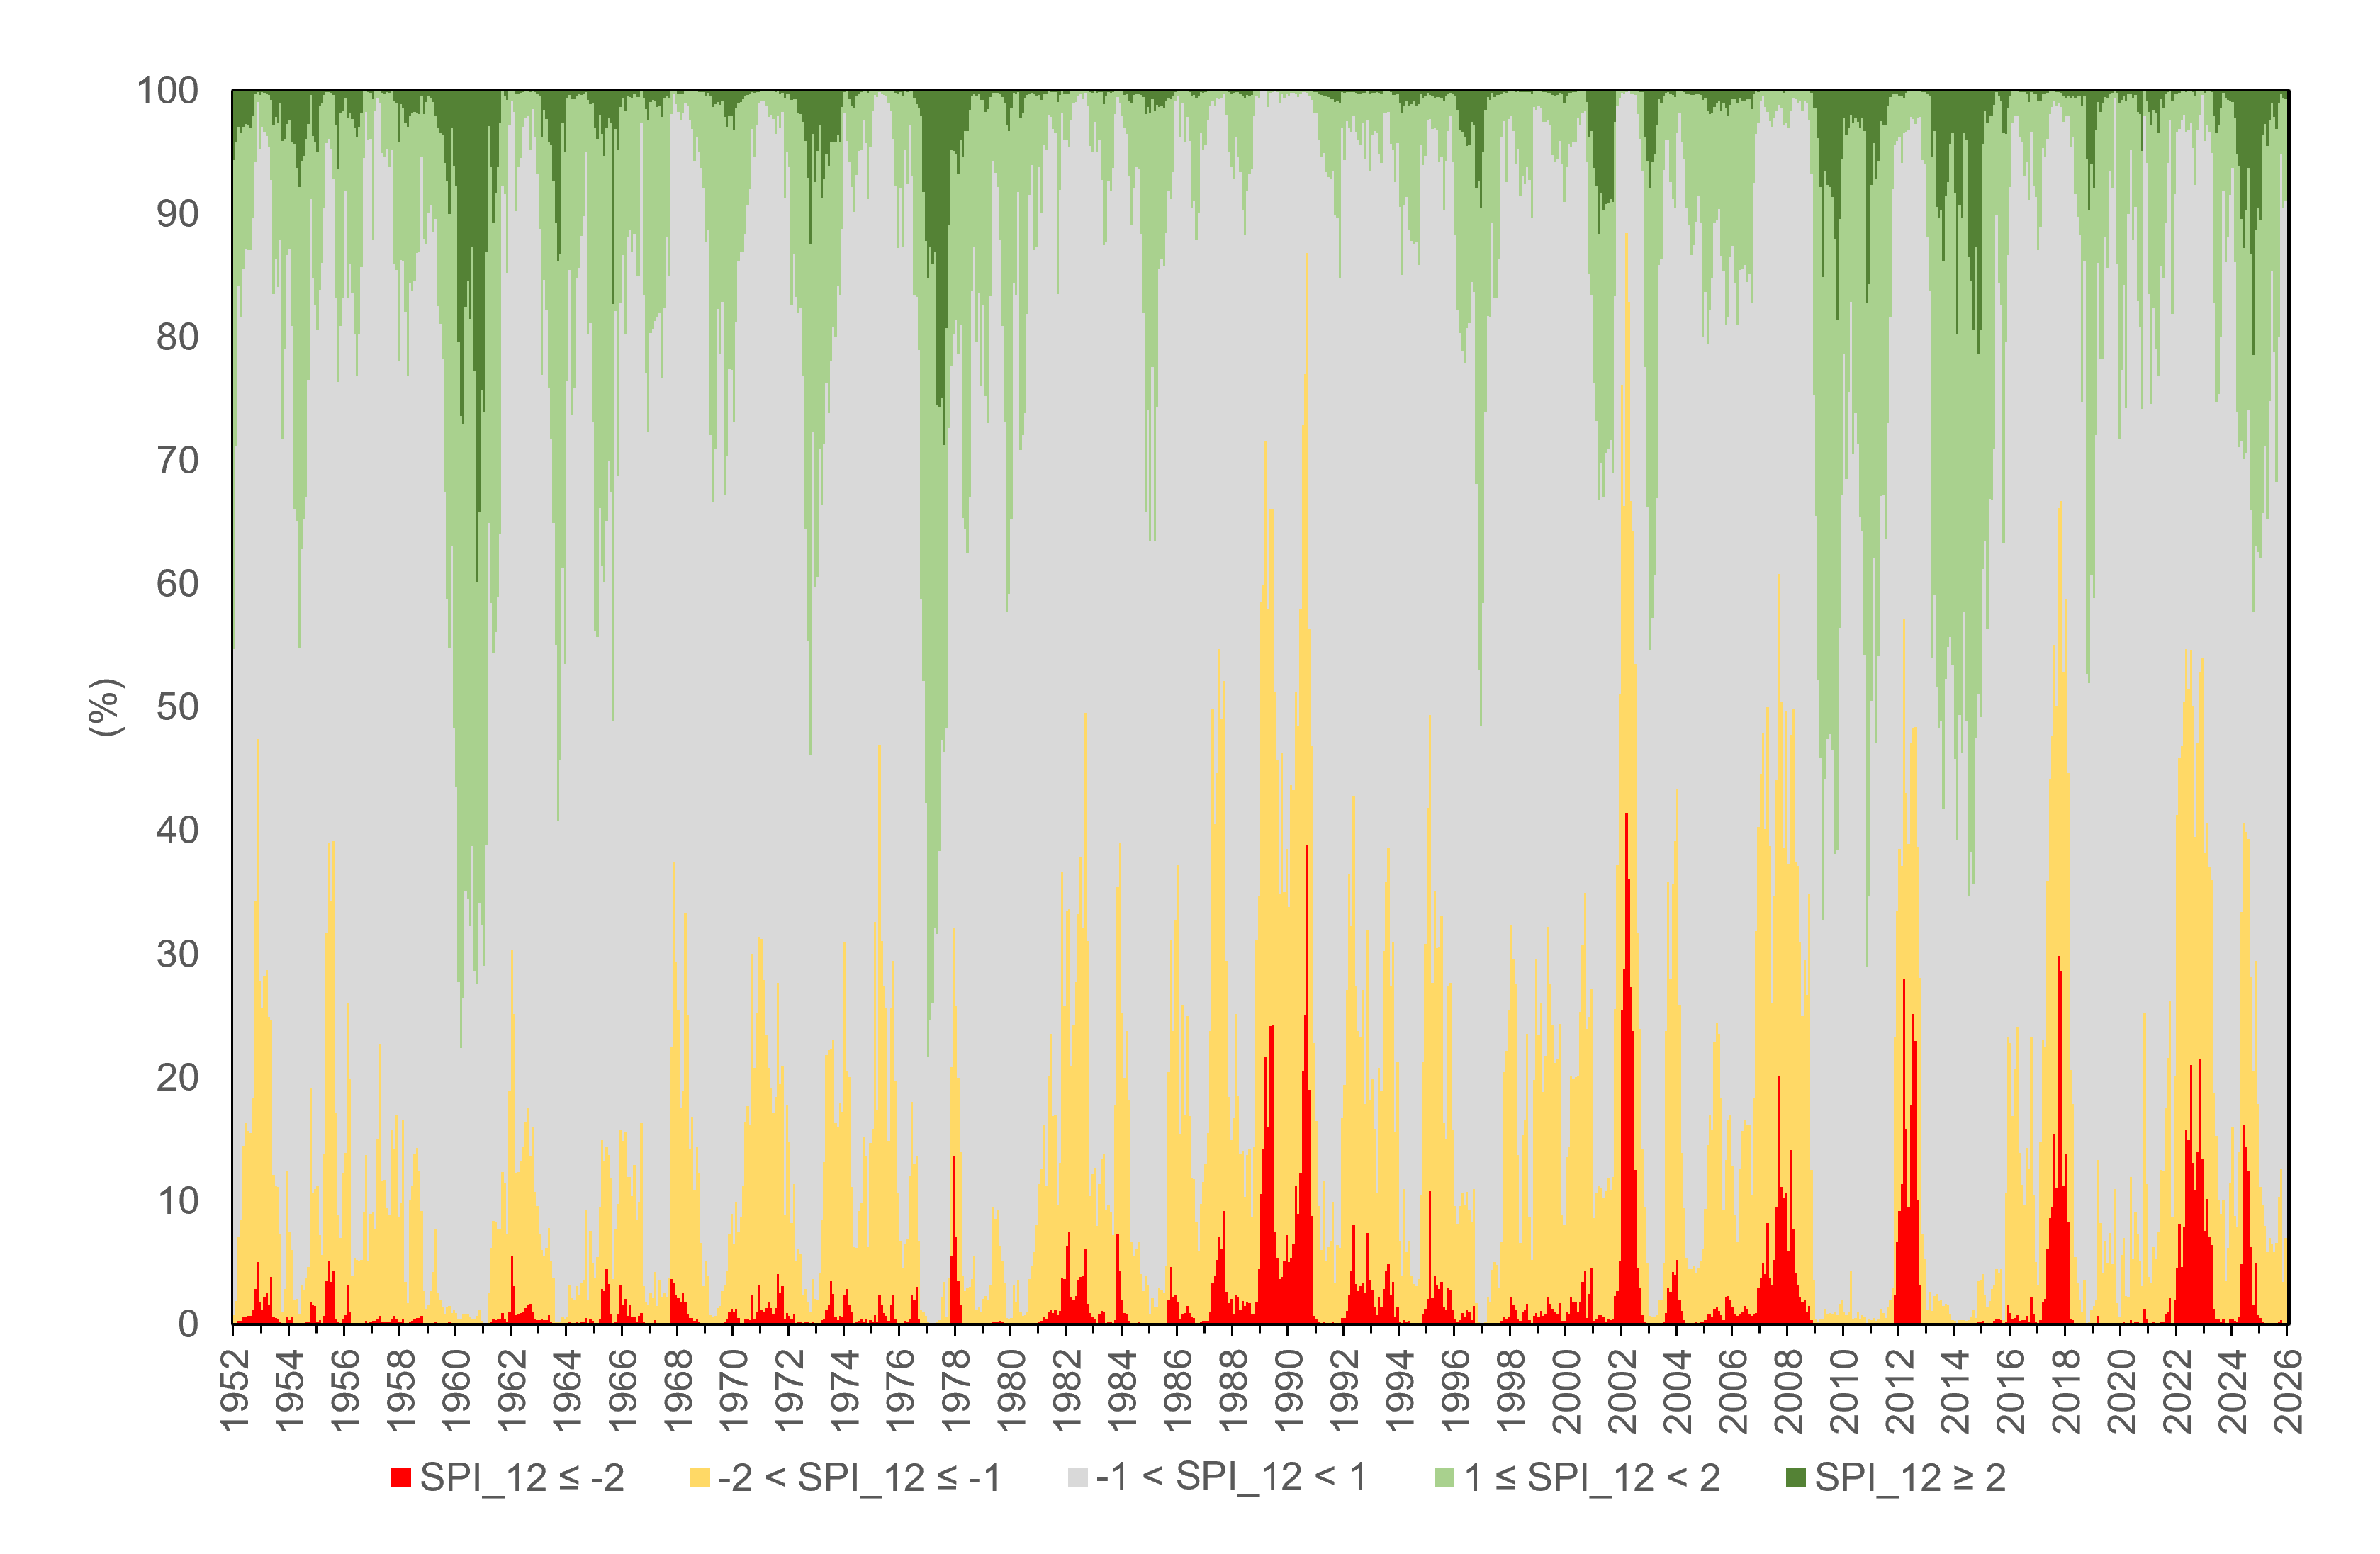
This determined maximum percentage values of the national territory characterized by "extreme drought" (SPI ≤ –2.0) equal to 0.86% and 0.5%, respectively for the cumulative precipitation over 3 months and that cumulative over 12 months. The maximum percentage of national territory characterized by "severe or moderate drought" (–2.0 < SPI ≤ –1.0) was, however, 31.6% on a time scale of 3 months and 12.2% on a time scale of 12 months. On the other hand, on the 3-month time scale, maximum values in the year of the percentage of the national territory characterized by "extreme humidity" (SPI ≥ 2.0) were 3.0%, while the maximum value relating to "severe or moderate humidity" (1.0 ≤ SPI < 2.0) was equal to 28.6%. On a 12-month time scale, the percentage of the country affected by “extreme humidity” reached a high of 10.4%, while the percentage with “severe or moderate humidity” reached a high of 30.6%.
The indicator is based on Standardized Precipitation Index (SPI) and evaluates for each month the percentages of territory subject to conditions of moderate or severe drought (–2.0 < SPI ≤ –1.0) or extreme drought (SPI ≤ –2.0) and the percentages of territory with conditions of moderate or severe humidity (1.0 ≤ SPI < 2.0) or extreme humidity (SPI ≥ 2.0). SPI values between –1.0 and 1.0 correspond to normal situations.
The application of the SPI on different time scales reflects the ways in which drought impacts the availability of water resources: calculated over short periods (3 months) it provides indications on soil humidity, while over medium or long periods (12 months) it provides indications on the reduction of river flows, on the availability of water in aquifers and on the storage of water volumes in natural and artificial reservoirs.
The indicator has been included at national level in the list of indicators for assessing the impacts of climate change on water resources ( https://climadat. isprambiente. it/).
At different time scales, the indicator is correlated with the conditions of deficit and/or surplus of water resources in a territory, thus making it possible to evaluate their frequency, extent and severity and highlight any trends, also in relation to the impact of climate change.
No regulatory references.
However, within the framework of the permanent district observatories on water use, the SPI, used for the calculation of this indicator, is included in the common set of indicators for the evaluation of drought and water scarcity conditions. Please note that the Observatories, established in 2016 for each river basin district as a measure of the Water Management Plan, pursuant to the Water Framework Directive 2000/60/EC, are currently also the body of the relevant District Basin Authority, pursuant to:
- Legislative Decree no. 152/2006, containing “Regulations on environmental matters” (Official Journal General Series no. 88 of 14-04-2006 - Ordinary Supplement no. 96).
- D. L. N. 39/2023, containing "Urgent provisions to combat water scarcity and for the strengthening and adaptation of water infrastructure" (Official Journal General Series no. 88 of 04-14-2023), converted with amendments by Law no. 68/2023 (Official Journal General Series no. 136 of 13-06-2023), in which the establishment of permanent district observatories on water uses at the district basin authorities was established by a primary regulation.
- European Water Resilience Strategy, adopted by the European Commission on 4 June 2025.
- Braca, G., Mariani, S., Lastoria, B., Piva, F., Archi, F., Botto, A., Casaioli, M., Forte, T., Marchetti, G., Peruzzi, C., Tropeano, R., Vendetti, C., and Bussettini, M., 2023: National hydrological balance: focus on drought and natural availability of renewable water resources. Update to 2022. Reports no. 388/2023, Rome https://www. isprambiente. gov. it/it/pubblicazioni/rapporti/bilancio-idrologico-nazionale-focus-su-siccita-e-disponibilita-naturale-della-risorsa-idrica-rinnovabile-formazione-al-2022.
- Braca, G., Bussettini, M., Lastoria, B., Mariani, S., and Piva F., 2021: The Gis BAsed Hydrological Balance at National Scale on Regular Grid – BIGBANG: methodology and estimates. Report on the natural availability of water resources. Reports no. 339/21, Rome. Available online at: https://www. isprambiente. gov. it/it/pubblicazioni/rapporti/il-bilancio-idrologico-gis-based-a-scala-nazionale-su-griglia-regolare-bigbang .
- Mariani, S., Braca, G., Lastoria, B., Tropeano, R., Casaioli, M., Piva, F., Bussettini, M., 2024: “The hydrological balance, the availability of water resources and the water balance”, in Drought, scarcity and water crises, Emanuele Romano, Ivan Portoghese (ed.), Habitat signa 1, 29-46. Rome: Cnr Editions. Available online at: https://www. cnr. it/sites/default/files/public/media/attivita/editoria/SiccitaInterattiva_ver2. pdf .
- Mariani, S., and AA. VV., 2020: Technical notes on water crises, drought and integrated water service – UTILITALIA Manual. ISBN: 978 88 998 7903 7.
- Mariani, S., Braca, G., Romano, E., Lastoria, B. And Bussettini, M., 2018: Guidelines on Drought and Water Scarcity Indicators to be used in the Activities of the Permanent Observatories for Water Use, CReIAMO PA project publication, 66 pp. Available online at: http://www. isprambiente. gov. it/pre_meteo/idro/Osservatori/Linee%20Guida%20Publicazione%20Finale%20L6WP1_con%20copertina_ec. pdf .
- McKee, T. B., Doesken, N. J., and Kleist, J., 1993: The relationship of drought frequency and duration of time scales. Eighth Conference on Applied Climatology, American Meteorological Society, Jan 17–23, 1993, Anaheim CA, pp. 179–186.
- WMO, 2012: Standardized Precipitation Index User Guide, WMO-No. 1090, Geneva.
Further references:
- SPI grid ASCII file database Standardized Precipitation Index and the SPEI- Standardized Precipitation Evapotranspiration Index , calculated on Italy months from 1952 to 2025. Available online at: https://groupware. sinanet. isprambiente. it/bigbang-data/library/bigbang100/ascii_grid .
- SPI images Standardized Precipitation Index and the SPEI- Standardized Precipitation Evapotranspiration Index , calculated on Italy from 1952 to 2025. Available online at: https://groupware. sinanet. isprambiente. it/bigbang-data/library/bigbang100/figures .
- Portal of "The state of national water severity", with links to the portals of the permanent district observatories for water uses. Available online at: https://www. isprambiente. gov. it/pre_meteo/idro/SeverIdrica. html .
- “Climate change impact indicators” database. Available online on the portal: https://climadat. isprambiente. it/.
- News on the use of Sentinel-2 satellite data from the European Copernicus Program to quantify the impact of the 2022 drought on the constituent components (morphological macro-units "water", "vegetation" and "sediment") of the Po River. Available online at: https://www. isprambiente. gov. it/it/archivio/notizie-e-novita-normative/notizie-ispra/2022/08/monitoraggio-siccita-copernicus .
-
-
The precipitation data used are mostly those collected and published by the regional and provincial structures to which, based on art. 92 of Legislative Decree no. 112 of 31 March 1998, the functions and tasks of the peripheral offices of the National Hydrographic and Mareographic Service (SIMN, now merged into ISPRA) of the Department for National Technical Services were transferred. The precipitation data used in the development of the indicator can be accessed by consulting the institutions' websites or by making an appropriate request. The data are aggregated at the monthly scale on the regular BIGBANG grid of 1 km resolution, which covers the entire national territory, and are available on the ISPRA Groupware portal ( https://groupware. sinanet. isprambiente. it/bigbang-data/library/bigbang100).
National
1952–2025
The SPI index is calculated on the basis of the monthly precipitation grids produced by the BIGBANG model, version 10.0, and aggregated over 3 and 12 month intervals. SPI index maps with 1 km resolution are thus produced on which the percentage of the national territory characterized by SPI values ≤ –2.0 (extreme drought), –2.0 < SPI ≤ –1.0 (moderate or severe drought), –1.0 < SPI < 1.0 (normal situation), 1.0 ≤ SPI < 2.0 (moderate or severe humidity) and SPI ≥ are determined. 2.0 (extreme humidity).
Since the evaluation of the SPI depends on the length of the historical series of rainfall used and since the historical series increase every year, it follows that for the same instant in time from year to year the value of SPI can change slightly as well as the consequent evaluations on the percentage of national territory falling into the 5 categories indicated above.
For each temporal aggregation considered (3 months and 12 months) and for each SPI class, the state assessment is carried out considering the average of the twelve monthly values of 2025 (hereinafter indicated as " average percentage") compared with the average of the 1952–2025 time series.
In 2025, the average percentage of the territory falling within the normal situation (–1.0 < SPI at 12 months < 1.0) was equal to 69.5%, in line with the corresponding average of the series (67.9%). The average percentage of the territory characterized by SPI values lower than or equal to –1.0 (all drought classes) was lower than the corresponding long-term average, while the average percentage of the territory characterized by SPI values higher than or equal to 1.0 (all humidity classes) was lower than the average.
The average percentage of the territory characterized by 3-month SPI values falling within the normal situation (–1.0 < SPI < 1.0) is equal to 77.8%, higher than the corresponding average of the series (68.0%). The average percentages of territory characterized by 3-month SPI values indicating extreme drought (SPI ≤ –2.0) were lower than the long-term average, as were those indicating moderate or severe drought (–2.0 < SPI ≤ –1.0). On the other hand, the average percentage of the territory characterized by SPI values greater than or equal to 1.0 (all humidity classes) was higher than the corresponding long-term average.
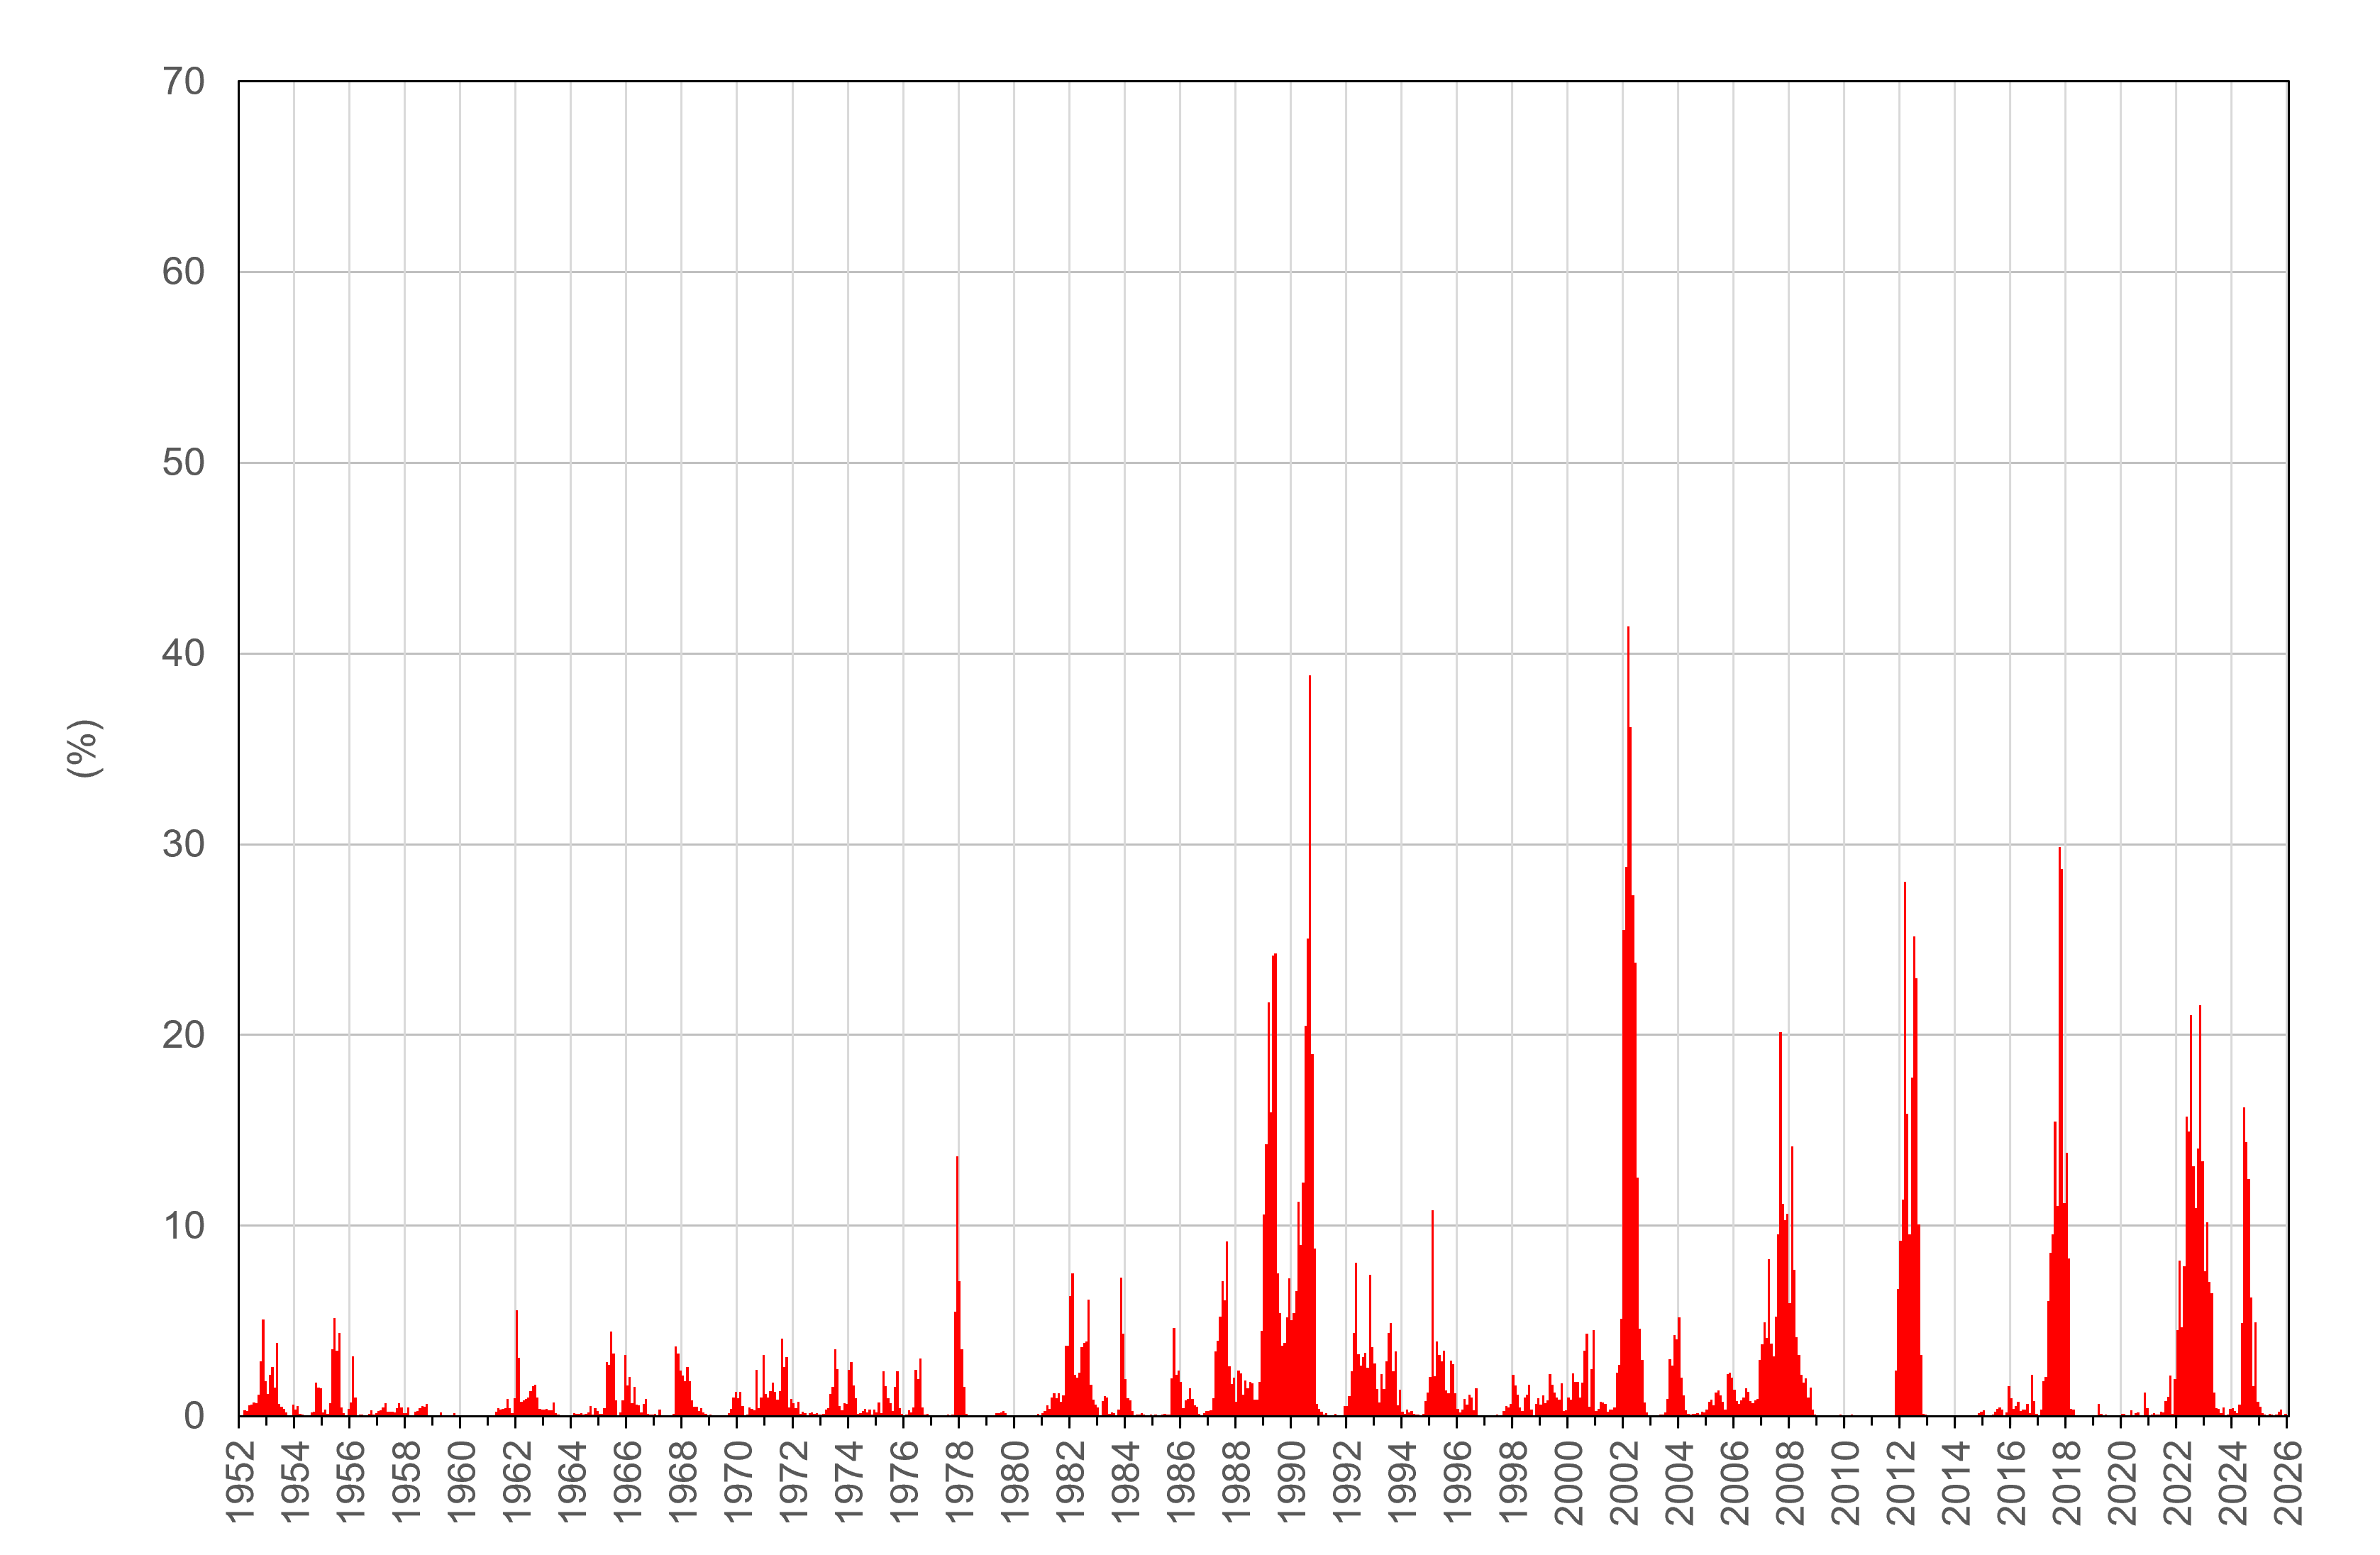
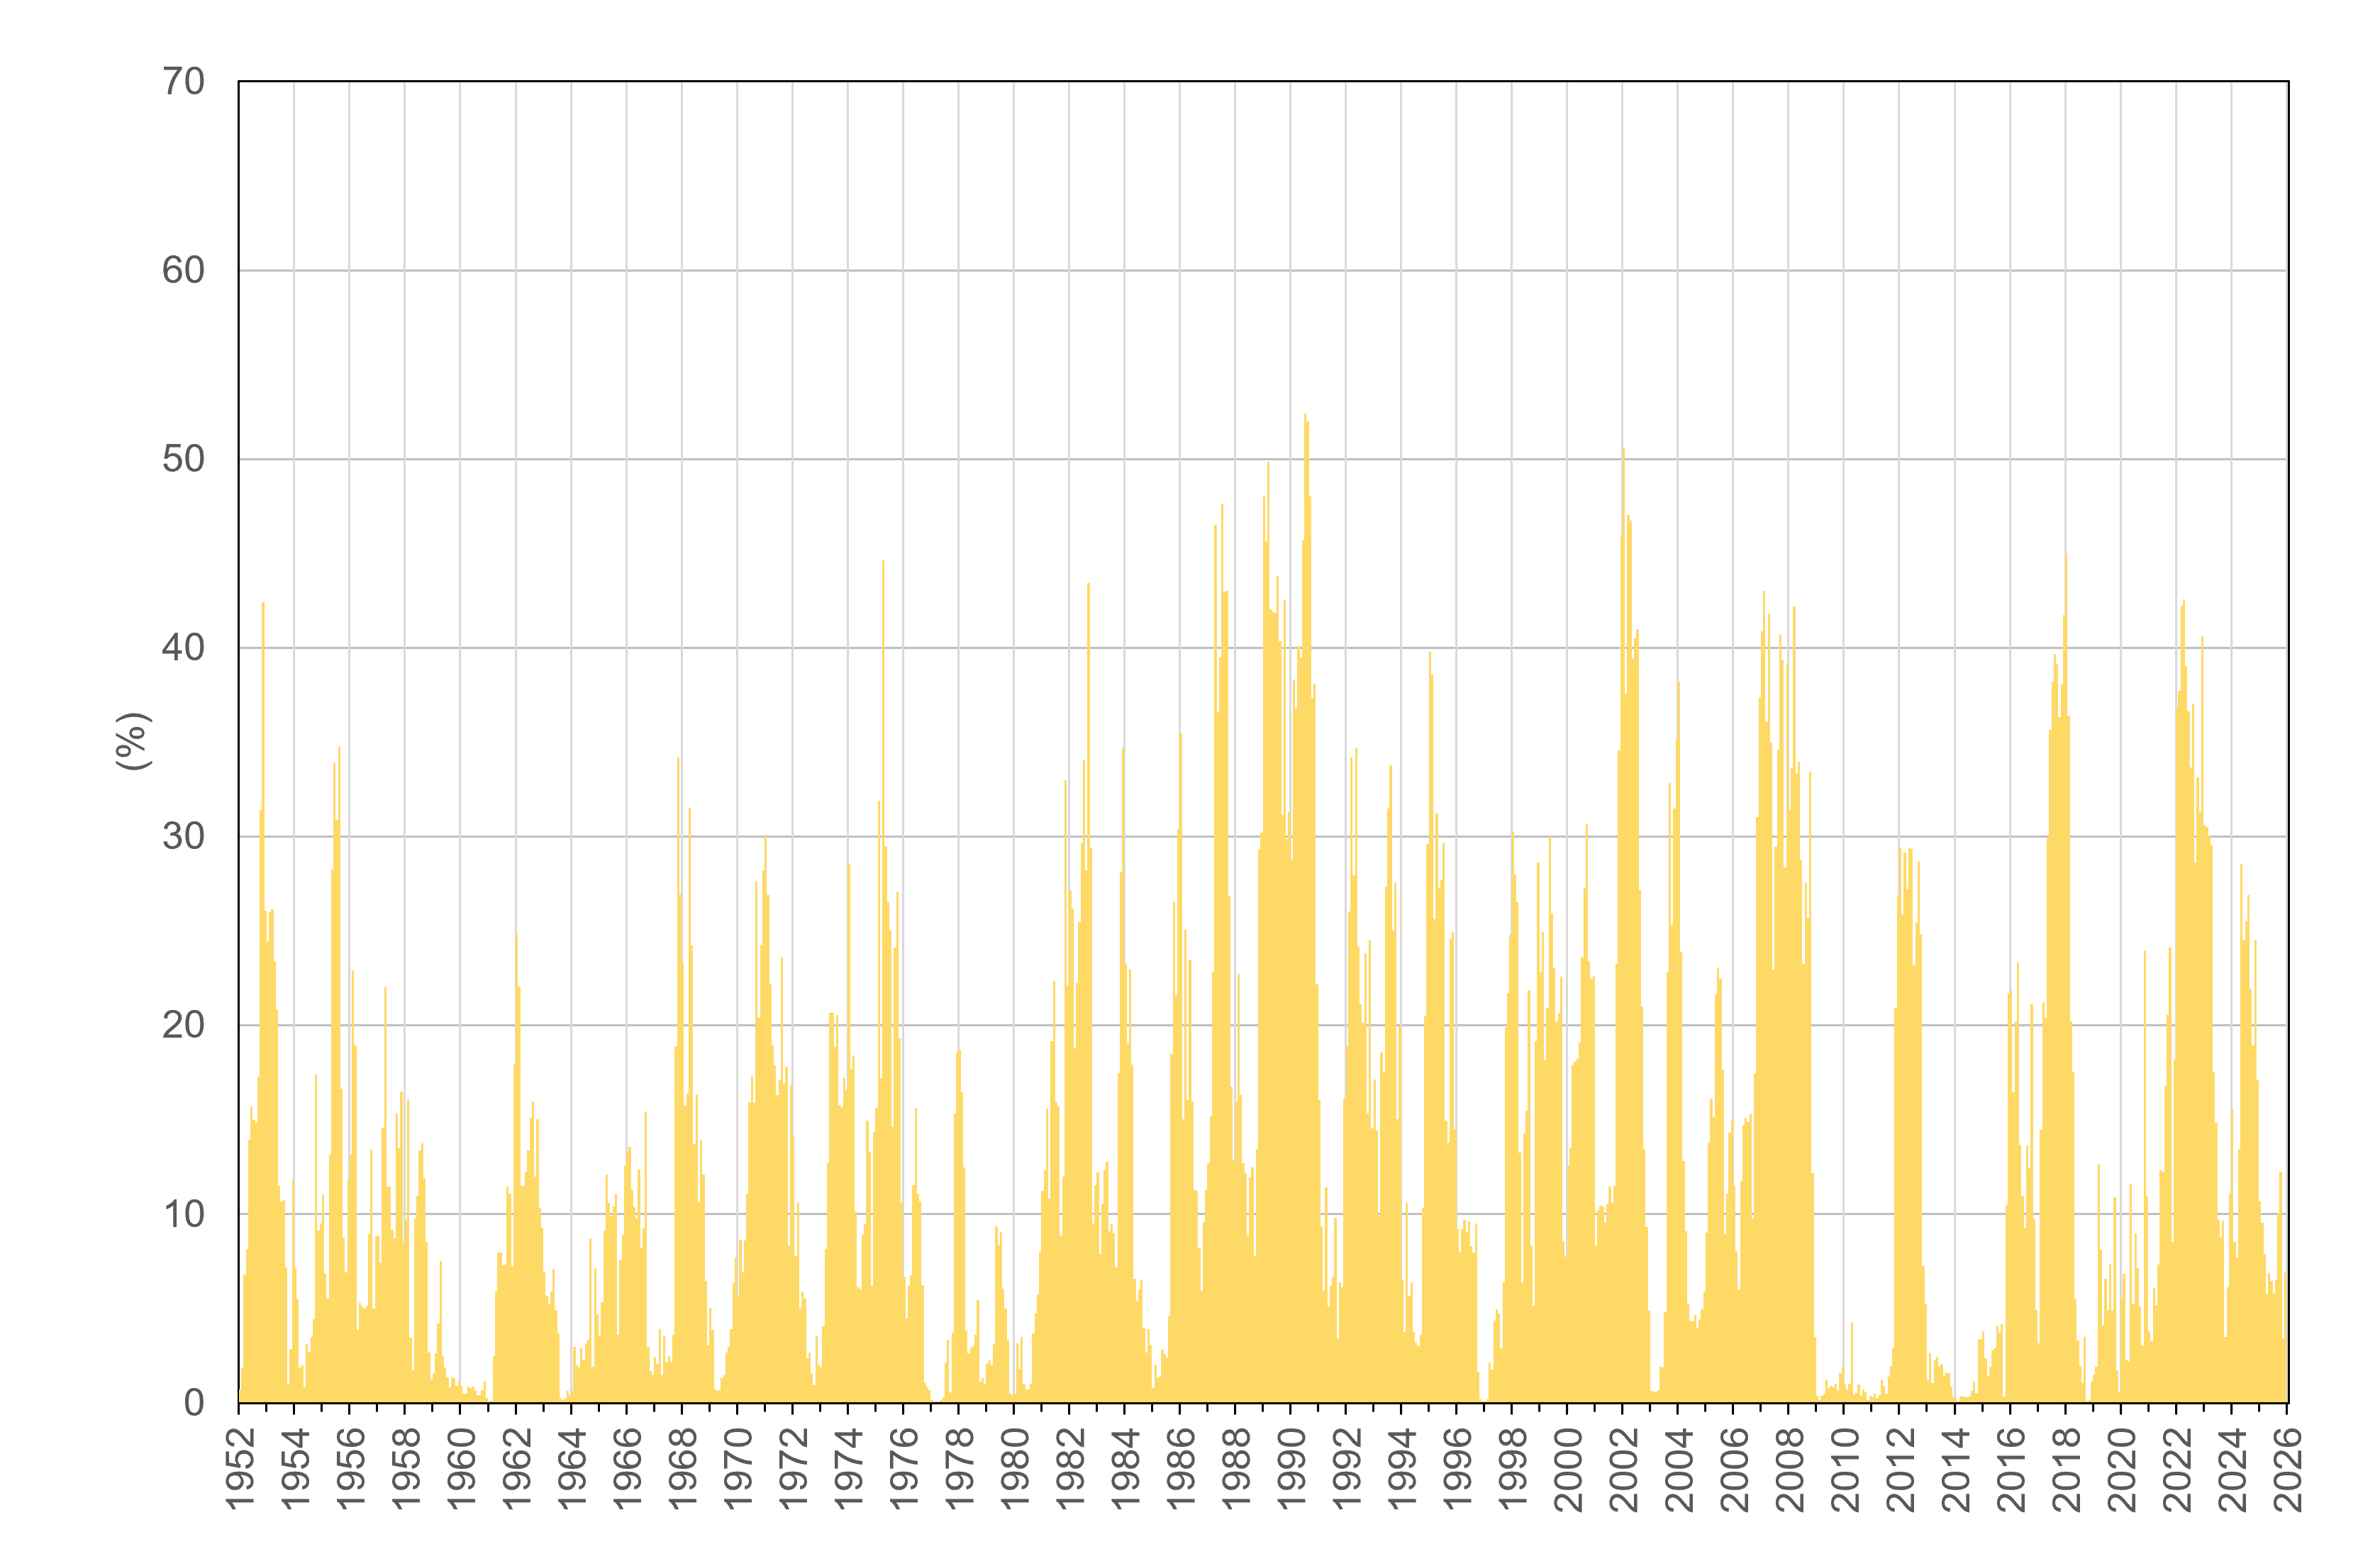
The data analysis highlighted statistically significant increasing trends for the areas subject to precipitation deficits (droughts) assessed with the 12-month SPI (Figures 2, 4) and, consequently, decreasing trends for the areas subject to normal and/or surplus precipitation values (Figures 6, 8). This highlights an increase in the percentage of Italian territory subject to extreme drought on an annual basis, starting from the beginning of the 1950s, in line with what was also found at a European level, strictly dependent on the already ongoing impact of climate change. There are no statistically significant trends in the percentages of areas characterized by the SPI at 3 months (Figures 1, 3, 5, 7).
| Allegati |
|---|
Thumbnail
Titolo
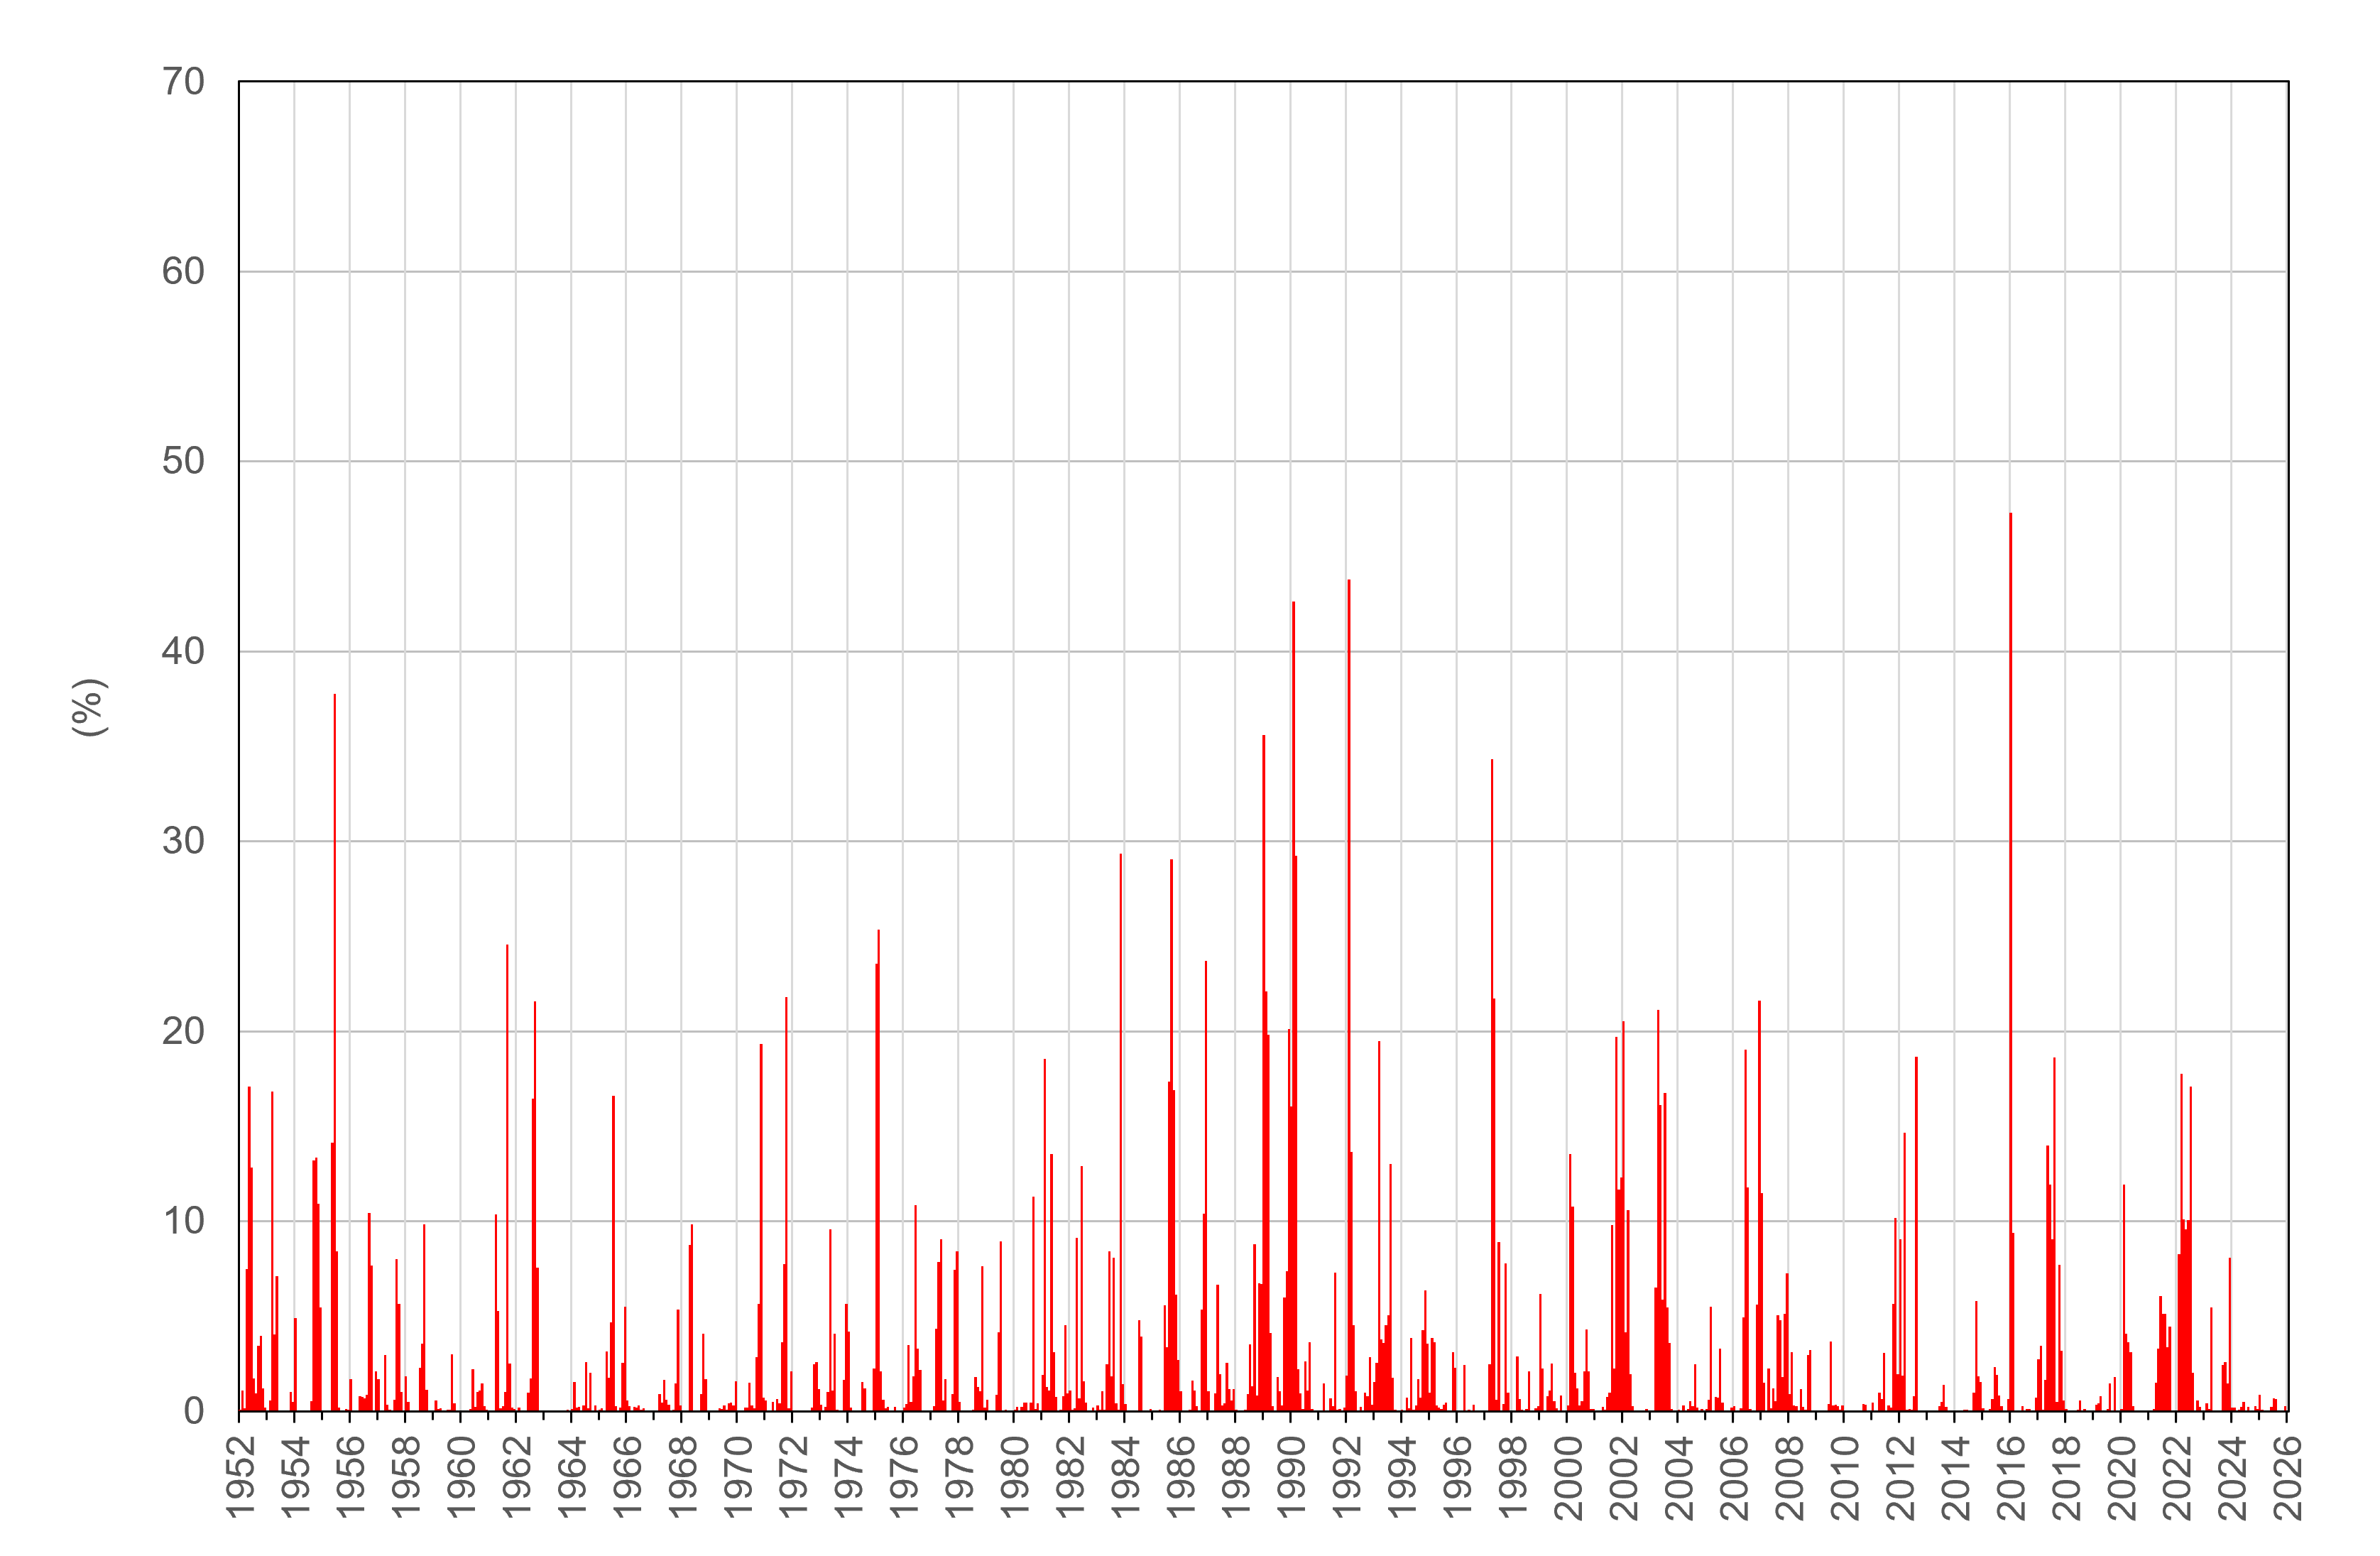
Figure 1: Percentage of the national territory subject to precipitation deficit with a value of 3-month SPI less than or equal to ‒2.0 (extreme drought). Period 1952‒2025 Fonte
ISPRA processing on data from regional hydro-meteorological offices and autonomous provinces and historical data from the SIMN suppressed |
Thumbnail
Titolo
Figure 2: Percentage of the national territory subject to precipitation deficit with 12-month SPI value less than or equal to ‒2.0 (extreme drought). Period 1952‒2025 Fonte
ISPRA processing on data from regional hydro-meteorological offices and autonomous provinces and historical data from the SIMN suppressed |
Thumbnail
Titolo
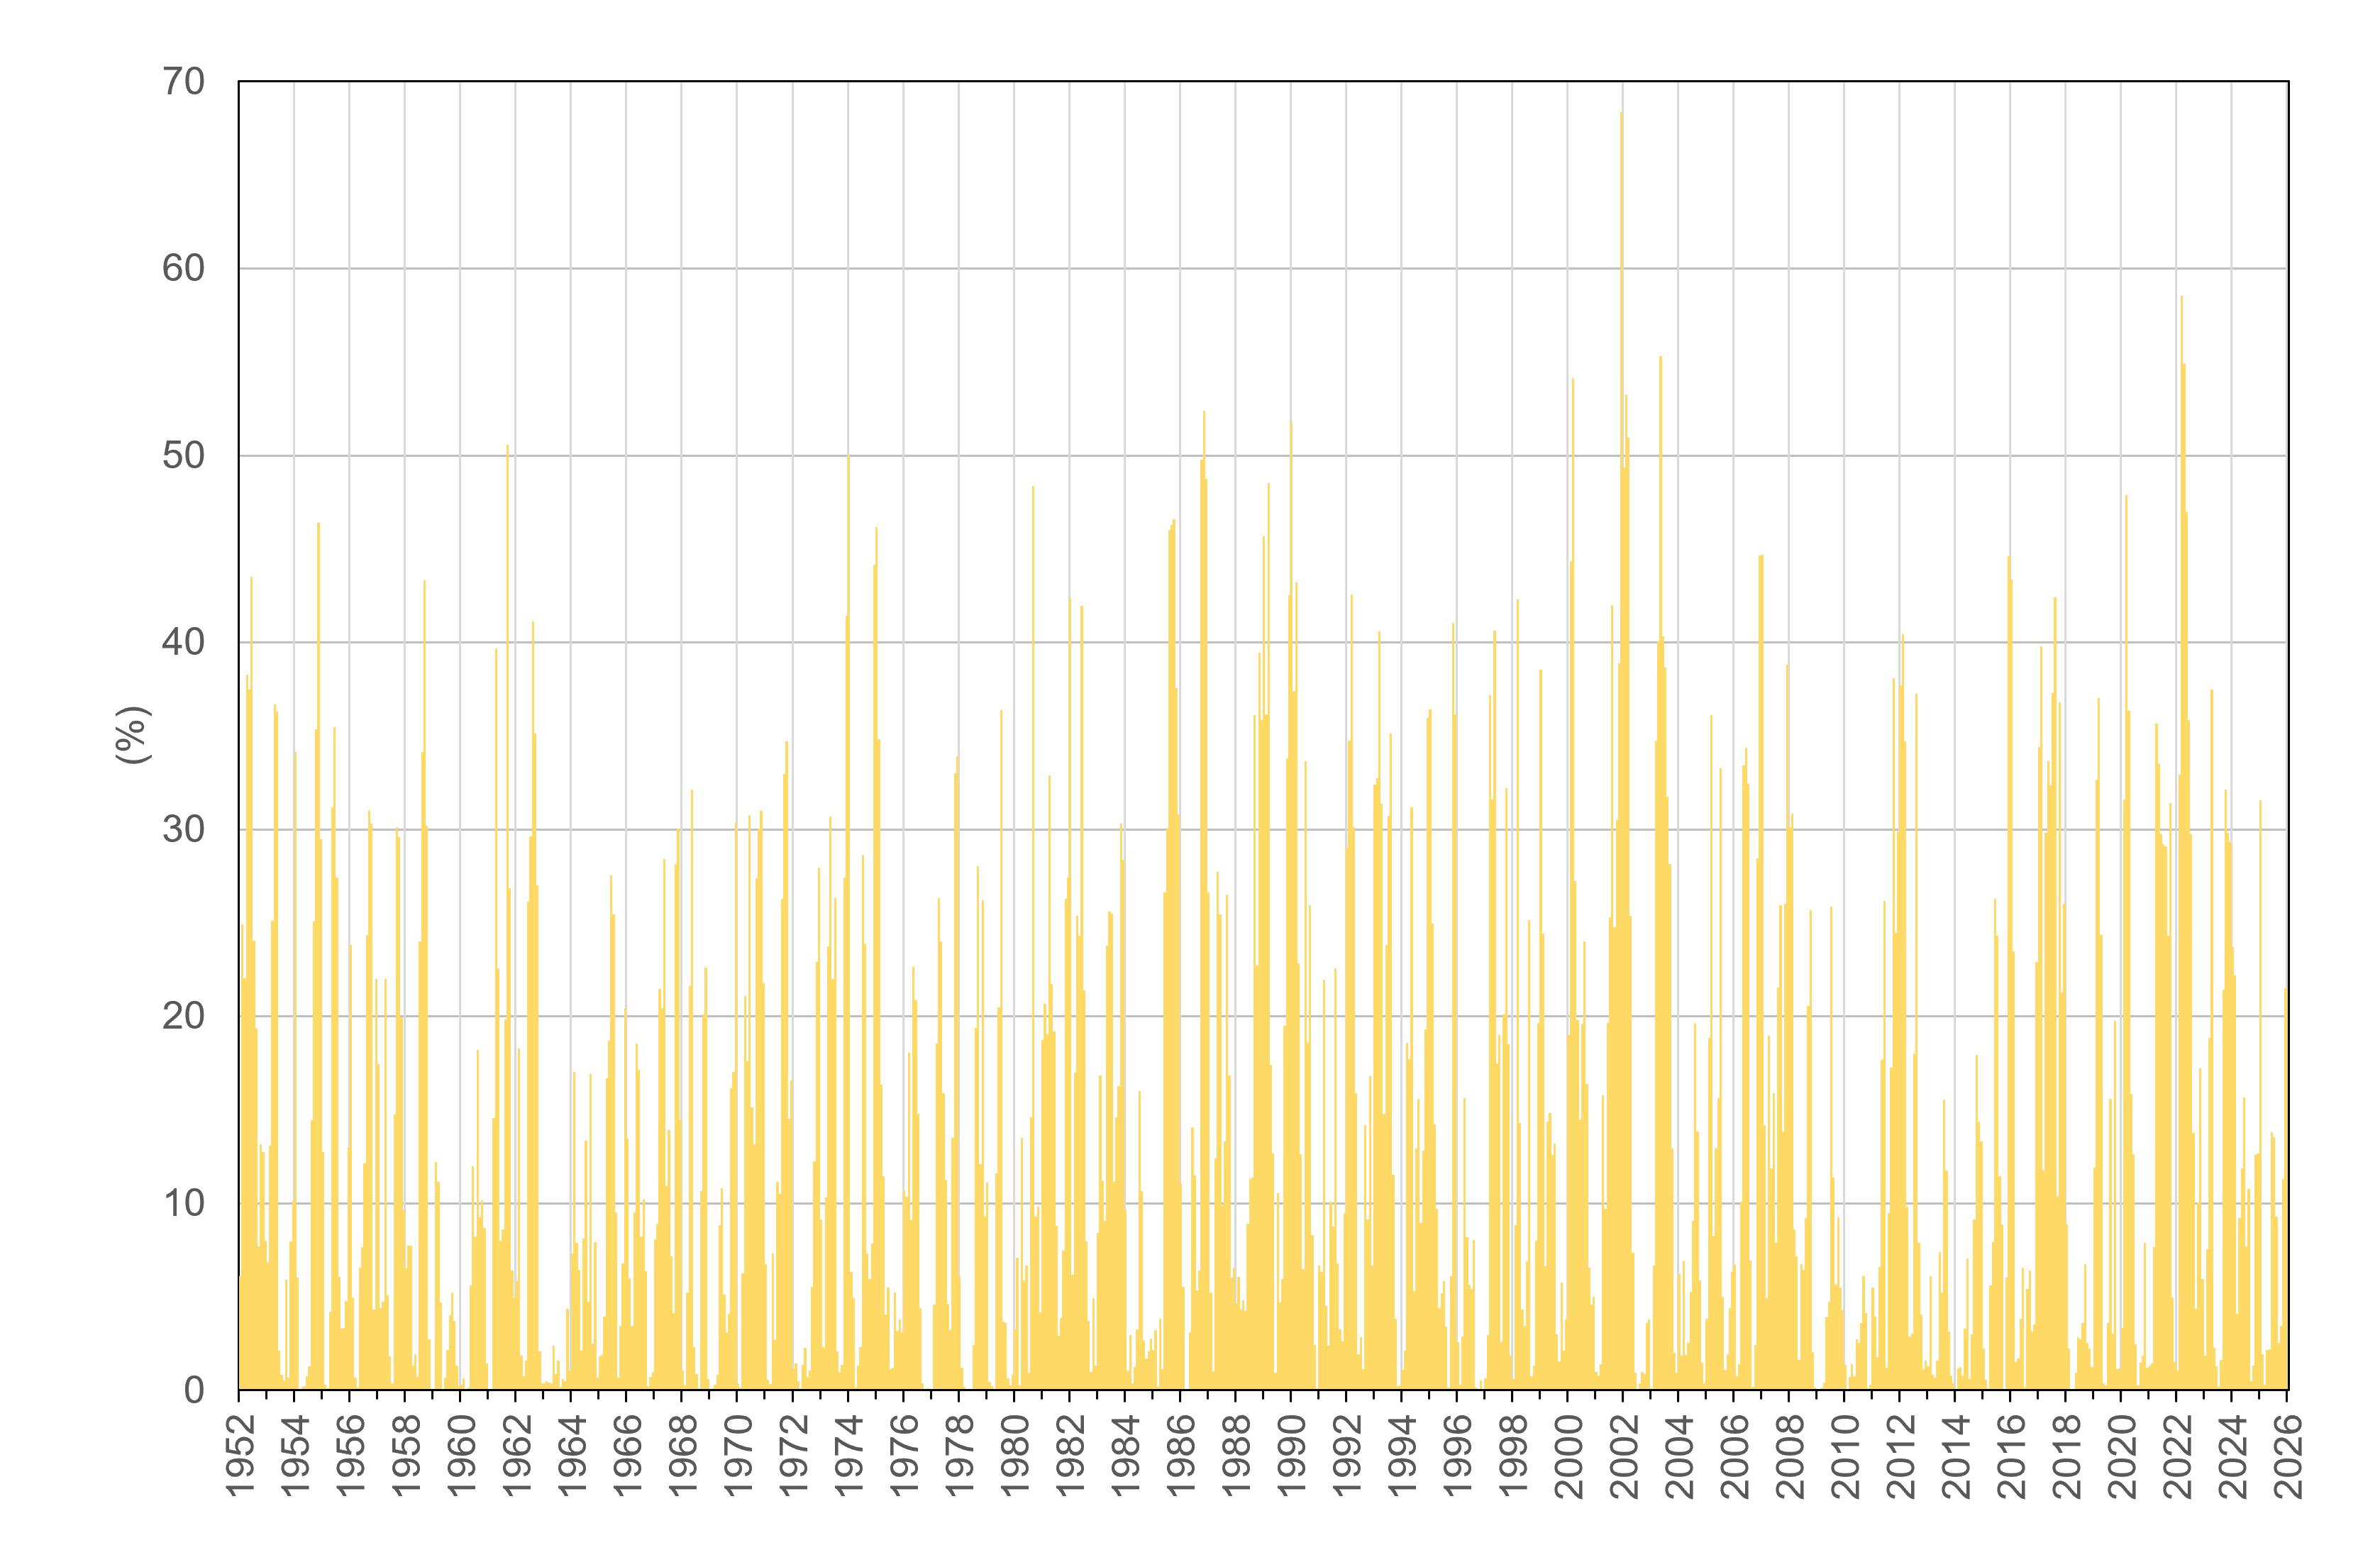
Figure 3: Percentage of the national territory subject to precipitation deficit with a value of 3-month SPIs greater than ‒2.0 and less than or equal to ‒1.0 (severe or moderate drought). Period 1952‒2025 Fonte
ISPRA processing on data from regional hydro-meteorological offices and autonomous provinces and historical data from the SIMN suppressed |
Thumbnail
Titolo
Figure 4: Percentage of the national territory subject to precipitation deficit with 12-month SPI value greater than –2.0 and less than or equal to –1.0 (severe or moderate drought). Period 1952‒2025 Fonte
ISPRA processing on data from regional hydro-meteorological offices and autonomous provinces and historical data from the SIMN suppressed |
Thumbnail
Titolo
Figure 5: Percentage of the national territory subject to precipitation surplus with a value of 3-month SPI greater than or equal to 1.0 and less than 2.0 (severe or moderate humidity). Period 1952‒2025 Fonte
ISPRA processing on data from regional hydro-meteorological offices and autonomous provinces and historical data from the SIMN suppressed |
Thumbnail
Titolo
Figure 6: Percentage of the national territory subject to precipitation surplus with 12-month SPI value greater than or equal to 1.0 and less than 2.0 (severe or moderate humidity). Period 1952‒2025 Fonte
ISPRA processing on data from regional hydro-meteorological offices and autonomous provinces and historical data from the SIMN suppressed |
Thumbnail
Titolo
Figure 7: Percentage of the national territory subject to precipitation surplus with a value of 3-month SPI greater than or equal to 2.0 (extreme humidity). Period 1952‒2025 Fonte
ISPRA processing on data from regional hydro-meteorological offices and autonomous provinces and historical data from the SIMN suppressed |
Thumbnail
Titolo
Figure 8: Percentage of the national territory subject to precipitation surplus with 12-month SPI value greater than or equal to 2.0 (extreme humidity). Period 1952‒2025 Fonte
ISPRA processing on data from regional hydro-meteorological offices and autonomous provinces and historical data from the SIMN suppressed |
Thumbnail
Titolo
Figure 9: Percentage of the national territory in the different classes of 3-month SPI. Period 1952‒2025 Fonte
ISPRA processing on data from regional hydro-meteorological offices and autonomous provinces and historical data from the SIMN suppressed |
Thumbnail
Titolo
Figure 10: Percentage of the national territory in the different classes of 12-month SPI. Period 1952‒2025 Fonte
ISPRA processing on data from regional hydro-meteorological offices and autonomous provinces and historical data from the SIMN suppressed |
In 2025, the average value (of the twelve monthly values) of the percentage of Italian territory subject to extreme drought conditions, characterized by an SPI, relating to the 3-month aggregate precipitation, less than or equal to –2.0, was found to be equal to 0.2%, significantly lower than the corresponding average value of the period 1952–2025 equal to 2.5%, however reaching the maximum value of 0.9% in the month of January. At the same time, the average value of the percentage of national territory subject to 12-month SPI less than or equal to –2.0 in 2025 was found to be equal to 0.2%, which was also much lower than the average value of the period 1952–2025 equal to 2.1%. On the 12-month time scale, the maximum value was reached in January, equal to 0.5%.
Also relevant in 2025 is the percentage of Italian territory subject to extreme humidity conditions, i. e. Characterized by an SPI greater than or equal to 2.0. As regards the 3-month aggregation, the average value was 0.7%, well lower than the corresponding average value for the period 1952–2025 equal to 1.9%. The maximum percentage of territory subject to extreme humidity occurred in April (3.0%).
On the 12-month time scale, the average value was 2.6%, in line with the corresponding average value for the period 1952–2025 of 2.3%. The maximum percentage of territory subject to extreme humidity occurred in October (10.4%).
If overall 2025 was characterized by precipitation values in line with the long-term average, the deviations of monthly precipitation were very different compared to the corresponding average values of the period 1951–2025 and the spatial distribution of annual precipitation was very different with high values in the North of the country and low quantities in the Centre, South and on the Islands (see the "Precipitation" indicator present in the "Water Resources and Budget" environmental theme of the Indicator Database environmental).
Figure 1 and Figure 2 show the percentages, from 1952 to 2025, of the areas of the national territory subject to extreme drought, i. e. Characterized by SPI values, respectively at 3 months and 12 months, less than or equal to –2.0. In the historical series of the 12-month aggregation, there is an increasing trend, which is also statistically significant, in the percentage of the territory subject to situations of extreme drought. For the areas of the national territory subject to severe or moderate drought, i. e. Characterized by SPI values, respectively at 3 months and 12 months, greater than -2.0 and less than or equal to -1.0, there is no significant trend in the series relating to the 3-month SPI (Figure 3), while there is an increasing trend, also statistically significant, in the percentage of the territory subject to severe or moderate drought events over the 12-month period (Figure 4).
Regarding the percentage of areas of the national territory subject to severe or moderate humidity, i. e. Characterized by SPI values, respectively at 3 months and 12 months, greater than or equal to 1.0 and less than 2.0, there is no trend in the series relating to the 3-month SPI (Figure 5), while there is a statistically significant decreasing trend over the 12-month period (Figure 6). For the areas of the national territory subject to extreme humidity, i. e. Characterized by SPI values, respectively at 3 months (Figure 7) and at 12 months (Figure 8), greater than or equal to 2.0, a statistically significant decreasing trend is observed in the 12-month period.