Panel 1
Andrea Gagna
The carbon dioxide (CO₂) emission intensity related to energy use in the Italian chemical industry is analysed in relation to the sector's value added. In 2020, the indicator increased by 1.7% compared to 2019, although it decreased by 61.5% relative to 1990. The data, covering the period 1990–2020, are reported annually to the European Commission as part of the greenhouse gas emission monitoring mechanism and in implementation of the Kyoto Protocol.
The indicator is calculated as the ratio of carbon dioxide emissions from the combustion of fossil fuels used in chemical production, including emissions from fuel combustion for electricity and heat generation, to the value added of the sector at basic prices, chain-linked volumes, reference year 2015. The indicator thus provides information on the tonnes of carbon dioxide emitted per million euros of value added in the chemical sector over the period 1990–2020.
The purpose is to provide information regularly on key drivers and highlight progress made at the national level across various sectors from a socio-economic and environmental perspective. To provide data on the tonnes of carbon dioxide emitted per million euros of value added in the chemical industry.
Regulation (EU) No. 525/2013, Implementing Regulation (EU) No. 749/2014, and Commission Decision No. 2005/166/EC
Regulation (EU) No. 525/2013, which repeals Decision No. 280/2004/EC, establishes in Article 7(1)(f) that by 15 January of each year (year X), Member States must report to the Commission data on carbon dioxide emission intensity indicators, as defined in Annex III of the same Regulation, referring to year X-2.
Commission Implementing Regulation (EU) No. 749/2014 of 30 June 2014 outlines the structure, format, transmission procedures, and review of the information submitted by Member States under Regulation (EU) No. 525/2013 of the European Parliament and the Council.
Commission Decision No. 2005/166/EC of 10 February 2005 sets out the implementation provisions of Decision No. 280/2004/EC of the European Parliament and the Council with regard to the monitoring mechanism of greenhouse gas emissions in the Community and for the implementation of the Kyoto Protocol.
The Decision requires the monitoring of all anthropogenic greenhouse gas emissions, the assessment of progress in fulfilling commitments under the United Nations Framework Convention on Climate Change and the Kyoto Protocol, and the assurance of timely, complete, accurate, consistent, comparable, and transparent reporting by the Community and its Member States.
With regard to carbon dioxide emission intensity indicators, the Decision establishes that, starting from 15 January 2005 and annually thereafter, Member States shall submit data and information on key, additional key, and supplementary indicators (as set out in Article 3(1)(j) of Decision No. 280/2004/EC).
Panel 2
APAT, 2008. Carbon Dioxide Intensity Indicators.
http://www.isprambiente.gov.it/contentfiles/00004100/4151-co2intensityindicators08.pdf
ISPRA, various years. Carbon dioxide emission intensity indicators available at:
http://emissioni.sina.isprambiente.it/wp-content/uploads/2022/04/Annex-II-Reporting-template-indicators-2022.xlsx
Data quality assessment
ISPRA (Italian National Institute for Environmental Protection and Research), ISTAT (Italian National Institute of Statistics)
Data from ISPRA were used, in particular the carbon dioxide emission intensity indicators, officially submitted each year to the EU under the GHG Monitoring Mechanism Regulation (MMR), available at the following link:
http://emissioni.sina.isprambiente.it/wp-content/uploads/2022/04/Annex-II-Reporting-template-indicators-2022.xlsx
ISPRA, various years. CO₂ emission data available at:
https://emissioni.sina.isprambiente.it/serie-storiche-emissioni/
ISTAT, various years. Data on value added available at:
http://dati.istat.it/
National
1990 - 2020
Indicator assessment
The indicator is calculated as the ratio between CO₂ emissions (in tonnes) from the chemical industry and the value added of the sector (in million euros), and presented as fixed-base index numbers (1990 = 100).
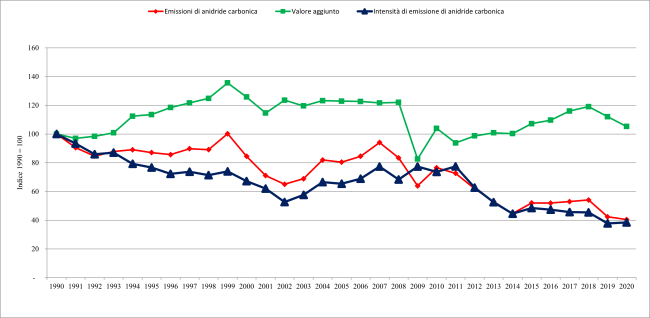
In 2020, CO₂ emissions from energy-related processes in the chemical industry totaled 8.7 Mt, a 4.5% reduction from the previous year (Table 1). The sector’s value added was €10,697 million, a 6.1% decrease from 2019. As a result, CO₂ emission intensity relative to value added was 810.6 tonnes per million euros, an increase of 1.7% compared to the previous year.
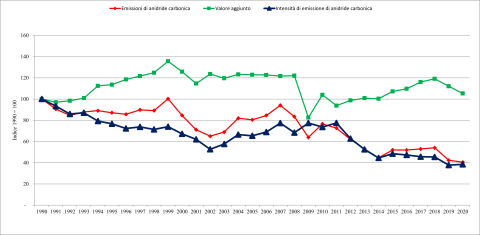
Le emissioni di CO2 derivanti dai processi energetici nell’industria chimica decrescono del 59,5% dal 1990 al 2020 (Tabella 1 e Figura 1). Nel 1999 si registra il massimo valore di emissione (21,5 Mt), mentre nel 2020 il minimo. Il valore aggiunto del settore presenta dal 1990 al 2020 un aumento pari al 5,2%, con il massimo nel 1999 (13.784 milioni di euro) e il minimo nel 2009 (8.392 milioni di euro); riprende a crescere fino al 2018, torna a diminuire dal 2019. L’intensità di emissione di CO2 risultante diminuisce del 61,5% dal 1990 (2.108,18 t CO2/milione di euro) al 2020 (810,6 t CO2/milione di euro), in lieve aumento rispetto al valore del 2019 che rappresenta il valore minimo del periodo in esame.
Data
Table 1: Carbon Dioxide Emission Intensity Relating to Energy Use in the Chemical Industry in Italy, Relative to Value Added
ISPRA elaboration based on ISPRA Data (CO2 Emissions) and ISTAT Data (Value Added)


In the chemical industry, carbon dioxide emission intensity—expressed in tonnes of CO₂ per million euros of value added—related to energy use progressively decreased by 61.5% from 1990 to 2020, going from 2,108.18 to 810.6 t/million € (Table 1 and Figure 1).