Giovanni Finocchiaro, Andrea Gagna, Mariangela Soraci
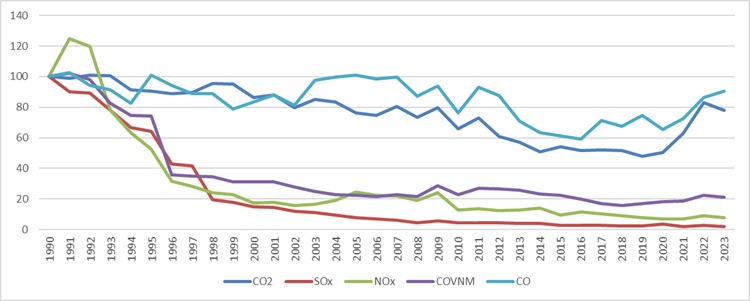
In 2023, for every million euros of value added, the Italian chemical industry emitted 3,179 tonnes of CO₂, compared with 0.58 t of SOx, 0.97 t of NOx, 0.44 t of NMVOCs, and 3.13 t of CO. Compared with 1990, SOx and NOx intensities have almost been eliminated (–97% and –92%), while CO₂ has fallen by only 22%, indicating that energy decarbonisation remains the main challenge. Over the last year, emissions intensities decreased for almost all pollutants (CO₂ –6%, SOx –24%, NOx –14%, NMVOCs –4%), confirming a trend of progressive decoupling between economic growth and environmental pressures. Calculated for 1990–2023 and updated annually with ISPRA and ISTAT data, the indicator provides an immediate reading of the evolution of atmospheric emissions relative to the economic activity of the whole chemical sector, consistent with what is reported each year to the European Commission under the EU greenhouse-gas monitoring mechanism and for implementation of the Kyoto Protocol.
The indicator relates the total annual emissions of five major atmospheric pollutants produced by the chemical and petrochemical industry—CO₂ (from combustion), SOx (sulphur oxides), NOx (nitrogen oxides), NMVOCs (non-methane volatile organic compounds) and CO (carbon monoxide)—to the sector’s value added (millions of euros at basic prices, 2015 chained values).
Emissions are estimated according to EMEP/EEA methodologies and are revised every year for the entire historical series (1990–present) to incorporate new data and methodological improvements. Because the economic denominator reflects the wealth actually generated by the sector, the indicator measures the amount of pollutant released per unit of economic value produced, providing a synthetic view of the sector’s environmental efficiency over time rather than of individual production processes.
To continuously monitor how effectively the chemical industry is decoupling economic growth from CO₂ emissions and from emissions of other major air pollutants, providing a reliable reference to assess the effectiveness of sectoral policies.
The indicator’s legal framework combines requirements for monitoring greenhouse-gas emissions and other conventional air pollutants:
- Regulation (EU) 2018/1999 on the Governance of the Energy Union requires Member States (Article 26) to transmit by 15 March each year the national greenhouse-gas inventory and emission-intensity indicators for year X–2, following the structure laid down by Implementing Regulation (EU) 2020/1208. These obligations sit within the European Climate Law, Regulation (EU) 2021/1119, which makes legally binding the objectives of climate neutrality by 2050 and at least –55% net emissions by 2030.
- For conventional pollutants, the indicator aligns with national reduction commitments set by Directive (EU) 2016/2284 (NEC Directive) for SOx, NOx, NMVOCs and CO.
- On the industrial side, the Industrial Emissions Directive 2010/75/EU, implemented in Italy through Legislative Decree No. 46/2014, remains central: it requires the adoption of Best Available Techniques (BAT) and systematic exchange of emissions data for installations subject to AIA.
Together, these rules set reduction objectives, reporting deadlines, operating requirements for industrial plants, and data accuracy/transparency/annual revision requirements.
ISPRA
ISTAT
Emission series come from the National Air Emission Inventory managed by ISPRA: datasets in NFR and SNAP formats can be freely downloaded from emissioni.sina.isprambiente.it, together with the latest detailed reports—Italian Emission Inventory 1990–2023, Informative Inventory Report 2025 and Italian Greenhouse Gas Inventory 1990–2023, National Inventory Document 2025 (also available in the “Publications” section of ISPRA’s website). CO₂ intensity indicators required annually under EU governance are transmitted by ISPRA via the Annex II template of Regulation (EU) 2018/1999 and published on the same portal alongside the official pollutant time series.
Economic data come from ISTAT National Accounts: the table “Value added at basic prices – Manufacture of chemicals (ATECO 20) – 2015 chained prices” is available as open data in the I.Stat data warehouse (dati.istat.it), exportable in CSV/SDMX formats.
National
1990 - 2023
Each year (from 1990 onwards), emissions of CO₂, SOx, NOx, NMVOCs and CO for the chemical sector are extracted from ISPRA’s national air emission inventory, and the corresponding sector value added (2015 prices) is taken from ISTAT National Accounts. After harmonising classifications, each pollutant is divided by value added to obtain tonnes emitted per million euros, and the series is then normalised to 1990 = 100 to make long-term evolution easier to read. Whenever the emission inventory or economic accounts are revised (following IPCC and EMEP/EEA guidance and international review processes under EU reporting and the UNFCCC/
In 2023, the Italian chemical industry emitted 25.1 Mt of CO₂, 4.6 kt of SOx, 7.7 kt of NOx, 3.4 kt of NMVOCs, and 24.8 kt of CO. Dividing these quantities by the sector’s value added (about €7.9 billion at 2015 prices) yields intensities of 3,179 t CO₂, 0.58 t SOx, 0.97 t NOx, 0.44 t NMVOCs, and 3.13 t CO per million euros (Table 1). Compared with 2022, the indicator improves for almost all pollutants (–6% CO₂, –23.6% SOx, –13.8% NOx, –3.9% NMVOCs), except for carbon monoxide, which shows a slight increase (+4.9%). Overall, the data confirm progressive decoupling between economic growth and environmental pressures, while indicating further potential for reductions in CO and CO₂.
Since 1990, emission intensity has fallen sharply for conventional pollutants: –97.9% SOx, –92.1% NOx, –78.7% NMVOCs. Carbon monoxide shows a much smaller reduction (–9.5%), while CO₂ decreases by about –21.8%. The fastest reductions for SOx, NOx and NMVOCs occur between the mid-1990s and the mid-2000s; CO₂ shows wider oscillations, with a minimum in 2019 and a partial rebound in recent years.
| Allegati |
|---|
Titolo
Table 1: Intensity of emissions into the atmosphere in the chemical industry in Italy, compared to added value Fonte
ISPRA processing on ISPRA data (data on CO2 emissions; SOx, NOx, NMVOC and CO) and Istat (data on Added Value) |
Thumbnail
Titolo
Figure 1: Emission intensity, index 1990 = 100 for CO₂, SOx, NOx, NMVOC, CO in the chemical industry Fonte
ISPRA processing on ISPRA and Istat data |
Overall, a strong gap emerges between CO₂ and the other pollutants: while SOx, NOx and NMVOCs drop rapidly and remain at very low levels, CO₂ follows a more irregular path and remains the dominant component. CO decreases, but more slowly, and is still the second-largest contribution. In summary, reductions are now consolidated for conventional pollutants, whereas the main remaining challenges concern climate-altering emissions (CO₂) and carbon monoxide (Table 1 and Figure 1).