Angelo Santini, Fabio Tatti
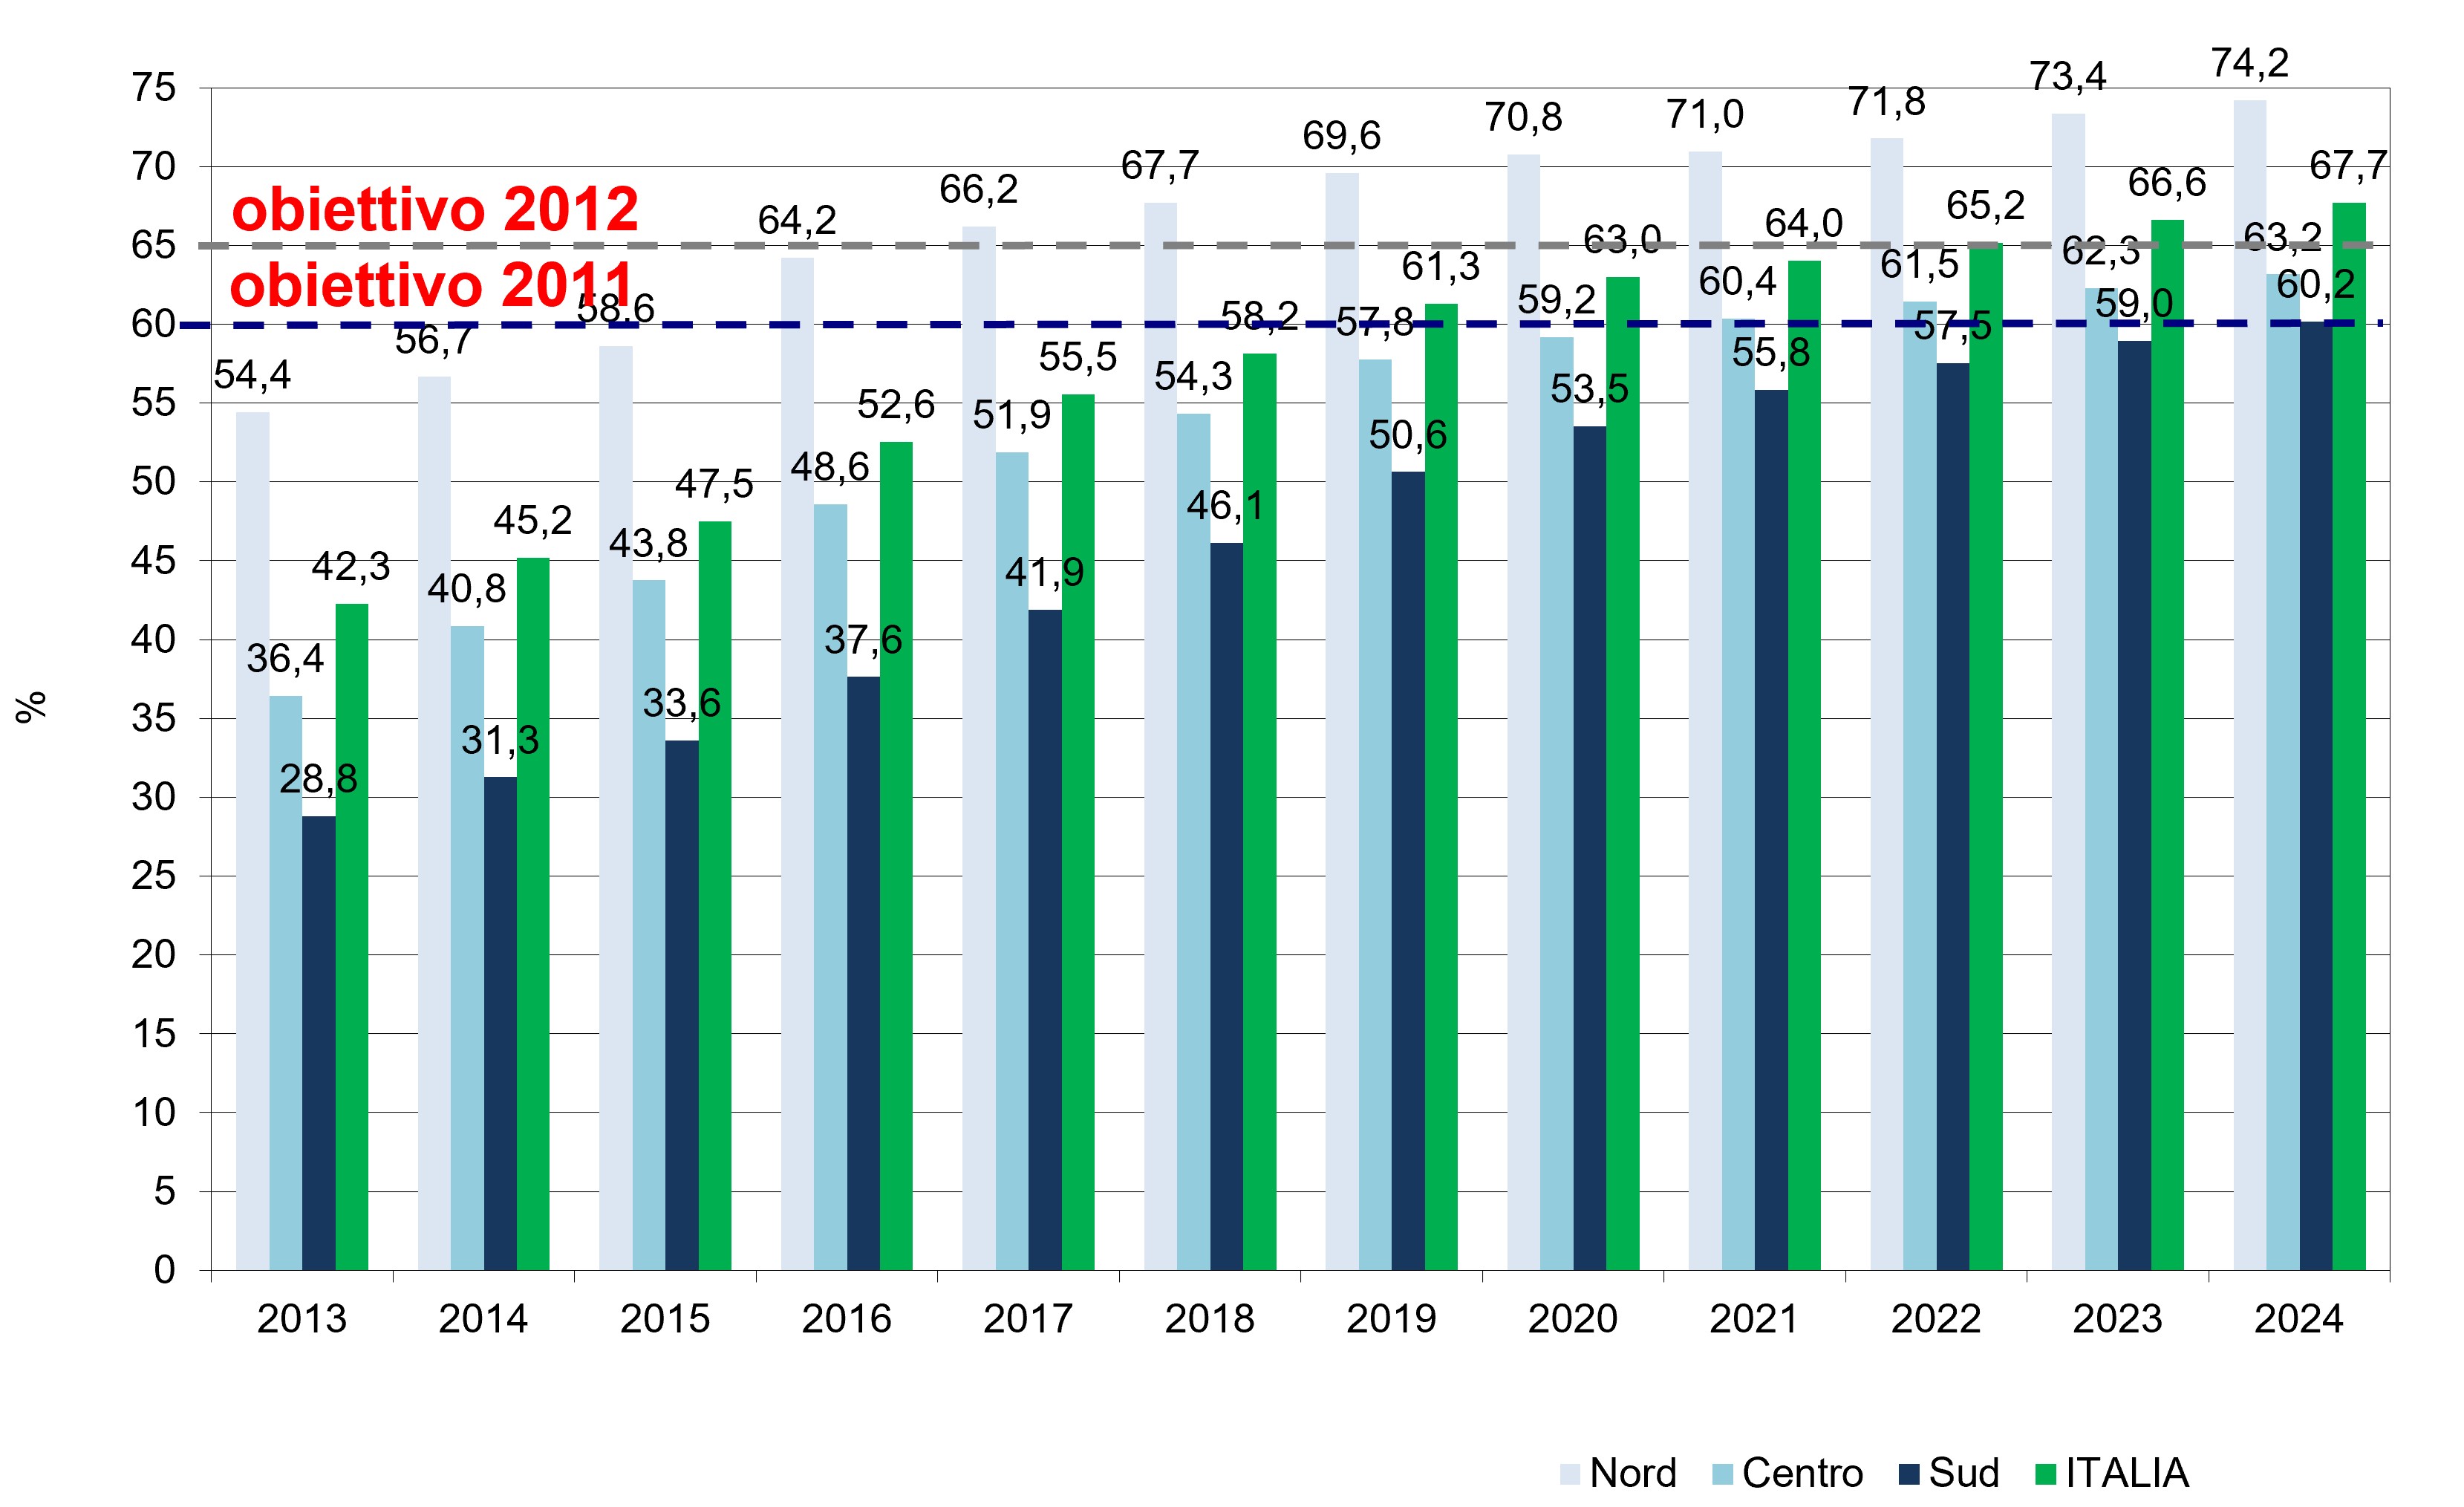
In 2024, the separate collection rate was 67.7% of national municipal waste generation, increasing by 1.1 percentage points compared with 2023 and remaining above the target set by legislation for 2012 (65%).
The indicator measures the quantity of municipal waste collected separately in the reference year relative to total municipal waste generation.
Verify the achievement of the separate waste collection objectives set by the legislation
National legislation (Legislative Decree no. 152/2006, Law 27 December 2006, no. 296) identifies the following separate waste collection objectives:
• at least 35% by 31 December 2006;
• at least 40% by 31 December 2007;
• at least 45% by 31 December 2008;
• at least 50% by 31 December 2009;
• at least 60% by 31 December 2011;
• at least 65% by 31 December 2012.
ISPRA - Rapporto Rifiuti Urbani (various editions)
ISPRA, Italian Institute for Environmental Protection and Research.
The data on the separate collection of urban waste on a national scale, by geographical, regional, provincial and municipal macro area can be freely consulted and downloaded on the website https://www. catasto-rifiuti. isprambiente. it.
National, Regional
2007-2024
Percentage of separate waste collection
The indicator measures the quantity of municipal waste collected separately in the reference year and calculates its percentage share of total municipal waste generation. Specifically, ISPRA collects annual data on the collection of individual material fractions at municipal level or, in some cases, at the level of Consortia of Municipalities, Mountain Communities or Unions of Municipalities.
On 26 May 2016, the Ministry of the Environment and Energy Security (MASE), pursuant to Article 205, paragraph 3-quater, of Legislative Decree No. 152 of 3 April 2006, issued a specific decree containing guidelines for calculating the separate collection rate of municipal waste, published in the Official Gazette of the Italian Republic, General Series No. 146 of 24 June 2016.
Starting from 2016 data, ISPRA has processed the data by applying this methodology, which differs in some respects from the methodology adopted until 2015. Since 2016, the methodology applied has required the following fractions to be accounted for as mixed waste:
- mixed municipal waste (20 03 01);
- street-cleaning residues (20 03 03) sent for disposal;
- other municipal waste not otherwise specified (20 03 99);
- bulky waste identified by EWC code 20 03 07, where not destined for recovery, accounted for separately and contributing to total municipal waste generation but not to separate collection.
Separate collection includes the following waste types:
- organic fraction, wet fraction and green waste, including the wet fraction sent to home composting;
- packaging waste, including multi-material collection inclusive of rejects, where multi-material collection means the collection of different material fractions of municipal or similar waste using a single container, as well as paper and cardboard, plastics, wood, metal and glass waste under Chapter 20 of the European Waste List;
- mixed bulky waste sent for recovery (20 03 07);
- textile waste;
- selectively collected waste, such as medicines, T/FC containers, batteries and accumulators, paints, inks and adhesives, vegetable oils and mineral oils;
- waste electrical and electronic equipment (WEEE);
- C&D waste, limited to codes 17 01 07 and 17 09 04 and only for the shares originating from small removal works carried out directly by the occupier of a residential dwelling;
- street-cleaning residues sent for recovery (20 03 03);
- other fractions collected separately.
In accordance with the guidance provided by the Ministry of the Environment, Land and Sea Protection, C&D waste is accounted for in municipal waste generation and separate collection up to a maximum threshold value of 15 kg per inhabitant per year. Similarly, and again in accordance with the Ministry’s guidance, a threshold value has been set for waste sent to home composting, which contributes to the separate collection figure for the wet fraction. This threshold value has been set at 80 kg per inhabitant per year.
With regard to street-cleaning residues, taking into account the provisions of the Decree of 26 May 2016, ISPRA accounts in separate collection only the shares destined for recovery. In the absence of precise information on the destination of the waste, or where only a storage operation (R13) is reported without further specification of the subsequent actual recovery operation, the quantity is included in the amount of mixed waste.
The 2012 statutory target of 65% was also exceeded at national level in 2024, with a separate collection rate of 67.7% (Table 1 and Figure 1).
Separate collection has progressively increased across all areas of the country. Between 2015 and 2024, an increase of over 20 percentage points was recorded at national level (Figure 1).
| Allegati |
|---|
Titolo
Table 1: Quantity of municipal waste collected separately and percentage of total waste collected Fonte
ISPRA |
Thumbnail
Titolo
Figure 2: Separate collection rate of municipal waste by region (2024) Fonte
ISPRA |
Thumbnail
Titolo
Figure 1: Percentage of municipal waste collected separately Fonte
ISPRA |
In 2024, the separate collection rate was 67.7% of national municipal waste generation, equal to 29.9 million tonnes, increasing by 1.1 percentage points compared with 2023. In Northern Italy, total separate collection amounted to 10.9 million tonnes; in Central Italy to almost 4 million tonnes; and in Southern Italy to just under 5.4 million tonnes. These values correspond to rates, calculated against total municipal waste generation in each macro-area, of 74.2% for the northern regions, 63.2% for the central regions and 60.2% for the southern regions (Figure 1).
Compared with 2023, all geographical macro-areas showed increases in the separate collection rate: in the northern and central regions the increase was slightly below one percentage point, while in the southern regions it was 1.2 percentage points.
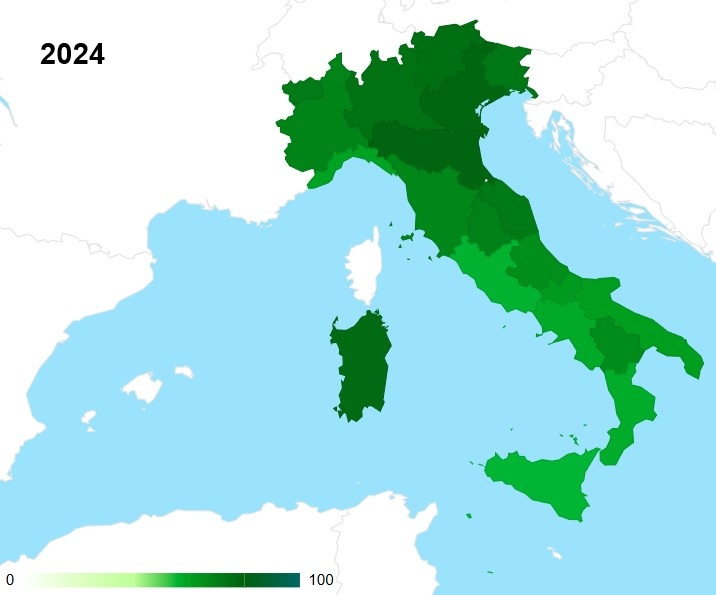
At regional level, the highest separate collection rate was achieved by Emilia-Romagna, with 78.9%, followed by Veneto (78.2%), Sardinia (76.6%), Trentino-Alto Adige (75.8%), Lombardy (74.3%) and Friuli-Venezia Giulia (72.7%) (Table 1, Figure 1). Among these regions, Emilia-Romagna recorded the largest increase in the collection rate, with a rise of 1.7 percentage points compared with 2023.
The 65% target set by legislation for 2012 was also exceeded by Marche (71.8%), Valle d’Aosta (71.7%), Umbria (69.6%), Piedmont (68.9%), Tuscany (68.1%), Basilicata (66.3%) and Abruzzo (65.7%). The number of regions with a collection rate equal to or above the national average of 67.7% was 11.
Molise and Puglia stood at 61.7% and 60.7%, respectively, while Liguria reached 59.6%, Campania 58.1%, Calabria 57.5%, Lazio 56.2% and Sicily 55.5%. Sicily showed an increase of 0.3 percentage points compared with 2023, 4.1 points compared with 2022 (51.5%), 8 points compared with 2021 and 13.2 points compared with 2020 (Table 1 and Figure 2).