Giovanni Finocchiaro, Andrea Gagna, Mariangela Soraci
In 2022, for every million euros of value added, the Italian metallurgical industry, which includes the steel industry and the non-ferrous metals sector, emitted 1,124 t of CO₂, compared with 1.2 t of SOx, 1.8 t of NOx, 1.4 t of NMVOCs, and 19.2 t of CO. Compared with 1990, the emission intensity of SOx has almost been reduced to zero (89%), while those of CO decreased by (–68%), NOx (–61%), CO₂ (–50%), NMVOCs (–22%). The indicator’s pattern and trend are dominated by what occurs in the steel sector. In 2022, compared with the previous year, emission intensity improves, confirming a decrease for all pollutants (CO₂ –9%, SOx –22%, NOx –8%, NMVOCs –1%, CO –7.4%).
The indicator relates the total annual emissions of five air pollutants produced by the metallurgical industry (steel industry plus non-ferrous metals industry)—CO₂ (carbon dioxide), SOx (sulphur oxides), NOx (nitrogen oxides), NMVOCs (non-methane volatile organic compounds) and CO (carbon monoxide)—to the sector’s value added (millions of euros at basic prices, 2015 chained values).
Emissions are estimated according to the methodologies of international guidelines (IPCC and EMEP/EEA) and updated annually. The annual update of emissions implies revision of the entire historical series on the basis of improved information and the most recent methodological developments. Since the economic denominator reflects the wealth actually generated by the sector, the indicator measures the amount of pollutant released per unit of economic value produced, providing a synthetic picture of the sector’s environmental efficiency over time and not of individual production processes.
To continuously monitor the trend of emissions from the metallurgical industry in relation to the economic trend.
Sector-specific environmental emissions are regulated by Directive 2010/75/EU of 24 November 2010, implemented in the Italian legal system by Legislative Decree No. 46 of 4 March 2014, which amended Legislative Decree No. 152/06, as amended. The instrument defines, for each industrial sector, the obligations to be complied with in terms of prevention and reduction of pollution, also through the adoption of Best Available Techniques (BATs). The exchange of information within the European Community must also be ensured, including with regard to emissions for activities subject to AIA.
Regulation (EU) No 525/2013, which repeals Decision No 280/2004/EC, provides in Article 7(1)(f) that by 15 January each year (year X) Member States must report to the Commission information on carbon dioxide emission intensity indicators, as defined in Annex 3 of the same Regulation, for year X–2, for priority, additional priority and additional indicators (indicators provided for by Article 3(1)(j) of Decision No 280/2004/EC).
Commission Implementing Regulation (EU) No 749/2014 of 30 June 2014 concerns the structure, format, transmission procedures and review of information communicated by Member States under Regulation (EU) No 525/2013 of the European Parliament and of the Council.
Commission Decision No 2005/166/EC of 10 February 2005 lays down rules for implementing Decision No 280/2004/EC of the European Parliament and of the Council concerning a mechanism for monitoring Community greenhouse gas emissions and for implementing the Kyoto Protocol. The Commission Decision establishes that all anthropogenic greenhouse gas emissions must be monitored, progress in meeting commitments under the United Nations Framework Convention on Climate Change and the Kyoto Protocol must be assessed, and the timeliness, completeness, accuracy, consistency, comparability and transparency of reporting by the Community and its Member States must be ensured.
ISPRA, 2023. Carbon dioxide emission intensity indicators in Italy, year 2023.
https://emissioni.sina.isprambiente.it/wp-content/uploads/2025/04/MMR2025_Art13_AnnexXI_Indicators_2025.xlsx
FEDERACCIAI, various years. Steel industry in figures. Federation of Italian Steel Companies.
http://www.federacciai.it/
-
-
Federacciai
ISPRA
ISTAT
Carbon dioxide emission intensity indicators, officially transmitted by ISPRA each year to the EU under the greenhouse gas MMR (Monitoring Mechanism Regulation) (Regulation (EU) No 525/2013), are available at:
https://emissioni.sina.isprambiente.it/inventario-nazionale/ in the “Reports and time series” section.
CO₂ emission data are available at:
https://emissioni.sina.isprambiente.it/serie-storiche-emissioni/
Emission series come from ISPRA’s National Air Emission Inventory: datasets in NFR and SNAP formats can be freely downloaded from emissioni.sina.isprambiente.it.
Italian Emission Inventory 1990–2023, Informative Inventory Report 2025 and Italian Greenhouse Gas Inventory 1990–2023, National Inventory Document 2025.
Economic data come from ISTAT National Accounts: the table “Value added at basic prices – Metallurgical activities sector (ATECO 24) – 2015 chained prices” is available as open data on the I.Stat data warehouse, exportable in CSV/SDMX formats (dati.istat.it).
National
1990 - 2022
Each year, from 1990 onwards, emissions of CO₂, SOx, NOx, NMVOCs and CO for the metallurgical sector are extracted from the National Air Emission Inventory prepared and updated by ISPRA, and the corresponding value added (2015 chained prices) is taken from ISTAT National Accounts. After harmonising classifications, emissions of each pollutant are divided by value added to obtain tonnes per million euros, and the series is normalised to 1990 = 100 to facilitate interpretation of the evolution. With each revision by ISPRA of the Inventory (which recalculates retroactively the entire historical emission series following EMEP/EEA guidelines and international reviews under EU, UNFCCC and UNECE/CLRTAP reporting) or of the economic accounts by ISTAT, the entire indicator series is recalculated retroactively.
In 2022, the Italian metallurgical industry emitted 6.7 Mt of CO₂, 6.9 kt of SOx, 10.4 kt of NOx, 8.2 kt of NMVOCs and 114.8 kt of CO. Dividing these amounts by the sector’s value added (about 5.97 million € at 2015 chained prices) yields intensities of 1,124 t CO₂, 1.2 t SOx, 1.8 t NOx, 1.4 t NMVOCs and 19.2 t CO per million euros. Compared with 2021, emission intensity improves, decreasing for all pollutants (–9% CO₂, –22% SOx, –8% NOx, –14% NMVOCs, –7.4% CO).
Since 1990, emission intensity has declined markedly for SOx: –89%, while for the other pollutants the decline is smaller: –68% CO, –61% NOx, –50% CO₂, and –22% NMVOCs. The fastest reduction for all pollutants occurs especially in the most recent years.
| Allegati |
|---|
Titolo
Table 1: Emission intensity in the metallurgical industry in Italy, compared to added value Fonte
ISPRA processing on ISPRA data (data on emissions of CO2, NOx, SOx, CO, NMCOV) and Istat (data on Added Value) |
Thumbnail
Titolo
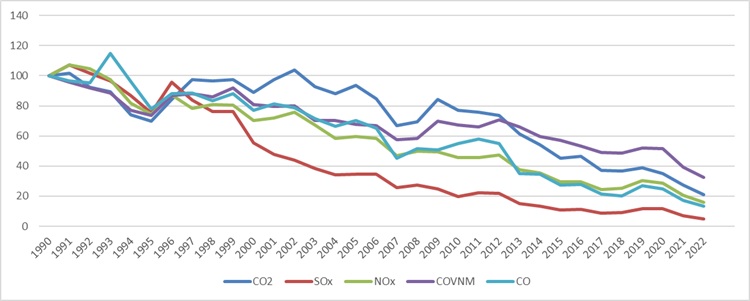
Figure 1: Emission intensity, index 1990 = 100 for CO₂, SOx, NOx, NMVOC, CO in the metallurgical industry Fonte
ISPRA processing on ISPRA and Istat data |
The values show strong heterogeneity among pollutants, with CO₂ having intensities far higher than the other substances, which are concentrated at much lower levels. The order-of-magnitude differences among contaminants suggest an unbalanced emission mix in which the climate-altering component remains predominant. The other pollutants, although decreasing over time, show values that have now stabilised within a narrow band, indicating a relatively limited contribution to the sector’s overall emission pressure. The set of levels reported in the table also highlights non-uniform year-to-year deviations among pollutants, indicating non-homogeneous emission dynamics within the same productive activity.