Giovanni Finocchiaro, Andrea Gagna, Mariangela Soraci
The efficiency indicator, developed for the years 1995–2023, expresses carbon dioxide emissions per unit of value added in manufacturing and construction industry in Italy. The substantial reduction in emission intensity over time (–45.5% between 1995 and 2023) indicates an improvement in the efficiency level achieved by the Italian manufacturing and construction sectors.
The indicator expresses carbon dioxide emissions per unit of value added of the manufacturing and construction industry in Italy. It is configured as a key environmental indicator: it is communicated annually to the European Commission within the framework of the EU greenhouse gas emission monitoring mechanism and for the implementation of the Kyoto Protocol.
To provide, on a regular basis, information on the main driving factors and to highlight the progress achieved at national level in the industrial sector, from a socio-economic and environmental perspective.
Regulation (EU) No. 525/2013, Article 7(1)(f), establishes that by 15 January of each year (year X), Member States must report to the Commission information on carbon dioxide emission intensity indicators, as defined in Annex 3 of the same Regulation, referring to year X–2.
Commission Implementing Regulation (EU) No. 749/2014 of 30 June 2014 concerns the structure, format, transmission procedures, and review of the information reported by Member States pursuant to Regulation (EU) No. 525/2013 of the European Parliament and of the Council.
Commission Decision 2005/166/EC of 10 February 2005 lays down the arrangements for implementing Decision No. 280/2004/EC of the European Parliament and of the Council concerning the monitoring mechanism for Community greenhouse gas emissions and for implementing the Kyoto Protocol. The Decision establishes the monitoring of all anthropogenic greenhouse gas emissions, the assessment of progress in fulfilling commitments under the UN Framework Convention on Climate Change and the Kyoto Protocol, and ensures timeliness, completeness, accuracy, consistency, comparability, and transparency of Community and Member State reporting.
With regard to CO₂ emission intensity indicators, the Decision establishes that, by 15 January 2005 and for each subsequent year, Member States shall transmit data and information relating to priority, additional priority, and supplementary indicators (indicators referred to in Article 3(1)(j) of Decision No. 280/2004/EC).
ISPRA, 2023. Carbon dioxide emission intensity indicators in Italy, year 2023.
none
none
- ISPRA
- ISTAT
ISPRA data are used, in particular CO₂ emission intensity indicators officially transmitted annually to the EU within the framework of the MMR (Monitoring Mechanism Regulation) for greenhouse gases, available at:
https://emissioni.sina.isprambiente.it/wp-content/uploads/2025/04/MMR2025_Art13_AnnexXI_Indicators_2025.xlsx
Value added data available at:
http://dati.istat.it/, various years.
National
1995 - 2023
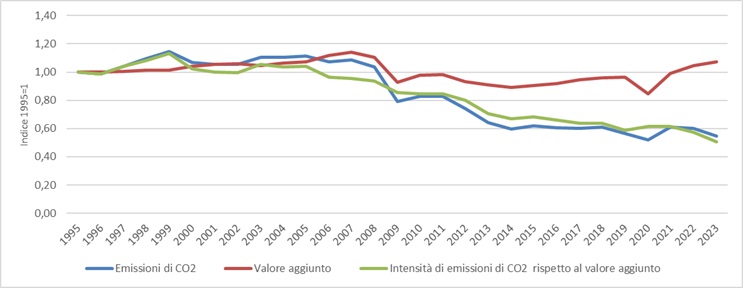
Indicators are obtained from the ratio between CO₂ emissions (t) from energy use in the manufacturing and construction industry in Italy and the sectoral value added (million euros), expressed as fixed-base index numbers (1995 = 1).
CO₂ emissions from energy processes in the manufacturing and construction industry in 2023 amount to 54.9 million tonnes, while sectoral value added amounts to nearly 390 million euros, resulting in an emission intensity of 140.9 t/M€, a value halved compared to 1995 (Table 1 and Figure 1).
CO₂ emissions from energy processes in the manufacturing and construction industry decrease by nearly 46% from 1995 (maximum emission value of the historical series) to 2023. Sectoral value added shows an overall change of –7.3% over the period 1995–2023. The resulting emission intensity, with a maximum value recorded in 1999 (313.5 t/M€) and a value of 140.9 t/M€ in 2023, shows an overall decrease of about –49% (Table 1 and Figure 1).
| Data |
|---|
Headline
Table 1: Intensity of carbon dioxide emissions relating to energy use in the manufacturing and construction industry in Italy, compared to added value Data source
ISPRA processing on ISPRA data (data on CO2 emissions) and ISTAT (data on added value) |
Thumbnail
Headline
Figura 1: Intensità di emissione di CO2 rispetto al valore aggiunto dell'industria manifatturiera ed edilizia Data source
Elaborazione ISPRA su dati ISPRA (dati sulle emissioni di CO2) e ISTAT (dati sul valore aggiunto) |
The substantial reduction in emission intensity over time indicates an improvement in the efficiency level achieved by the Italian manufacturing and construction industry. Alongside the significant decrease in emissions, there is a slight increase in sectoral value added, highlighting a decoupling between pressure and driving force, with a consequent reduction in emission intensity (see Figure 1).