Antonio Caputo
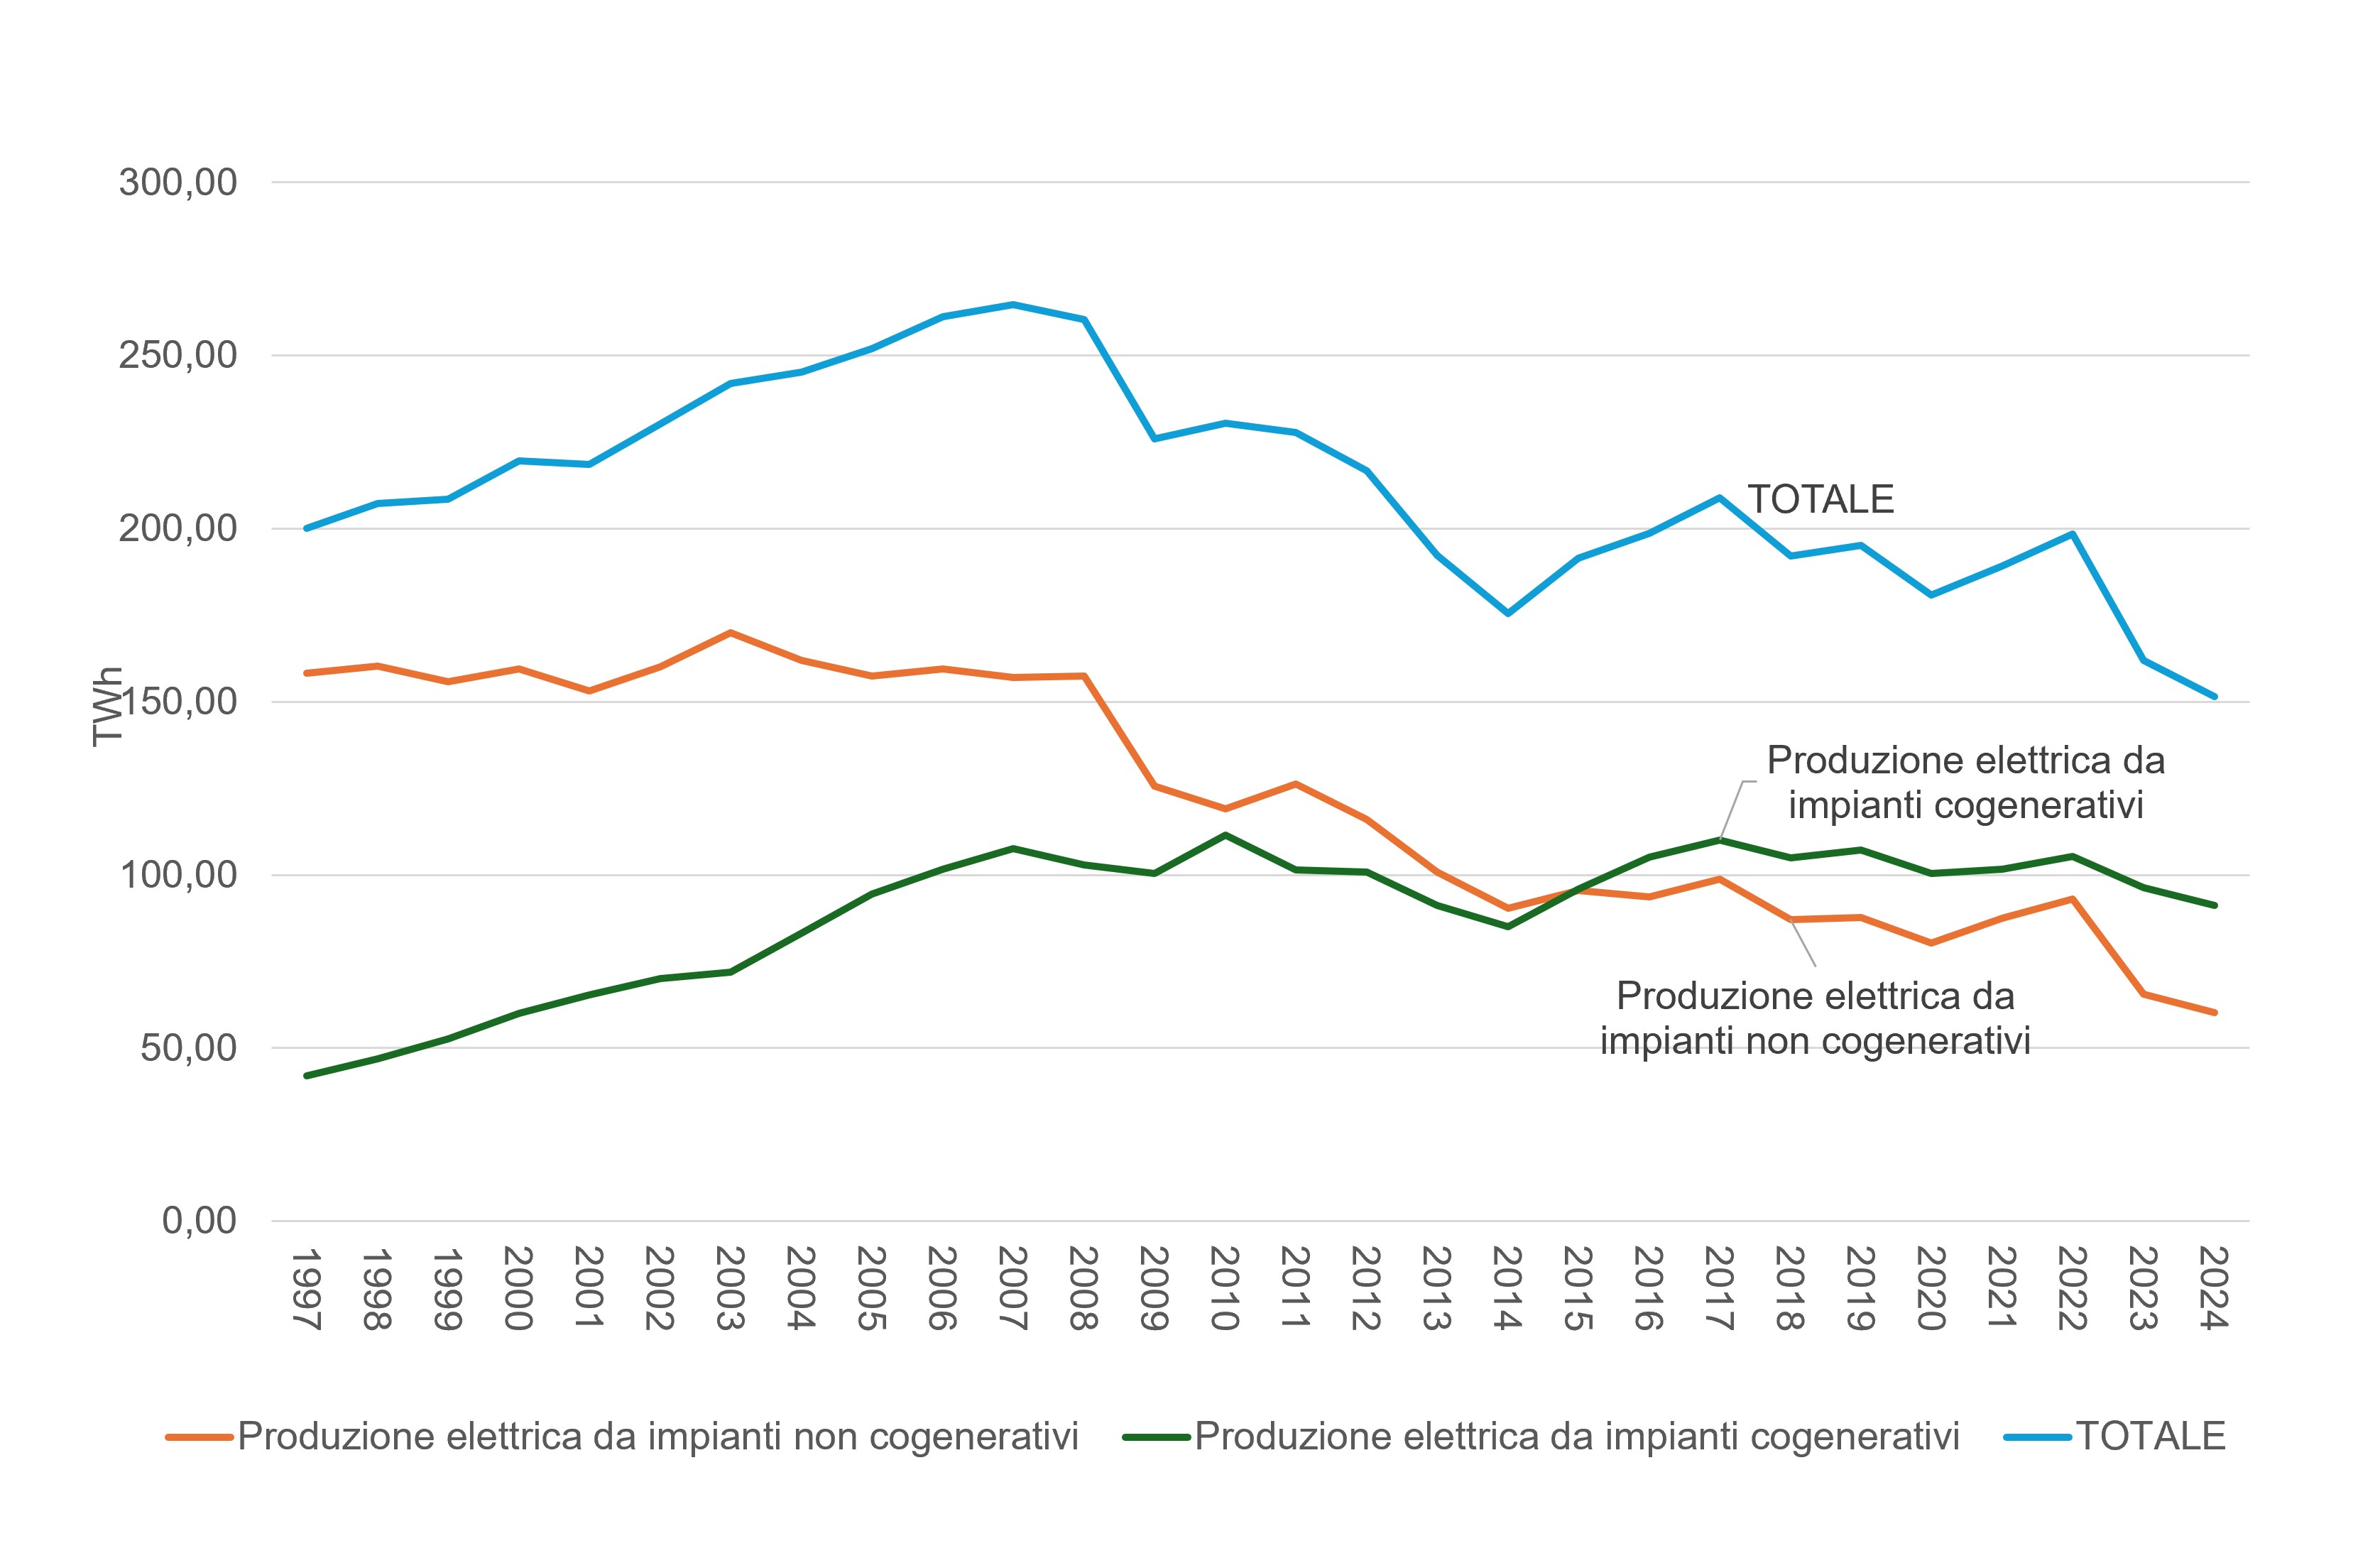
In 1997, gross electricity generation was clearly dominated by conventional power stations producing electricity only (158.2 TWh out of a total of 200.2 TWh), with cogeneration accounting for 42 TWh (21 per cent). In 2024, conventional electricity generation stood at 60.2 TWh, whilst cogeneration accounted for 91.2 GWh (60.2 per cent) out of a total of 151.4 TWh.
The indicator measures the electricity output of combined heat and power plants.
To assess the contribution of combined heat and power plants to total electricity generation, with a view to improving the efficiency of the energy supply.
The current regulatory framework stems from Legislative Decree 79/1999 (the Bersani Decree), which reformed the electricity system, initiating market liberalisation and introducing the first forms of protection and incentives for energy produced through combined heat and power and similar processes. Subsequently, Legislative Decree 20/2007 implemented European Directive 2004/8/EC, with the aim of promoting and structuring cogeneration based on useful heat demand. The Ministerial Decree of 4 August 2011 follows in this vein, having defined the support scheme for High-Efficiency Cogeneration (CAR) by introducing the mechanism of Energy Efficiency Certificates (TEE/White Certificates). Finally, Legislative Decree 28/2011 and Legislative Decree 199/2021 (RED II) have set out the framework for the promotion of energy from renewable sources, encouraging the integration of cogeneration fuelled by biomass and biogas and the development of efficient district heating networks.
TERNA S. p. A., Dati statistici sull’energia elettrica in Italia, anni vari
Terna - Rete Elettrica Nazionale S. p. A.
TERNA S. p. A., Produzione e utilizzo di calore da impianti di cogenerazione elettrica Pubblicazioni Statistiche - Terna spa
National
1997-2024
The data is collected and processed by TERNA S.p.A.
In 2024, total thermoelectric generation (gross and net) reached an all-time low for the series under consideration, at 151.4 TWh and 145.8 TWh respectively. Generation from combined heat and power (CHP) plants stood at 91.2 TWh, accounting for 60.2 per cent of the gross total, whilst generation from electricity-only plants fell to 60.2 TWh. Cogeneration accounted for 87.9 TWh, equivalent to 60.3 per cent of total net thermal generation, whilst non-cogeneration output stood at 57.9 TWh (Tables 1 and 2).
The period between 1997 and 2007, characterised by expansion and restructuring, was marked by the strong growth of combined cycle power generation and industrial cogeneration, a trend that culminated in 2007 when total gross generation reached an all-time high of 264.7 TWh, with cogeneration accounting for 107.7 TWh. In the following decade, from 2008 to 2017, the sector entered a phase of maturity in which gross cogeneration reached its all-time high in 2010 at 111.5 TWh, equivalent to 108.3 TWh net. In the years immediately following, however, the decline in consumption and the massive expansion of renewable sources, such as solar and wind power, significantly reduced the scope for conventional non-cogeneration generation. Finally, between 2018 and 2024 – a period characterised by efficiency measures and the scaling back of thermal generation – against a backdrop of a gradual decline in total thermal electricity output, the percentage share of cogeneration continued to grow steadily as a proportion of the total, consolidating at over 60 per cent in 2024 (Figure 1). Among cogeneration technologies, internal combustion (CIC) stood out in particular, rising to 20,345 GWh gross, as did combined cycle cogeneration (CCC), which, whilst showing a downward trend, continues to represent the main component of the sector with 58.6 TWh gross.
| Data |
|---|
Headline
Table 1: Gross electricity generation from combined heat and power plants. Data source
Terna |
Headline
Table 2: Net electricity generation from combined heat and power plants. Data source
Terna |
Thumbnail
Headline
Figure 1: Electricity generation from non-cogeneration and generation plants. Data source
Terna |
Whilst the decline in non-cogeneration volumes reflects the positive integration of renewable sources into the national electricity mix, the resilience of cogeneration demonstrates the irreplaceable value of integrating electricity and heat in industrial and domestic sectors. The future challenge for cogeneration lies in the gradual transition to decarbonised energy carriers, so as to preserve grid flexibility and industrial heat supply whilst progressing towards climate neutrality.