Gabriele Bellabarba, Maria Logorelli
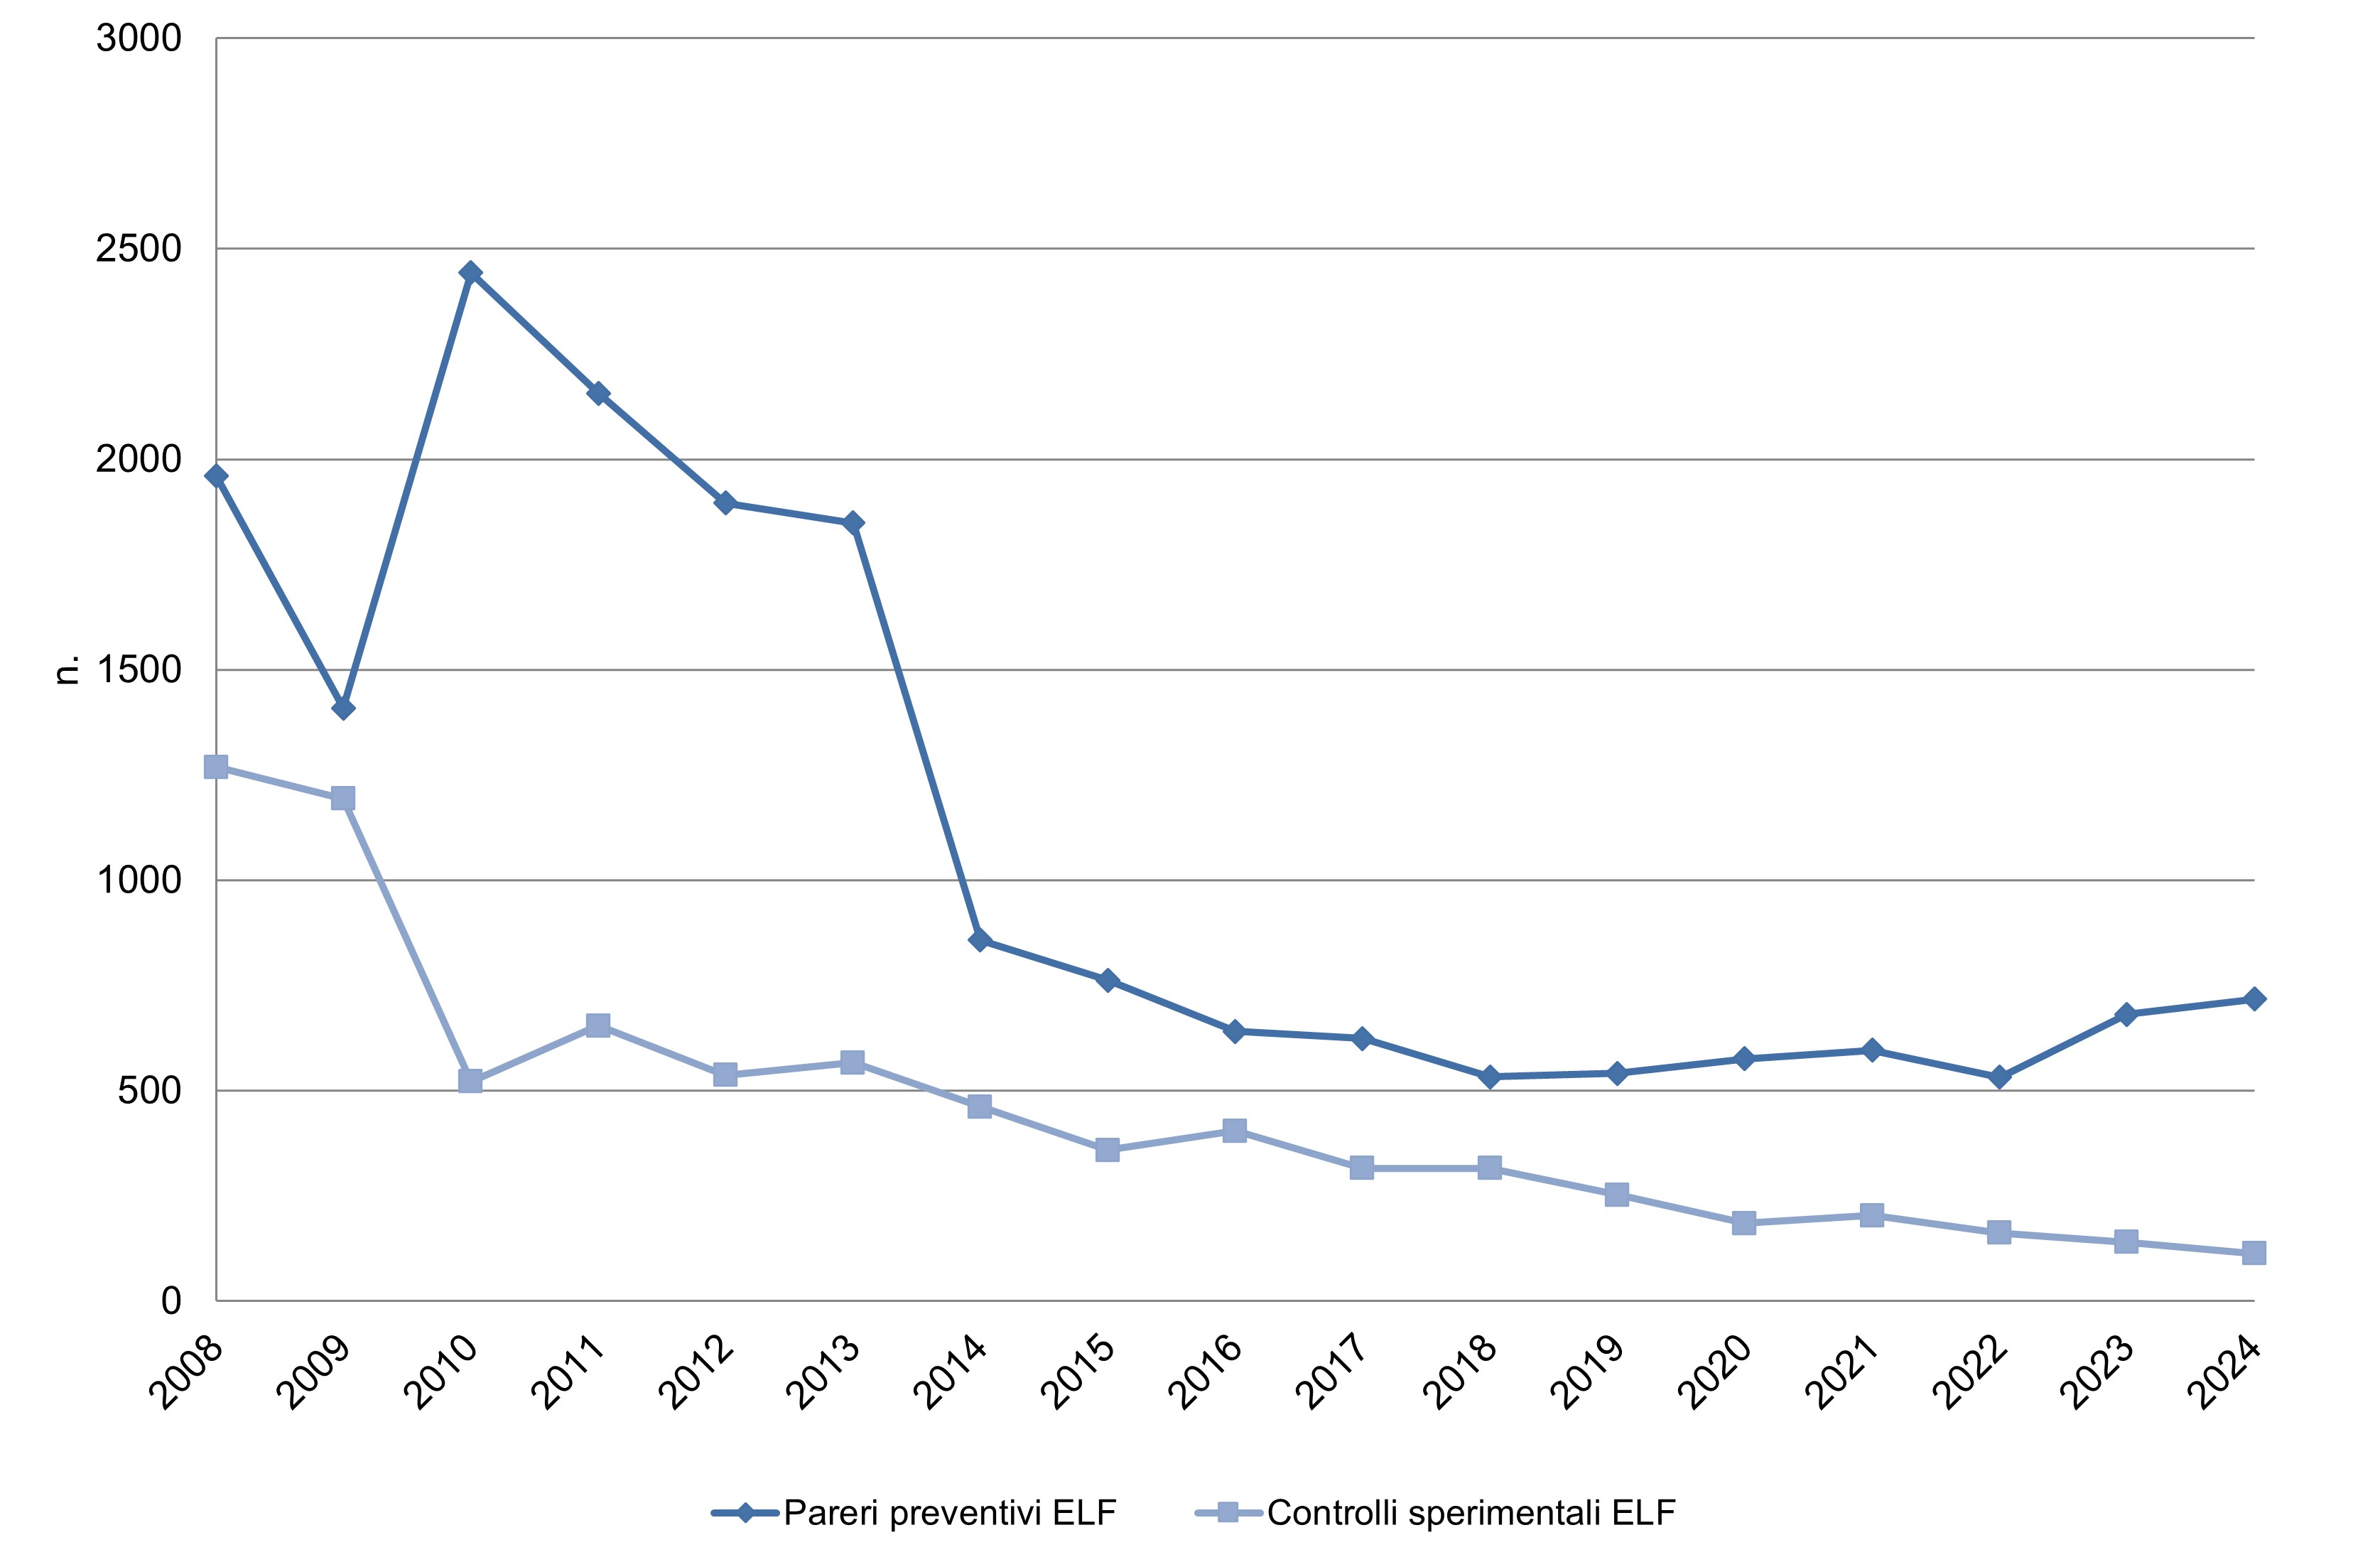
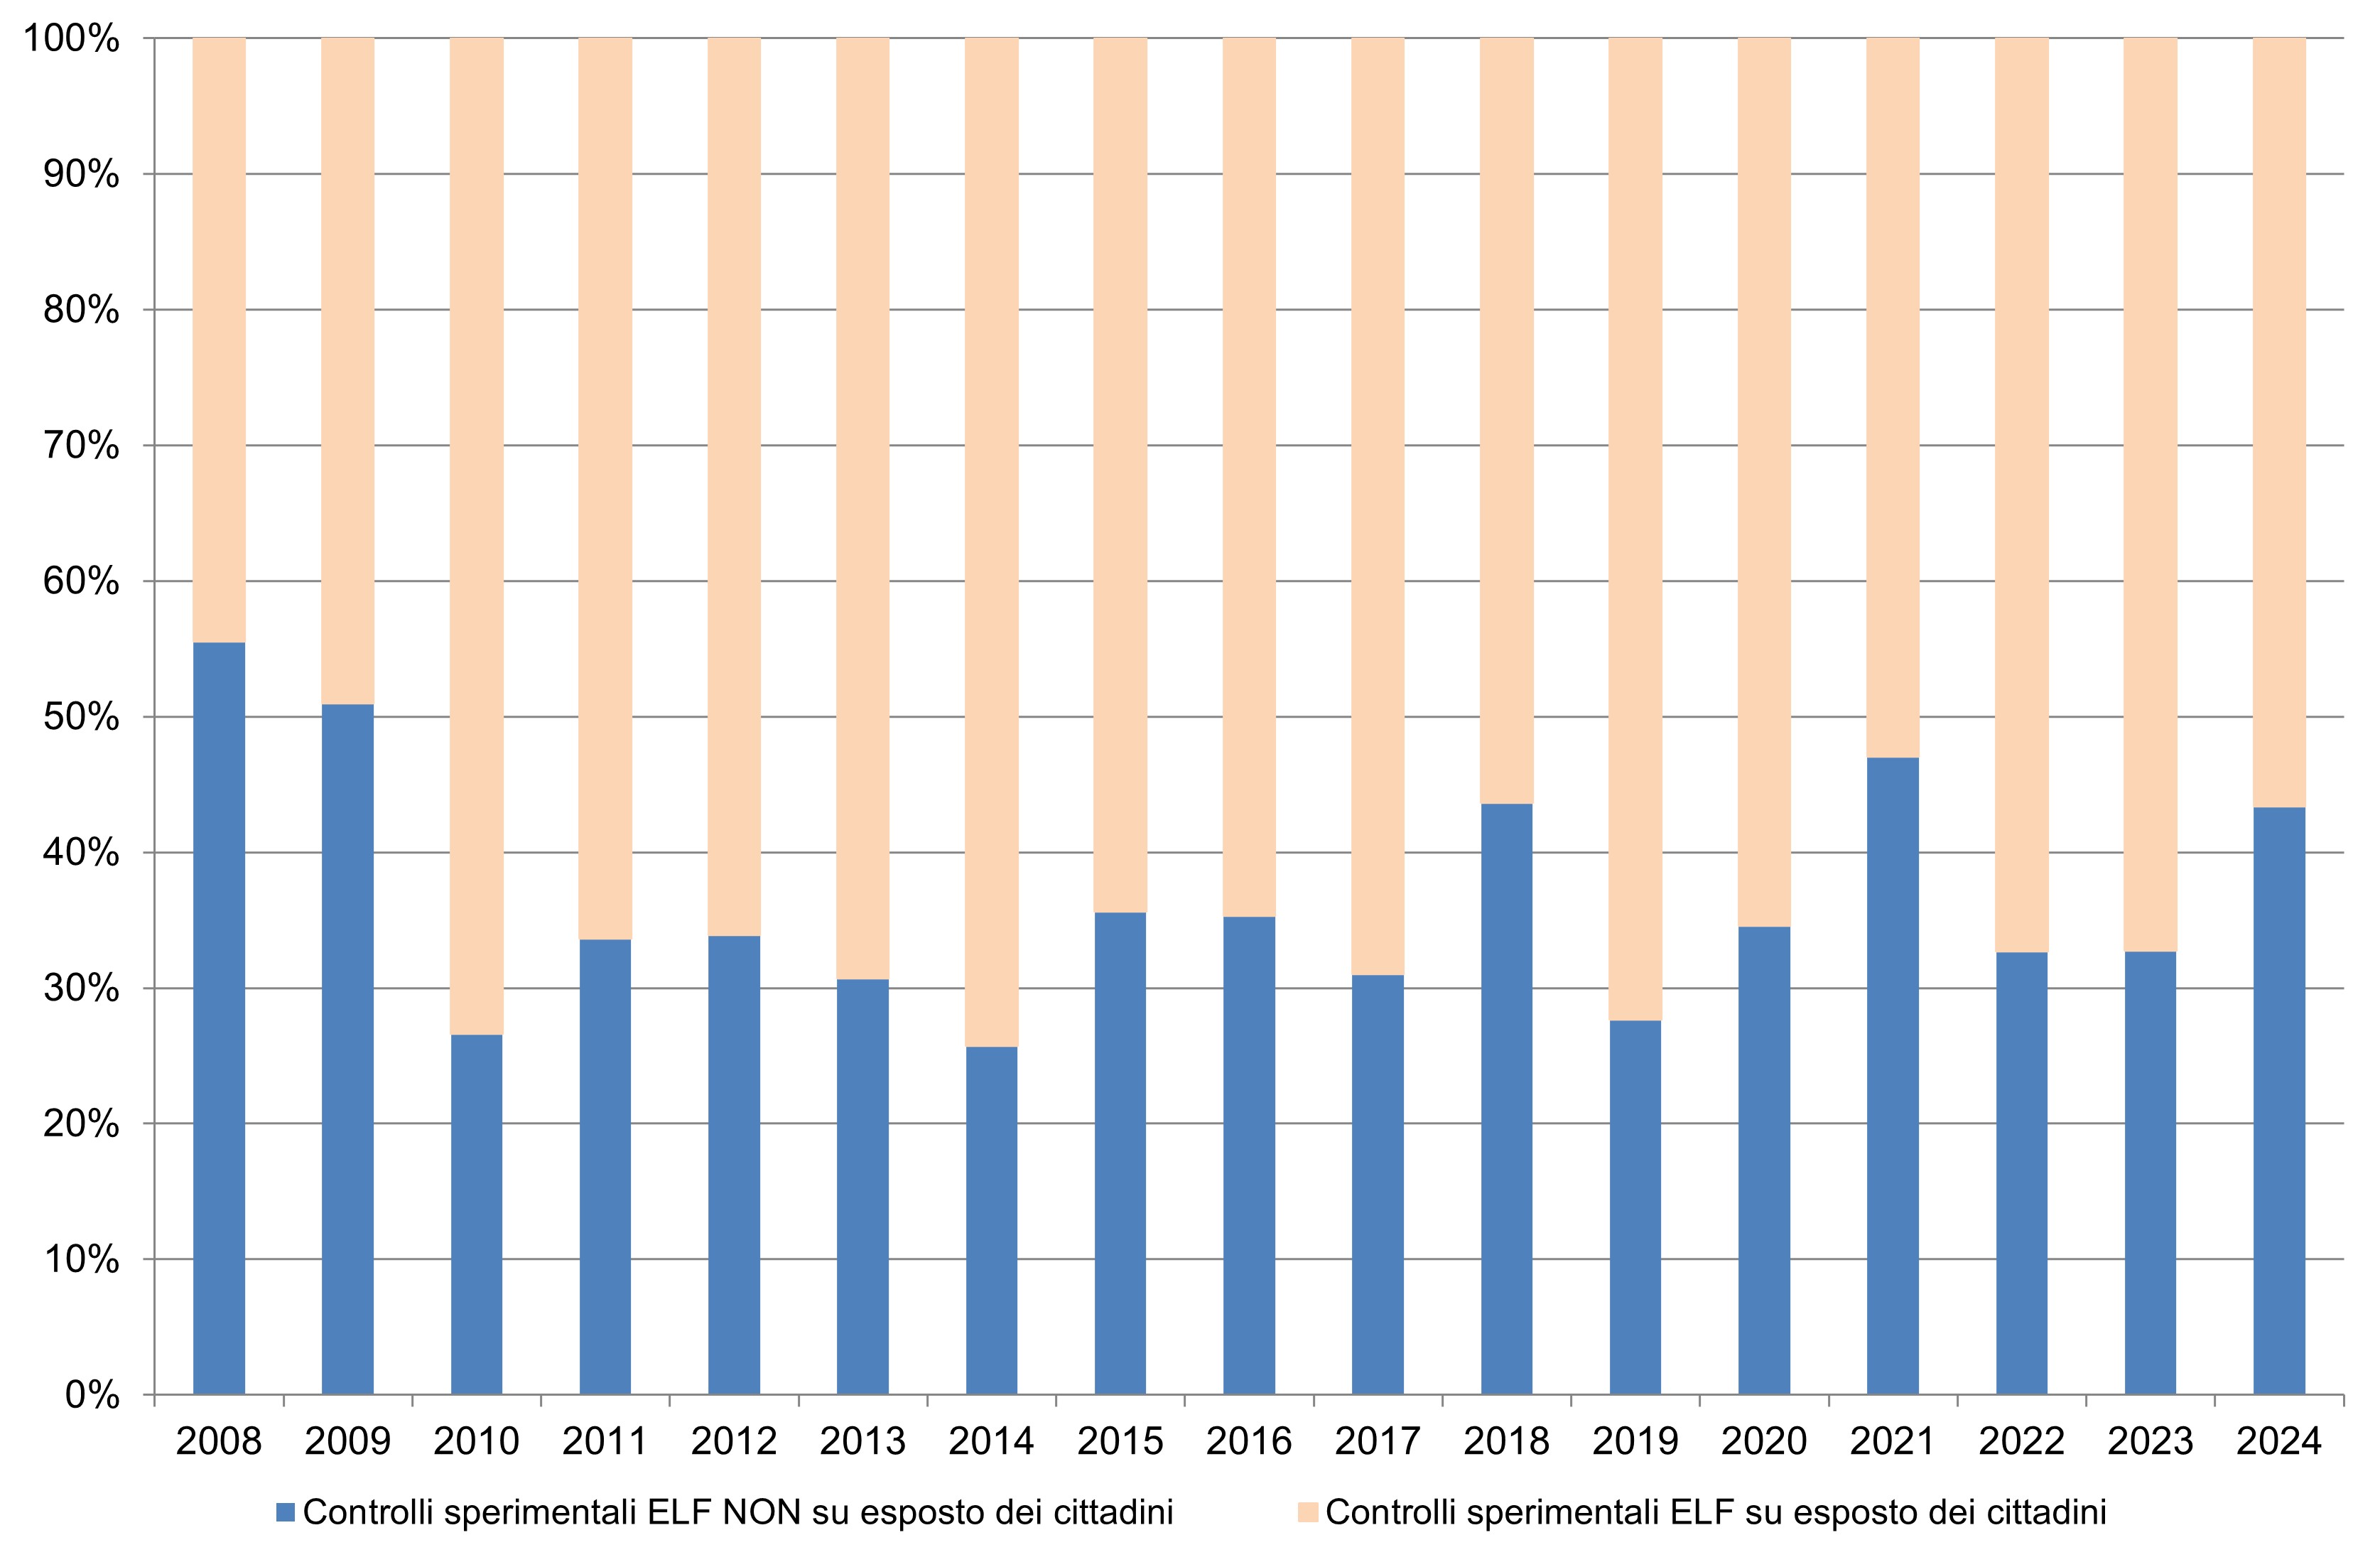
The indicator describes the activity carried out by ARPA/APPA in terms of preventive opinions and experimental checks carried out through field measurements on low frequency sources. Analyzing the period 2008-2024, both for the preventive opinions and for the experimental checks carried out, the trend over time is rather variable but characterized by a general decrease, in fact, from 2008 to 2024 they decreased by 63.4% (going from 1,961 to 718) and 91.1% (going from 1,269 to 113) respectively. The requests for control by citizens through complaints tend to decrease and this gives the perception of a social pressure that tends to fade also for this type of electromagnetic source which in the past has caused many concerns. However, the population's attention remains high in relation to exposure to the electric and magnetic fields generated by power lines, in fact, in 2024 the checks at the request of citizens represent 56.5% of the checks carried out (equal to 96 out of 170).
The indicator describes the activity carried out by ARPA/APPA in terms of preventive opinions and experimental checks carried out through field measurements on low frequency sources. Information is also provided relating to the number of monitoring campaigns conducted by ARPA/APPA in the vicinity of ELF systems and the magnetic induction field levels present in the environment resulting from these continuous measurements.
Quantify the response to the regulatory question regarding the control and supervision activity on ELF systems (electricity lines and transformation cabins).
Framework Law 36/2001; Prime Ministerial Decree 8/07/2003 (ELF); DD 05/29/2008
ISPRA - Environmental data yearbook, various years
ISPRA, Thematic reports
The information relating to the control activity carried out by the ARPA/APPA themselves is affected by some critical issues essentially linked to the availability of consolidated data collection tools at a local level (databases, land registers) and the scarcity of human resources within the ARPA/APPA dedicated to this metadata collection activity.
Synergistic actions by the subjects involved in trying to support the flow of information with suitable regulatory tools and with activities aimed at analyzing the critical issues mentioned above in order to shed light on the problems and propose solutions to give greater uniformity and completeness to the data at a national level.
Electromagnetic Fields Observatory
14/20
2008-2024
Calculation of the overall number of experimental controls for ELF plants on the national territory. Calculation of the total number of preventive opinions for ELF systems on the national territory. In the calculation, the regions that provided updated and complete data are considered.
Considering the complete data provided by the ARPA/APPA representatives for 2023 (Piedmont, Valle d'Aosta, Lombardy, Autonomous Province of Trento, Friuli-Venezia Giulia, Liguria, Emilia-Romagna, Tuscany, Umbria, Lazio, Abruzzo, Molise, Campania, Puglia and Sicily) it is highlighted that the number of experimental checks carried out on power lines (137) is equal to 76.1% of the total ones carried out on ELF sources (180) (Table 1). Even the substations, although to a lesser extent than the electricity lines, continue to be the subject of the control activity of the Agencies considering the critical issues that arise from their particular location (just think of the secondary transformation substations often located inside residential buildings). It is also noted that the population is sensitive to the presence of both these types of ELF sources for which, in 2023, there were 88 checks on power lines requested by citizens compared to 33 on electrical substations. The checks carried out on request for the cabins and electrical lines are equal to 67.2% of the total experimental checks (equal to 121 out of 180) (Table 1).
Analyzing the period 2008-2023, in 2009 there was a decrease in preventive opinions equal to 28.1% (going from 1,961 to 1,409), while in 2010, compared to the previous year, a strong increase (+73.4%) (going from 1,409 to 2,443). From 2011 to 2018, a gradual decline continued, until reaching, in 2018, a value of 527 (-75.6% compared to 2011). In 2019 there is an increase, which, with the exception of 2022 in which there is a decrease (-8.9%), continues until 2023 (+25.9%) (going from 541 to 681). Relative to the experimental controls carried out, the trend over time is rather variable but characterized by a general decrease, in fact, from 2008 to 2023 they decreased by 89% (going from 1,269 to 140). As can be seen from Figure 2, the ELF checks carried out by ARPA/APPA on citizens' complaints compared to the total checks carried out present a rather variable trend: in 2008 the minimum was recorded (44.4%) (equal to 564 out of 1,269) while in 2014 the maximum was recorded (74.2%) (equal to 343 out of 462); in 2023 compared to 2022 there is a decrease of 2.3 percentage points. Both the regions that provided complete data for the period under examination 2008-2023 were considered, as were those for which it was possible to integrate the missing information by reporting the useful information from the previous year or, in the absence of this, that from the first subsequent year available (Piedmont, Valle d'Aosta, Lombardy, Trentino-Alto Adige, Veneto, Friuli-Venezia Giulia, Liguria, Emilia-Romagna, Tuscany, Umbria, Marche, Abruzzo, Puglia and Basilicata).
| Data |
|---|
Headline
Table 1: Opinions and inspections for ELF installations in Italy (2024). Data source
ISPRA processing based on ARPA/APPA data (EMF Observatory) Data legend
a Region/Autonomous Province that provided complete and up-to-date data and was therefore included in the calculation of the overall national total; |
Headline
Table 2: Number of monitoring campaigns carried out in the presence of ELF installations in 2024. Data source
ISPRA processing based on ARPA/APPA data (EMF Observatory)
Data legend
a The data were not updated by the regional contact point; |
Headline
Table 3: Percentages of monitoring campaigns carried out in 2024 on both power lines and electrical substations, with magnetic flux density values falling within the four intervals: 1 microtesla, 1–3 microtesla, 3–10 microtesla, and ≥ 10 microtesla. Data source
ISPRA processing based on ARPA/APPA data (EMF Observatory) Data legend
a The data were not updated by the regional contact point;
|
Thumbnail
Headline
Figure 1: Number of preventive opinions and experimental inspections carried out on ELF installations. Data source
ISPRA processing based on ARPA/APPA data (EMF Observatory)
Note
For the above-mentioned trend analysis, both the Regions/Autonomous Provinces that provided complete data for the entire 2008–2024 time period for ELF sources, and those for which it was possible to integrate missing information by using the relevant data from the previous year or, if unavailable, from the first subsequent year available, were considered. |
Thumbnail
Headline
Figure 2: Percentage of experimental inspections carried out following citizens’ complaints and not following citizens’ complaints on ELF installations. Data source
ISPRA processing based on ARPA/APPA data (EMF Observatory).
Note
For the above-mentioned trend analysis, both the Regions/Autonomous Provinces that provided complete data for the entire 2008–2024 time period for ELF sources, and those for which it was possible to integrate missing information by using the relevant data from the previous year or, if unavailable, from the first subsequent year available, were considered. |
The control activity on ELF plants carried out by ARPA/APPA in the territory tends to decrease in the face of a general decrease in preventive opinions issued by the Agencies themselves but still capable of dealing with control requests from individual citizens. In fact, the population's attention remains high in relation to exposure to electric and magnetic fields generated by power lines. It is necessary to underline that in the face of a stationary mileage of electricity lines, it is natural that control activity tends not to grow but to guarantee control of the main critical situations in the area. In order to evaluate the magnetic induction field levels present in the environment in the presence of ELF systems, the results of the monitoring campaigns carried out in 2023 during the control activity carried out by the ARPA/APPA were collected at a regional level. These results are expressed in terms of the percentage of monitoring campaigns conducted in 2023 both on power lines and on electrical substations, with magnetic induction field values included in the four intervals < 1 microtesla, 1-3 microtesla, 3-10 microtesla, ≥ 10 microtesla. From Table 3 it can be seen that for the autonomous regions/provinces that provided complete and updated data for 2023 (Piedmont, Valle d'Aosta, Lombardy, Autonomous Province of Trento, Friuli-Venezia Giulia, Liguria, Emilia-Romagna, Tuscany, Umbria, Lazio, Abruzzo, Molise, Puglia and Sicily) there were no situations of non-compliance with respect to the attention value of 10 microtesla to exception of one case; however, significant percentages are recorded below 3 microtesla which represents the quality objective set by current legislation. It is evident that in the regions where a greater number of monitoring campaigns have been carried out, the information relating to the levels of electric field present in the environment is more representative of the territorial reality of reference.