Eugenia Gentile, Marco Matiddi, Arianna Orasi, Raffaella Piermarini, Cecilia Silvestri, Tommaso Valente
Since 2015, Italy, in implementation of the Marine Strategy Framework Directive (2008/56/EC), has implemented an extensive marine litter monitoring program, including microlitter present in the surface layer of the water column. The activity is conducted by the National System for Environmental Protection (SNPA), with the coordination of the Ministry of the Environment and Energy Security (MASE). Microwaste, particles of anthropic origin smaller than 5 mm, derive from both primary sources (industrial pellets, cosmetic microgranules, abrasives) and secondary sources (fragmentation of macrowaste). Their composition, quantity and distribution constitute a key parameter for assessing the good environmental status of marine waters. The processing of data collected from 2015 to 2024 highlights a stable median density of 0.04 microparticles/m² (approximately 40,000 microparticles/km²), with interannual and spatial variations linked to the different hydrodynamic conditions and anthropic pressures of the Italian marine subregions. In 2024 there is an increase in concentrations in the Adriatic Sea and a decrease in the Ionian Sea and the western Mediterranean. At Mediterranean level, the Barcelona Convention has defined a threshold value of 0.000845 microparticles/m² (845 microparticles/km²) for achieving good environmental status: the values found in Italian seas, although stable in recent years, are still significantly higher.
The definition of "good environmental status" (GES) for Descriptor 10, pursuant to Ministerial Decree 15 February 2019, states: "G 10.1 - The composition and quantity of marine waste on the coast, in the superficial layer of the water column, on the seabed, of microlitter in the superficial layer of the water column and of marine waste ingested by marine animals are such as not to cause significant impacts on the coastal and marine ecosystem." The indicator allows you to measure the number of microparticles per square meter of sea surface, providing an estimate of the level of microlitter pollution in waters. Microparticles are particles of anthropic origin, solid, synthetic and/or of a polymeric matrix, with dimensions less than 5 mm. These particles can derive from primary sources, such as industrial pellets or microgranules used in cosmetics and abrasive products, or from secondary sources, linked to the fragmentation and degradation of macrowaste. The degradation of plastic objects, and the consequent formation of microparticles, can have effects on marine organisms through direct or involuntary ingestion, with potential transfer along the food web.
Measure the concentration of microwaste present in the surface layer of the water column. Monitoring this parameter over time allows us to evaluate the variations in the pressure exerted by marine waste on the ecosystem and to verify whether the prevention measures, reduction of inputs and increase in waste collection at sea and along the coasts are contributing to the improvement of the overall environmental state of marine waters.
Directive 2008/56/EC.
Legislative Decree no. 190 of 13 October 2010.
Decision (EU) 2017/848 of the Commission of 17 May 2017 which defines the criteria and methodological standards relating to the good ecological status of marine waters as well as the specifications and standardized methods of monitoring and evaluation, and which repeals and replaces Decision 2010/477/EU.
UNEP/MAP Barcelona Convention -United Nations Environment Program Mediterranean Action Plan UNEP/MED WG.550/13.2023. Updated Baseline Values (BV) and Threshold Values (TV) for IMAP Common Indicator 23 (Seafloor macro-litter, Floating micro-plastics).
Baini, M., Fossi, M. C., Galli, M., Caliani, I., Campani, T., Finoia, M. G., Panti, C., 2018. Abundance and characterization of microplastics in the coastal waters of Tuscany (Italy): The application of the MSFD monitoring protocol in the Mediterranean Sea. Mar. Pollut. Bull. 133, 543–552. https://doi. org/10.1016/J. MARPOLBUL.2018.06.016.
Caldwell, J., Muff, L. F., Pham, C. K., Petri-Fink, A., Rothen-Rutishauser, B., Lehner, R., 2020. Spatial and temporal analysis of meso- and microplastic pollution in the Ligurian and Tyrrhenian Seas. Mar. Pollut. Bull. 159, 111515. https://doi. org/10.1016/j. marpolbul.2020.111515.
De Lucia G. A., Vianello A., Camedda A., Vani D., Tomassetti P., Coppa S., Palazzo L., Amici M., Romanelli G., Zampetti G., Cicero A. M., Carpentieri S., Di Vito S. And Matiddi M., 2018. Contamination of the Italian Minor Islands by micro-plastics pollution: investigation of the clearest Italian sea waters. Water. 10 (8),1108. Https://doi. org/10.3390/w10081108.
De Lucia G. A., Caliani I., Marra S., Camedda A., Coppa S., Alcaro L., Campani T., Giannetti M., Coppola D., Cicero A. M., Panti C., Baini M., Guerranti C., Marsili L., Massaro G.., Fossi M. C. And Matiddi M. 2014. Amount and distribution of neustonic micro-plastic off the Western Sardinian coast (Central-Western Mediterranean Sea). Marine Environmental Research. 100, 10-16. DOI: 10.1016/j. marenvres.2014.03.017.
Marrone, A., La Russa, M. F., Randazzo, L., La Russa, D., Cellini, E., Pellegrino, D., 2021. Microplastics in the center of Mediterranean: Comparison of the two Calabrian coasts and distribution from coastal areas to the open sea. Int. J. Environ. Res. Public Health 18, 20. Https://doi. org/10.3390/ijerph182010712.
MSFD-TSGML 2013. Guidance on monitoring of marine litter in European Seas. A guidance document within the common implementation strategy for the marine strategy framework directive. EUR-26113 EN. JRC Scientific and Policy Reports JRC83985. http://mcc. jrc. ec. europa. eu/documents/201702074014. pdf .
Sbrana A., Valente T., Bianchi J., Franceschini S., Piermarini R., Saccomandi ·F., De Lucia A. G., Camedda A., Matiddi M., Silvestri C., 2023. From inshore to offshore: distribution of microplastics in three Italian seawaters. Environmental Science and Pollution Research https://doi. org/10.1007/s11356-022-23582-9.
UNEP/MED WG.482/19. 2020. Monitoring Guidelines/Protocols for Floating Microplastics.
UNEP/MED WG.567/Inf.3.2023. 2023 Mediterranean Quality Status Report.
The evaluation of the trend of microwaste concentrations in the surface layer of the water column is limited by the high spatial and temporal variability of the phenomenon, influenced by hydrodynamic factors and local anthropic pressures. Only long historical data series and homogeneous sampling in time and space would allow the identification of statistically significant and reliable variations.
Coastal ARPA
http://www. db-strategiamarina. isprambiente. it/app/#/
National
2015-2024
The indicator expresses the concentration of microwaste in the surface layer of the water column. The concentration of microplastics is expressed as the number of objects per m 2 of sampled seawater. The calculation of the quantity of microparticles/m 2 is performed on the basis of the filtered water surface (S) calculated using the following formula:
S = L x W
where:
L is the length of the sampled linear path, l is the width of the manta ray's mouth.
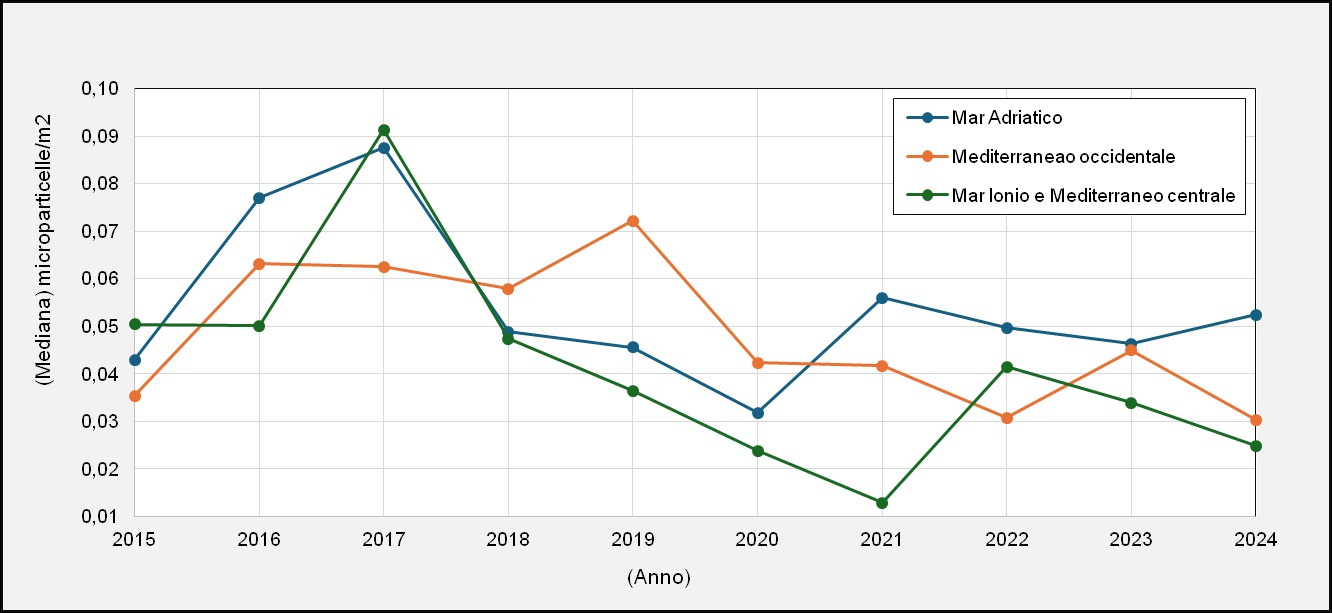
In 2024, the median concentrations of marine microlitter in the three Italian sub-regions (Adriatic Sea, Western Mediterranean, Ionian Sea and Central Mediterranean) show values between 0.025 and 0.052 microparticles/m² (Figure 1). Although in some areas a reduction is observed compared to previous years, the levels recorded still remain well above the threshold value defined under the Barcelona Convention, equal to 0.000845 microparticles/m².
At a European level, a threshold value for the assessment of good environmental status in relation to microwaste has not yet been established, however, the Mediterranean reference provides a useful parameter to contextualize current conditions. Despite some signs of improvement in specific sub-regions, the overall picture for 2024 therefore confirms a still significant pressure from micro-waste in Italian seas, requiring the maintenance and strengthening of measures for monitoring and reducing waste sources.
The evaluation of the trend of microlitter concentrations on the sea surface is complex, unless sufficiently long historical series of data are available. The spatial distribution of microwaste is influenced by multiple natural and anthropogenic factors. The floating particles are transported by the surface movements of the water masses and by the winds, while in coastal areas the accumulation and dispersion are conditioned by local pressures such as proximity to large urban centres, ports, industrial activities, fishing, aquaculture, coastal tourism and recreational boating. In light of this high space-time variability, which makes the evaluation of annual trends complex, it was considered methodologically more appropriate to use the median rather than the average, as it is a more robust measure with respect to extreme values and episodic fluctuations linked to the hydrodynamic processes and anthropic pressures described above. Based on these medians, the status assessment for 2024 highlights a general improvement in median microwaste concentrations compared to 2023 for two of the three monitored subregions (Figure 1). The Adriatic Sea shows a slight rise (from 0.046 to 0.052 microparticles/m²), but still remains at low levels and much lower than the maximums recorded in the previous three years (0.056 in 2021 and 0.050 in 2022). In the western Mediterranean, a decrease was recorded (from 0.045 to 0.030), confirming the reduction trend observed since the recent peak in 2022 (0.031). In the Ionian Sea and central Mediterranean, however, the downward phase continues (from 0.034 to 0.025), consolidating levels much lower than the recent maximum of 2022 (0.041). Overall, 2024 presents itself as a year of further stabilization and reduction in microwaste pressures for two out of three subregions, while the Adriatic shows a moderate increase which does not change the general trend of decrease compared to the highest values of the 2021–2022 period (Figure 1).
| Data |
|---|
Headline
Figure 1: Trend in median surface microlitter concentrations in subregions Data source
ISPRA processing on ARPA data |
Thumbnail
Headline
Figure 1: Trend in median surface microlitter concentrations in subregions Data source
ISPRA processing on ARPA data |
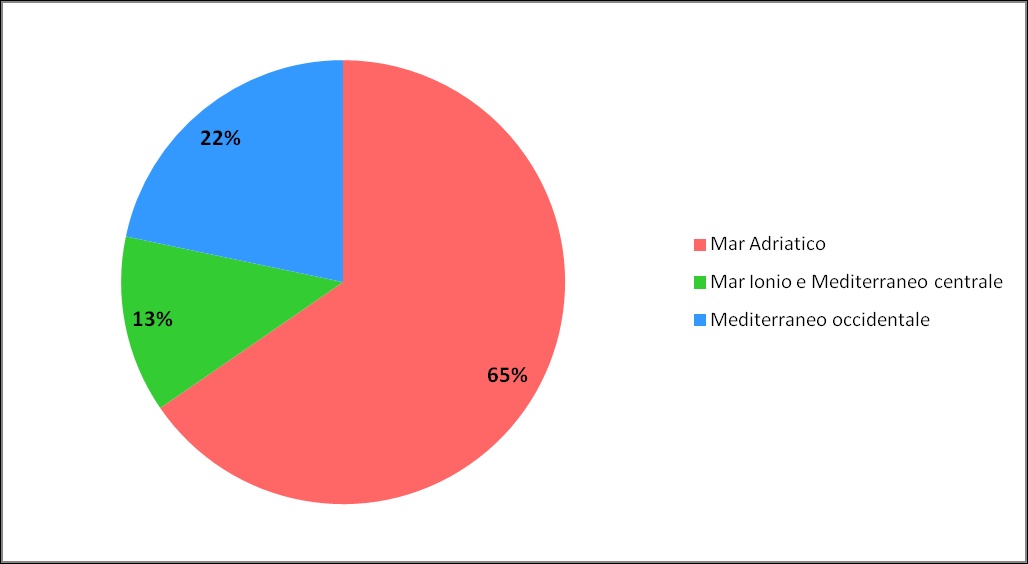
Headline
Figure 2: Contribution of each subregion to the territorial concentration of microparticles Data source
ISPRA processing on ARPA data |
Thumbnail
Headline
Figure 2: Contribution of each subregion to the territorial concentration of microparticles Data source
ISPRA processing on ARPA data |
Headline
Figure 3,4,5: Concentrazione annuale percentuale dei microrifiuti nel Mar Adriatico, Mediterraneo occidentale, Mar Ionio e Mediterraneo centrale Data source
Elaborazione ISPRA su dati ARPA Data legend
Le linee blu rappresentano le percentuali annuali delle concentrazioni dei microrifiuti rispetto al totale nazionale. |
Thumbnail
Headline
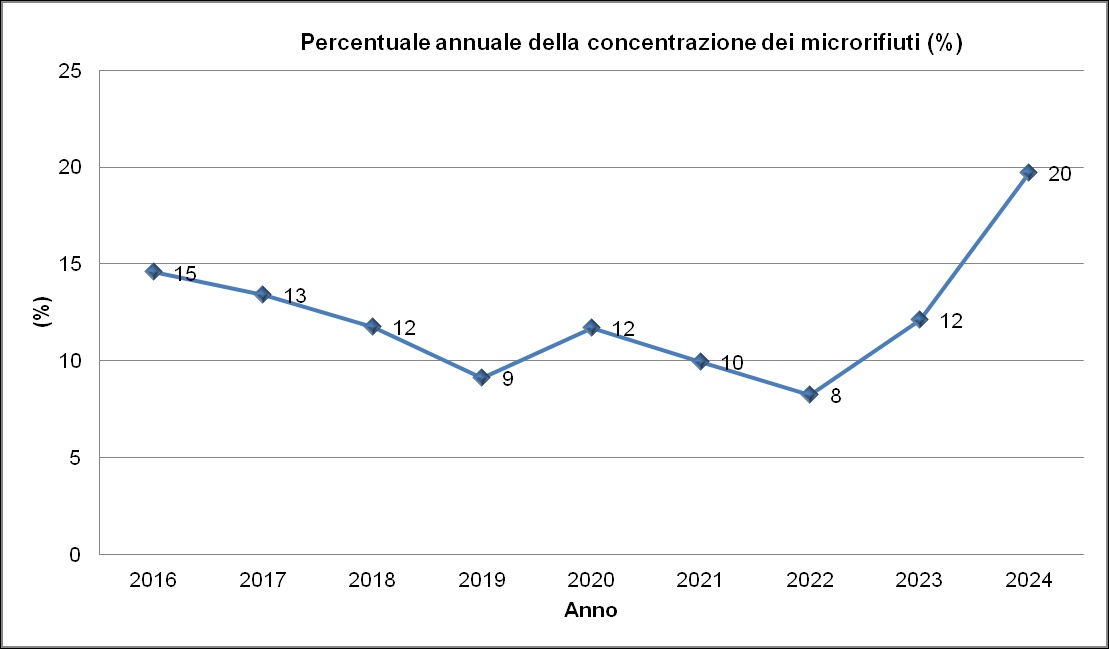
Figure 3: Percentage annual concentration of microwaste in the Adriatic Sea Data source
ISPRA processing on ARPA data Data legend
The blue line represents the annual percentage of microwaste concentration compared to the national total. |
Thumbnail
Headline
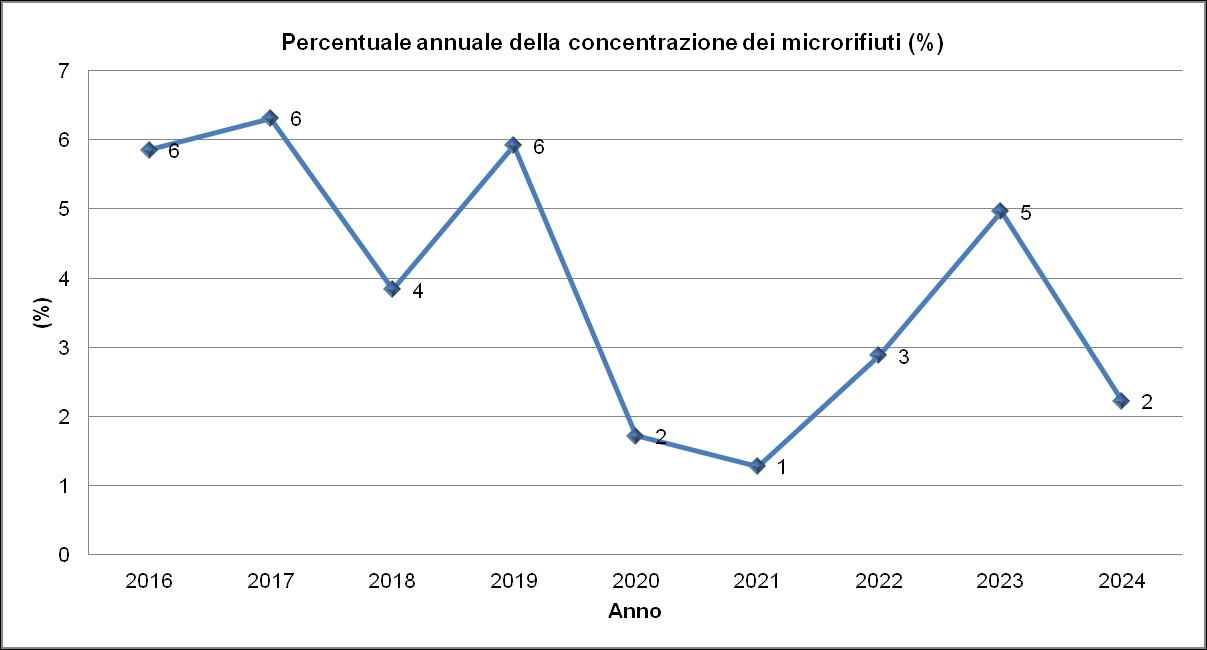
Figure 4: Annual percentage concentration of microlitter in the Ionian Sea and central Mediterranean Data source
ISPRA processing on ARPA data Data legend
The blue line represents the annual percentage of microwaste concentration compared to the national total. |
Thumbnail
Headline
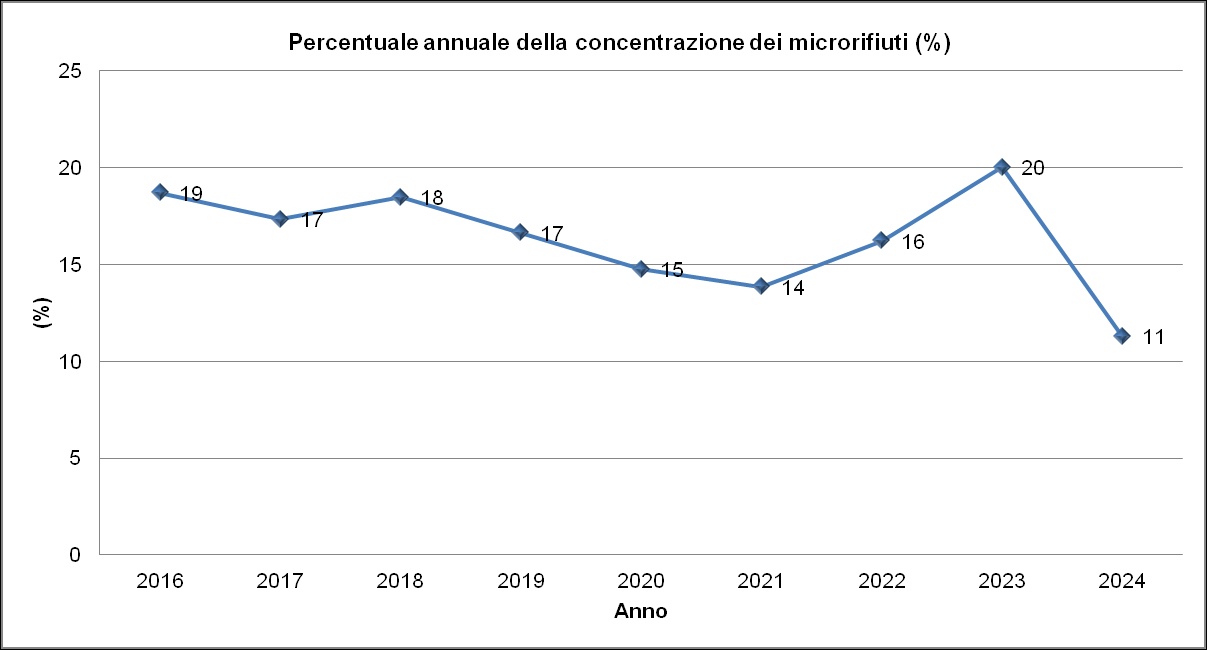
Figure 5: Percentage annual concentration of microwaste in the Western Mediterranean Data source
ISPRA processing on ARPA data Data legend
The blue line represents the annual percentage of microwaste concentration compared to the national total. |
2015 represented the pilot year for the development of the sampling and analysis methods, while the data collected from 2016 to 2024 were used to feed the indicator. The joint reading of the annual trends and the spatial distribution of concentrations allows us to highlight some relevant dynamics in the three sub-regions considered. In the period 2016–2024, the annual percentage of the overall concentration of microwaste presents limited oscillations (14–19%), consistent with the high spatio-temporal variability typical of this descriptor (Figures 3,4,5). As already highlighted, this variability depends on hydrodynamic factors and localized anthropic pressures, which make it necessary to use the median, which is more representative of the central tendency than the mean in the presence of extreme values.
As can be seen from Figure 2, in 2024, the Adriatic Sea represents the largest share of the overall contribution to microwaste concentrations (65.4%), followed by the Western Mediterranean (21.7%) and the Ionian Sea and Central Mediterranean (12.9%). The variations observed suggest an increasing concentration of microwaste in the Adriatic basin, probably influenced by more closed hydrodynamic conditions, limited depth and high river input compared to other sub-regions.
In the Adriatic Sea (Figure 3), the concentration percentage of microwaste increased from 12% in 2023 to 19.7% in 2024. This is a very marked increase: in practice, in 2024 the Adriatic share was approximately two thirds higher than the previous year.
In the Ionian Sea and Central Mediterranean subregion (Figure 4), the percentage instead decreased from 5% in 2023 to 2.2% in 2024. The reduction is notable: it means that the relative presence of microwaste in this area in 2024 was approximately half compared to 2023.
In the western Mediterranean (Figure 5), the percentage of microwaste concentration went from 20% in 2023 to 11% in 2024, showing a strong decrease. In simple terms, in 2024 this subregion recorded almost a halving compared to the previous year. Analyzing the trend of the blue line in the three graphs, it therefore emerges that in 2024 the phenomenon presents clearly differentiated trends between the subregions, a marked increase in the Adriatic and a significant decrease in the Ionian and western Mediterranean.