Tomaso Fortibuoni, Francesca Ronchi, Cecilia Silvestri
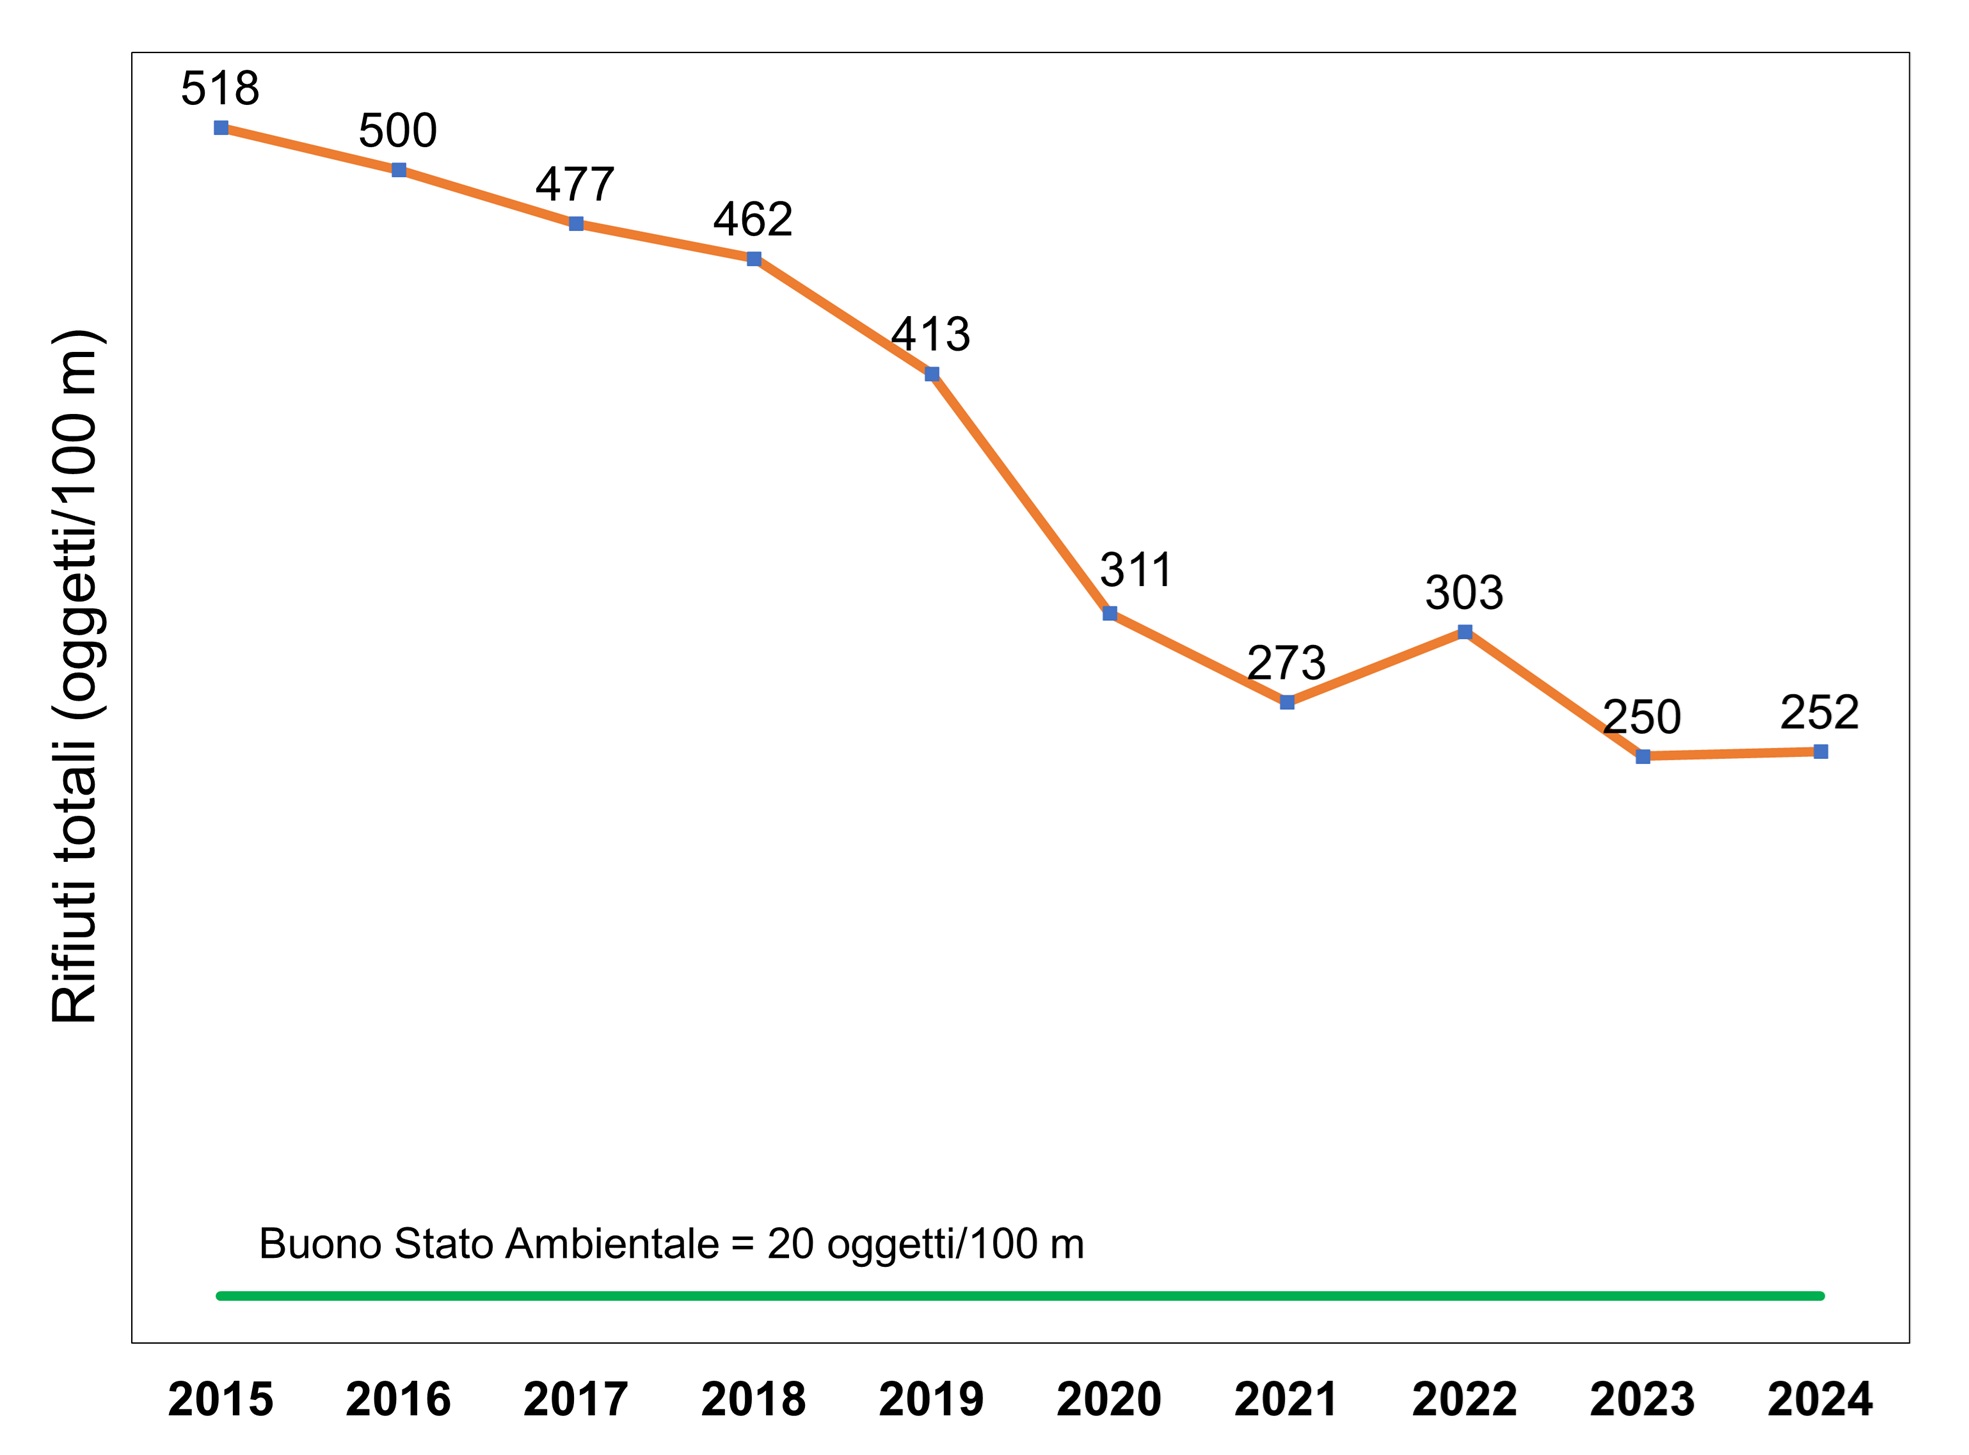
The Marine Strategy (Directive 2008/56/EC) represents an important governance tool for the sea system, promoting the adoption of strategies aimed at safeguarding the marine ecosystem aimed at achieving Good Environmental Status. Good Environmental Status is assessed on the basis of 11 qualitative descriptors and, among these, Descriptor 10 provides that the properties and quantities of marine waste do not cause damage to the coastal and marine environment. Since 2015, Italy has been implementing an extensive monitoring program for marine litter, including beached macro-litter. In 2024, the median of total marine waste stranded on Italian coasts was equal to 252 waste per 100 m, a value similar to that of the previous year (250 waste per 100 m). This is a density that confirms the decreasing trend of beached waste since monitoring was carried out, although still significantly higher than the threshold value of 20 waste per 100 m, established at European level as a requirement for achieving Good Environmental Status. As in previous years, single-use plastics are the most common beached waste, representing approximately 28% of the total, followed by smoking-related waste (mainly cigarette butts), equal to 9% of the waste recorded along the Italian coasts.
Directive 2008/56/EC (implemented by Legislative Decree 190/2010) adopts measures to protect the marine ecosystem in order to achieve and maintain Good Environmental Status through 11 Descriptors. Descriptor 10 refers to marine litter and one of its variations, indicated as Criterion D10C1, sets the objective for Member States that the composition, quantity and distribution of waste on the coast, in the superficial layer of the water column and on the bottom are such as not to cause damage to the coastal and marine environment.
The monitoring of waste on Italian coasts is carried out by the National System for Environmental Protection (SNPA), with the technical and scientific coordination of the Higher Institute for Environmental Protection and Research (ISPRA), in compliance with the European protocol applied by all Member States (MSFD Technical Group on Marine Litter, 2023). The Ministry of the Environment and Energy Security (MASE) is the competent authority that guarantees the coordination of the activities envisaged within the application of the Marine Strategy in Italy.
Twice a year (spring and autumn), coastal ARPAs monitor waste larger than 2.5 cm in sample areas on 69 beaches located along the entire Italian coast. The indicator represents the linear density along the coasts of different categories of waste (total waste, single-use plastics, waste related to fishing and aquaculture, plastic bags and waste related to smoking), expressed in number of objects per 100 meters of coastline. It allows us to identify the main types of waste present on the Italian coasts and to monitor over time the effectiveness of the measures adopted for their reduction, as well as to verify the gradual approach of the measured densities to the threshold value of 20 total waste every 100 m, defined at European level as a requirement for achieving Good Environmental Status.
Measure the density of macro-waste along the coasts and identify the main types of waste in each sub-region. Monitor over time the effectiveness of the Marine Strategy Measures Programs and the gradual approach of the measured densities to the threshold value defined at European level as a requirement for achieving Good Environmental Status.
Communication from the Commission on the threshold values set by the Marine Strategy Framework Directive 2008/56/EC and Commission Decision (EU) 2017/848 (C/2024/2078).
Directive 2008/56/EC of the European Parliament and of the Council of 17 June 2008 establishing a framework for community action in the field of marine environmental policy (Marine Strategy Framework Directive).
Legislative Decree 13 October 2010, n. 190 Implementation of Directive 2008/56/EC which establishes a framework for community action in the field of marine environmental policy.
Decree 11 February 2015. Determination of the indicators associated with the environmental goals and monitoring programs, prepared pursuant to articles 10, paragraph 1 and 11, paragraph 1, of Legislative Decree 190/2010.
Commission Decision (EU) 2017/848 of 17 May 2017 defining the criteria and methodological standards relating to the good ecological status of marine waters as well as the specifications and standardized methods for monitoring and evaluation, and repealing Decision 2010/477/EU.
Decree 15 February 2019. Update of the determination of the good environmental status of marine waters and definition of environmental goals.
Directive (EU) 2019/904 of the European Parliament and of the Council of 5 June 2019 on reducing the impact of certain plastic products on the environment.
Legislative Decree 8 November 2021, n. 196 Implementation of Directive (EU) 2019/904, of the European Parliament and of the Council of 5 June 2019 on reducing the impact of certain plastic products on the environment.
Threshold value of 20 objects/100 m indicated at European level as an objective for achieving a Good Environmental Status of the coasts with respect to Descriptor 10 (Commission Notice on the threshold values set under the Marine Strategy Framework Directive 2008/56/EC and Commission Decision (EU) 2017/848).
Hanke G., Walvoort D., van Loon W., Addamo A. M., Brosich A., Montero M. Del Mar C, Jack M. M. E., Vinci M., Giorgetti A. (2019). EU Marine Beach Litter Baselines. JRC Technical Report 2019. Https://ec. europa. eu/jrc.
Fortibuoni T., Amadesi B., Vlachogianni T. (2021). Composition and abundance of macrolitter along the Italian coastline: The first baseline assessment within the European Marine Strategy Framework Directive. Environmental Pollution, 268, 115886. https://doi. org/10.1016/j. envpol.2020.115886.
MSFD Technical Group on Marine Litter, Guidance on the Monitoring of Marine Litter in European Seas An update to improve the harmonized monitoring of marine litter under the Marine Strategy Framework Directive, EUR 31539 EN, Publications Office of the European Union, Luxembourg, 2023, ISBN 978-92-68-04093-5, doi:10.2760/59137, JRC133594.
Van Loon W., Hanke G., Fleet D., Werner S., Barry J., Strand J., Eriksson J., Galgani F., Gräwe D., Schulz M., Vlachogianni T., Press M., Blidberg E., Walvoort D. (2020). A European threshold value and assessment method for macro litter on coastlines, EUR 30347 EN, Publications Office of the European Union, Luxembourg, 2020, ISBN 978-92-76-21444-1 (online), doi:10.2760/54369 (online), JRC121707.
SNPA
National
2015-2024
The sampling of beached waste is carried out within a single transect represented by a 100 m stretch of beach, twice a year (spring and autumn). The sampling area covers the entire depth of the beach, from the shoreline to the dune system or the vegetation and/or artefacts present (for example, roads). The transect is repeated with the greatest possible precision in each sampling and over the years. The beaches monitored in 2024 were 66 in spring and 69 in autumn. All objects larger than 2.5 cm (on their longest side) visible on the beach surface were classified into European-wide codified categories (MSFD Technical Group on Marine Litter, 2023). Densities are expressed as the median of the number of objects per 100 m of beach. The objects were grouped into 4 macro categories linked to different anthropic activities: total waste; single-use plastic objects (SUP); waste from fishing and aquaculture (FISH); plastic bags and bags (BAG); smoking-related waste (SMOKE). The temporal trend of the medians is evaluated using the Mann-Kendall test. The purpose of the Mann-Kendall test is to statistically evaluate the existence of a monotonic trend, positive or negative, of the variable of interest over time. A positive (negative) monotonic trend means that the variable increases (decreases) steadily over time.
The density of waste along the Italian coasts is confirmed, also in 2024, to be very high (median of 252 waste per 100 m) compared to the threshold value established at European level for the achievement of Good Environmental Status (20 objects/100 m; Van Loon et al. 2020) (Figure 1).
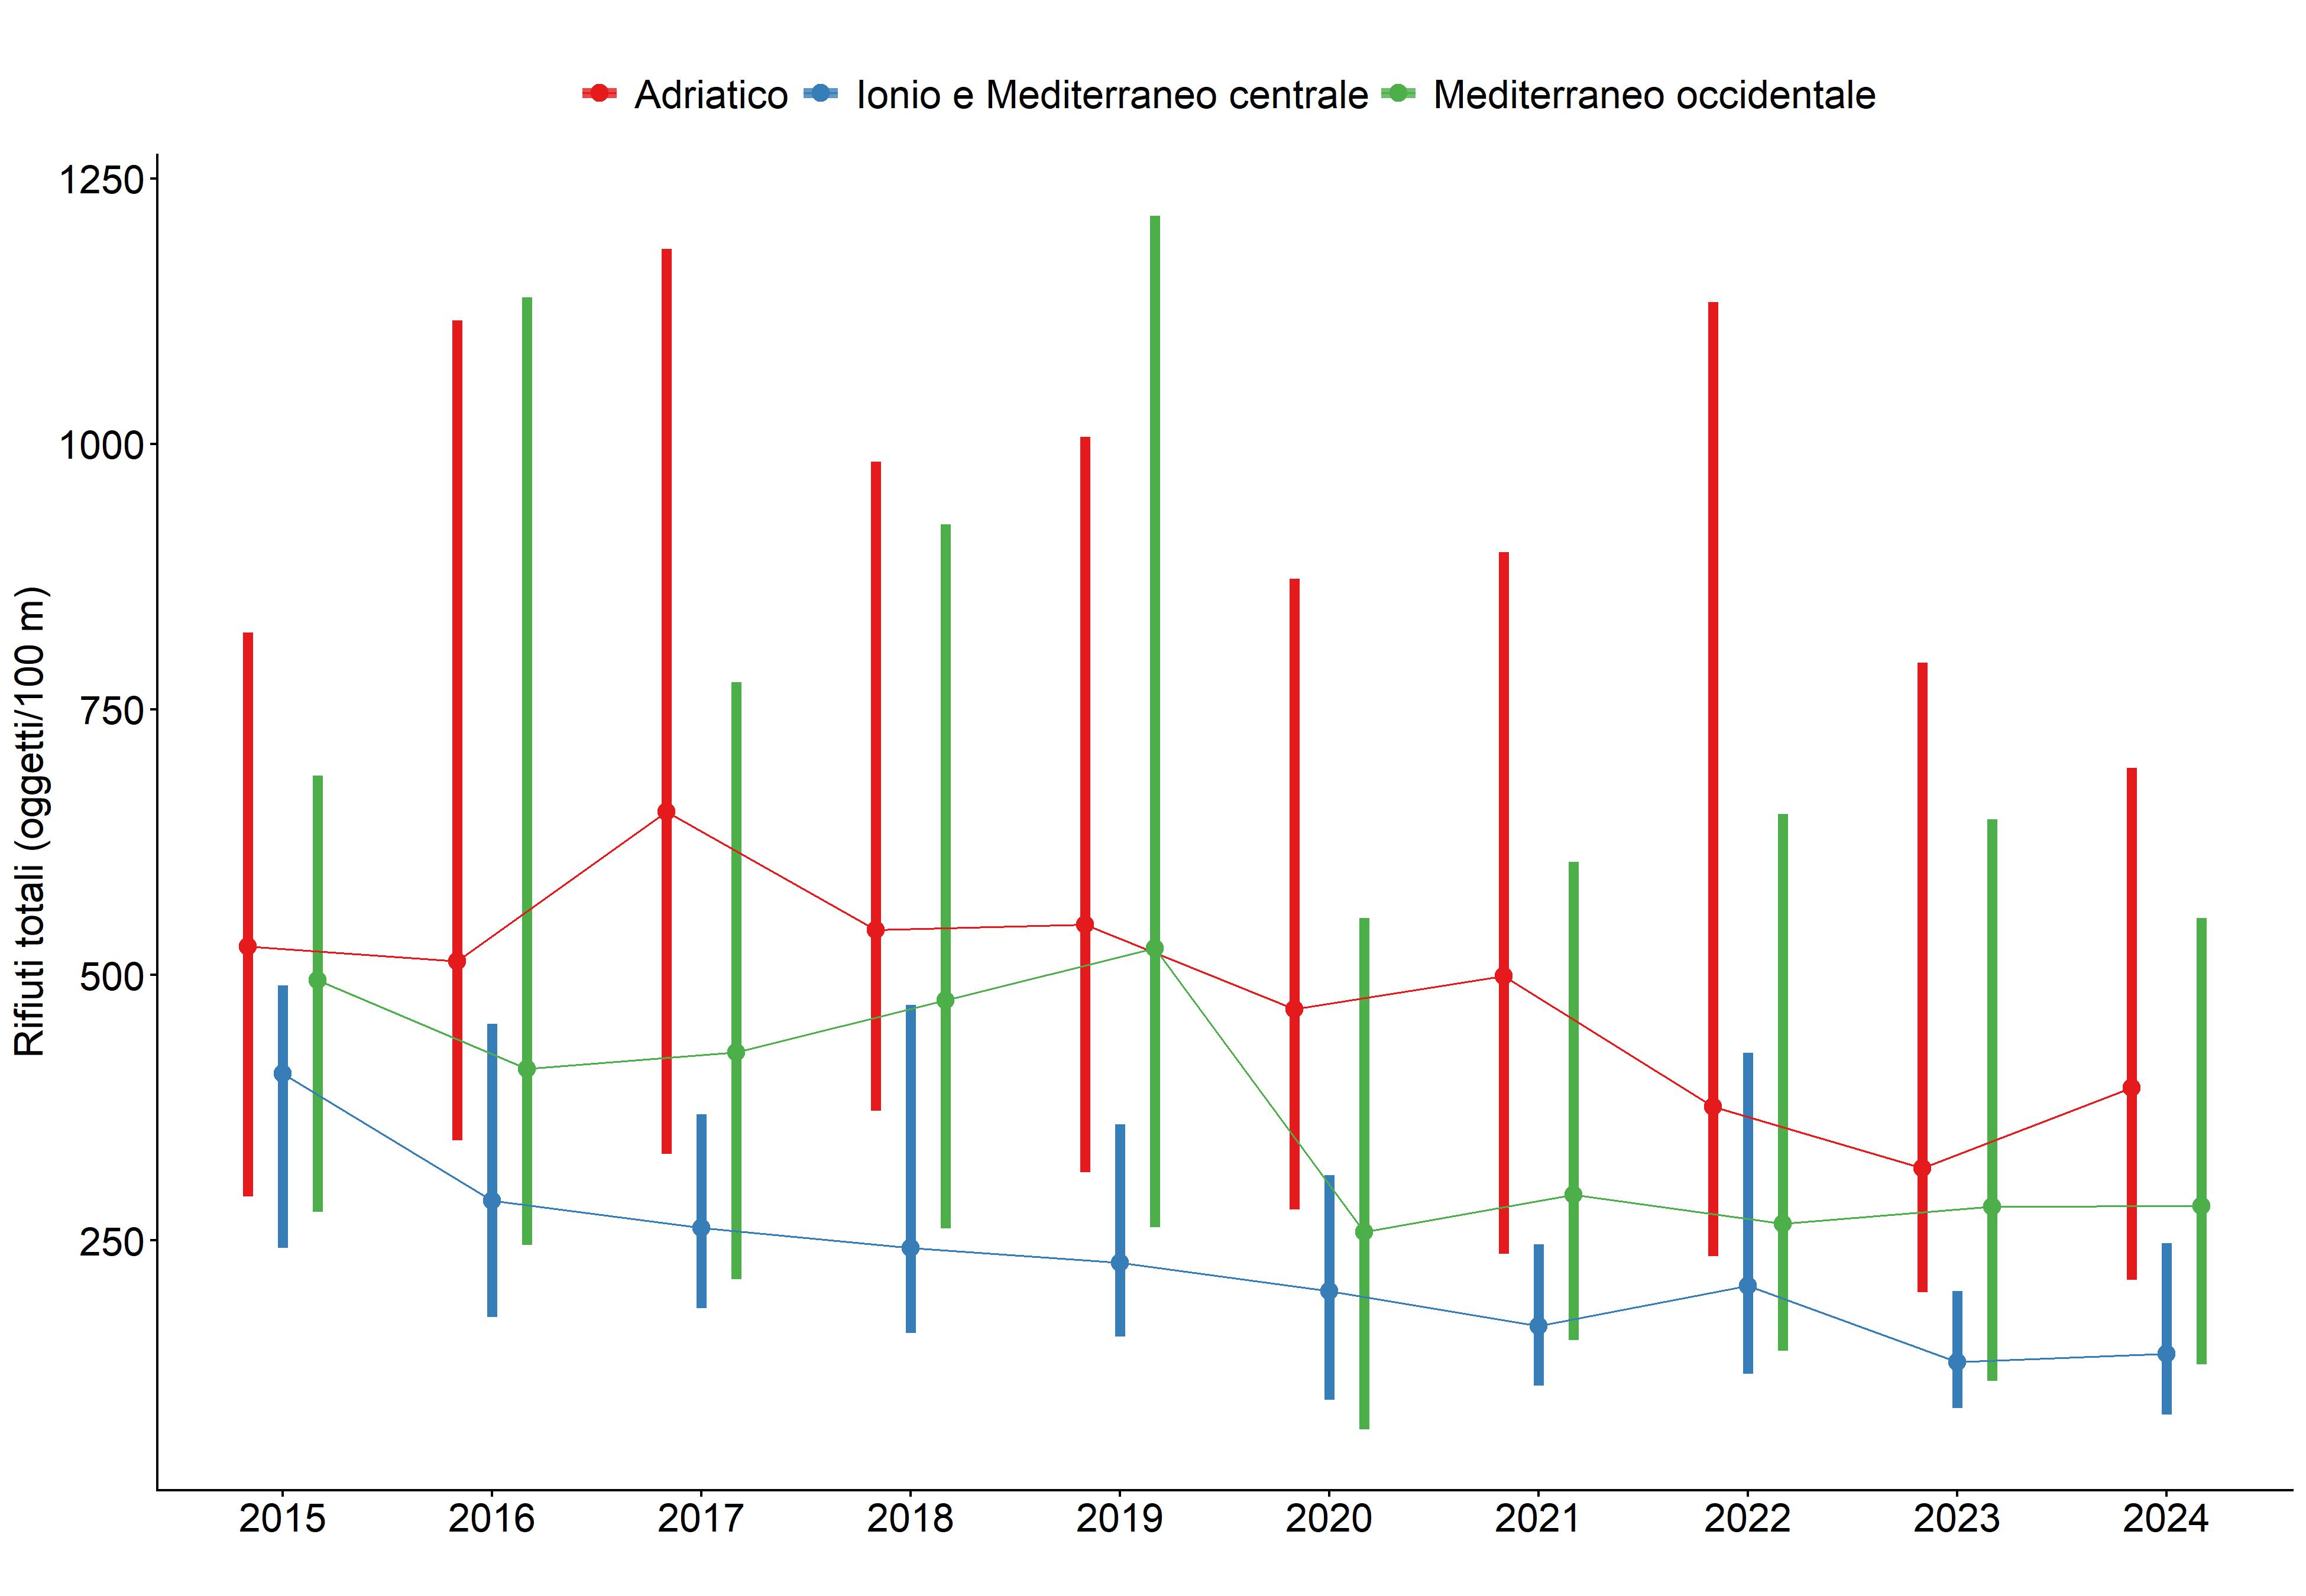
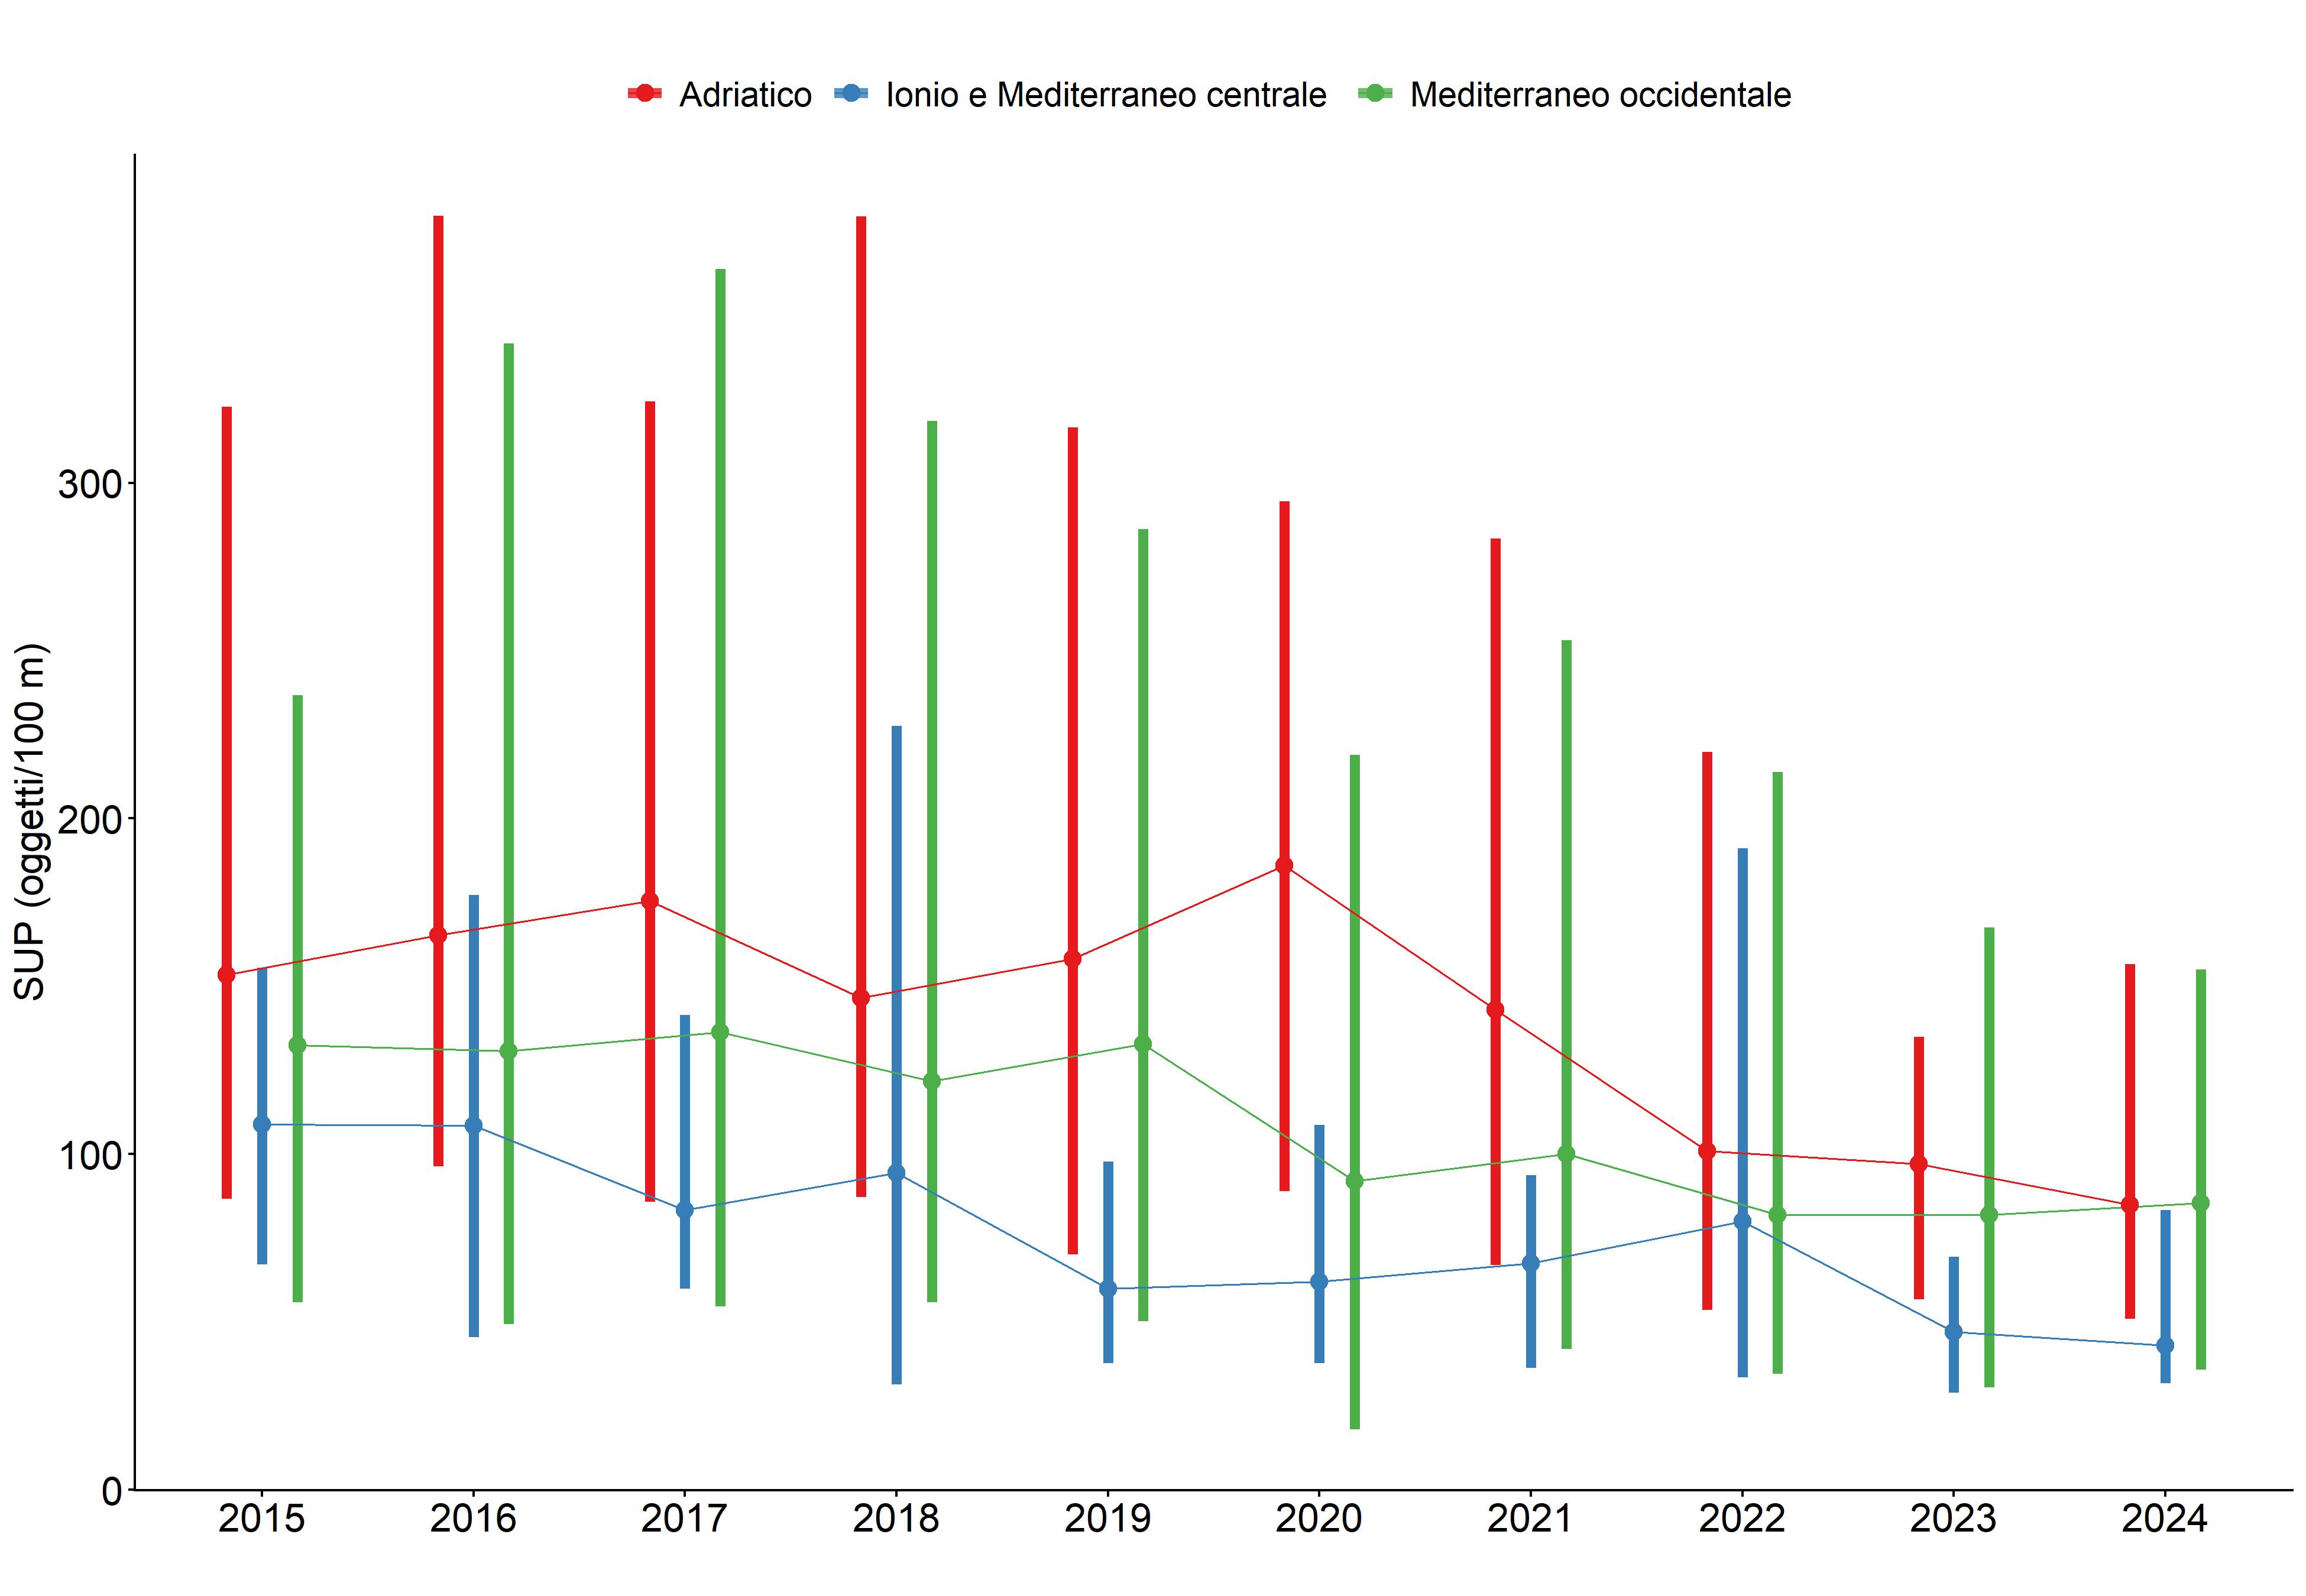
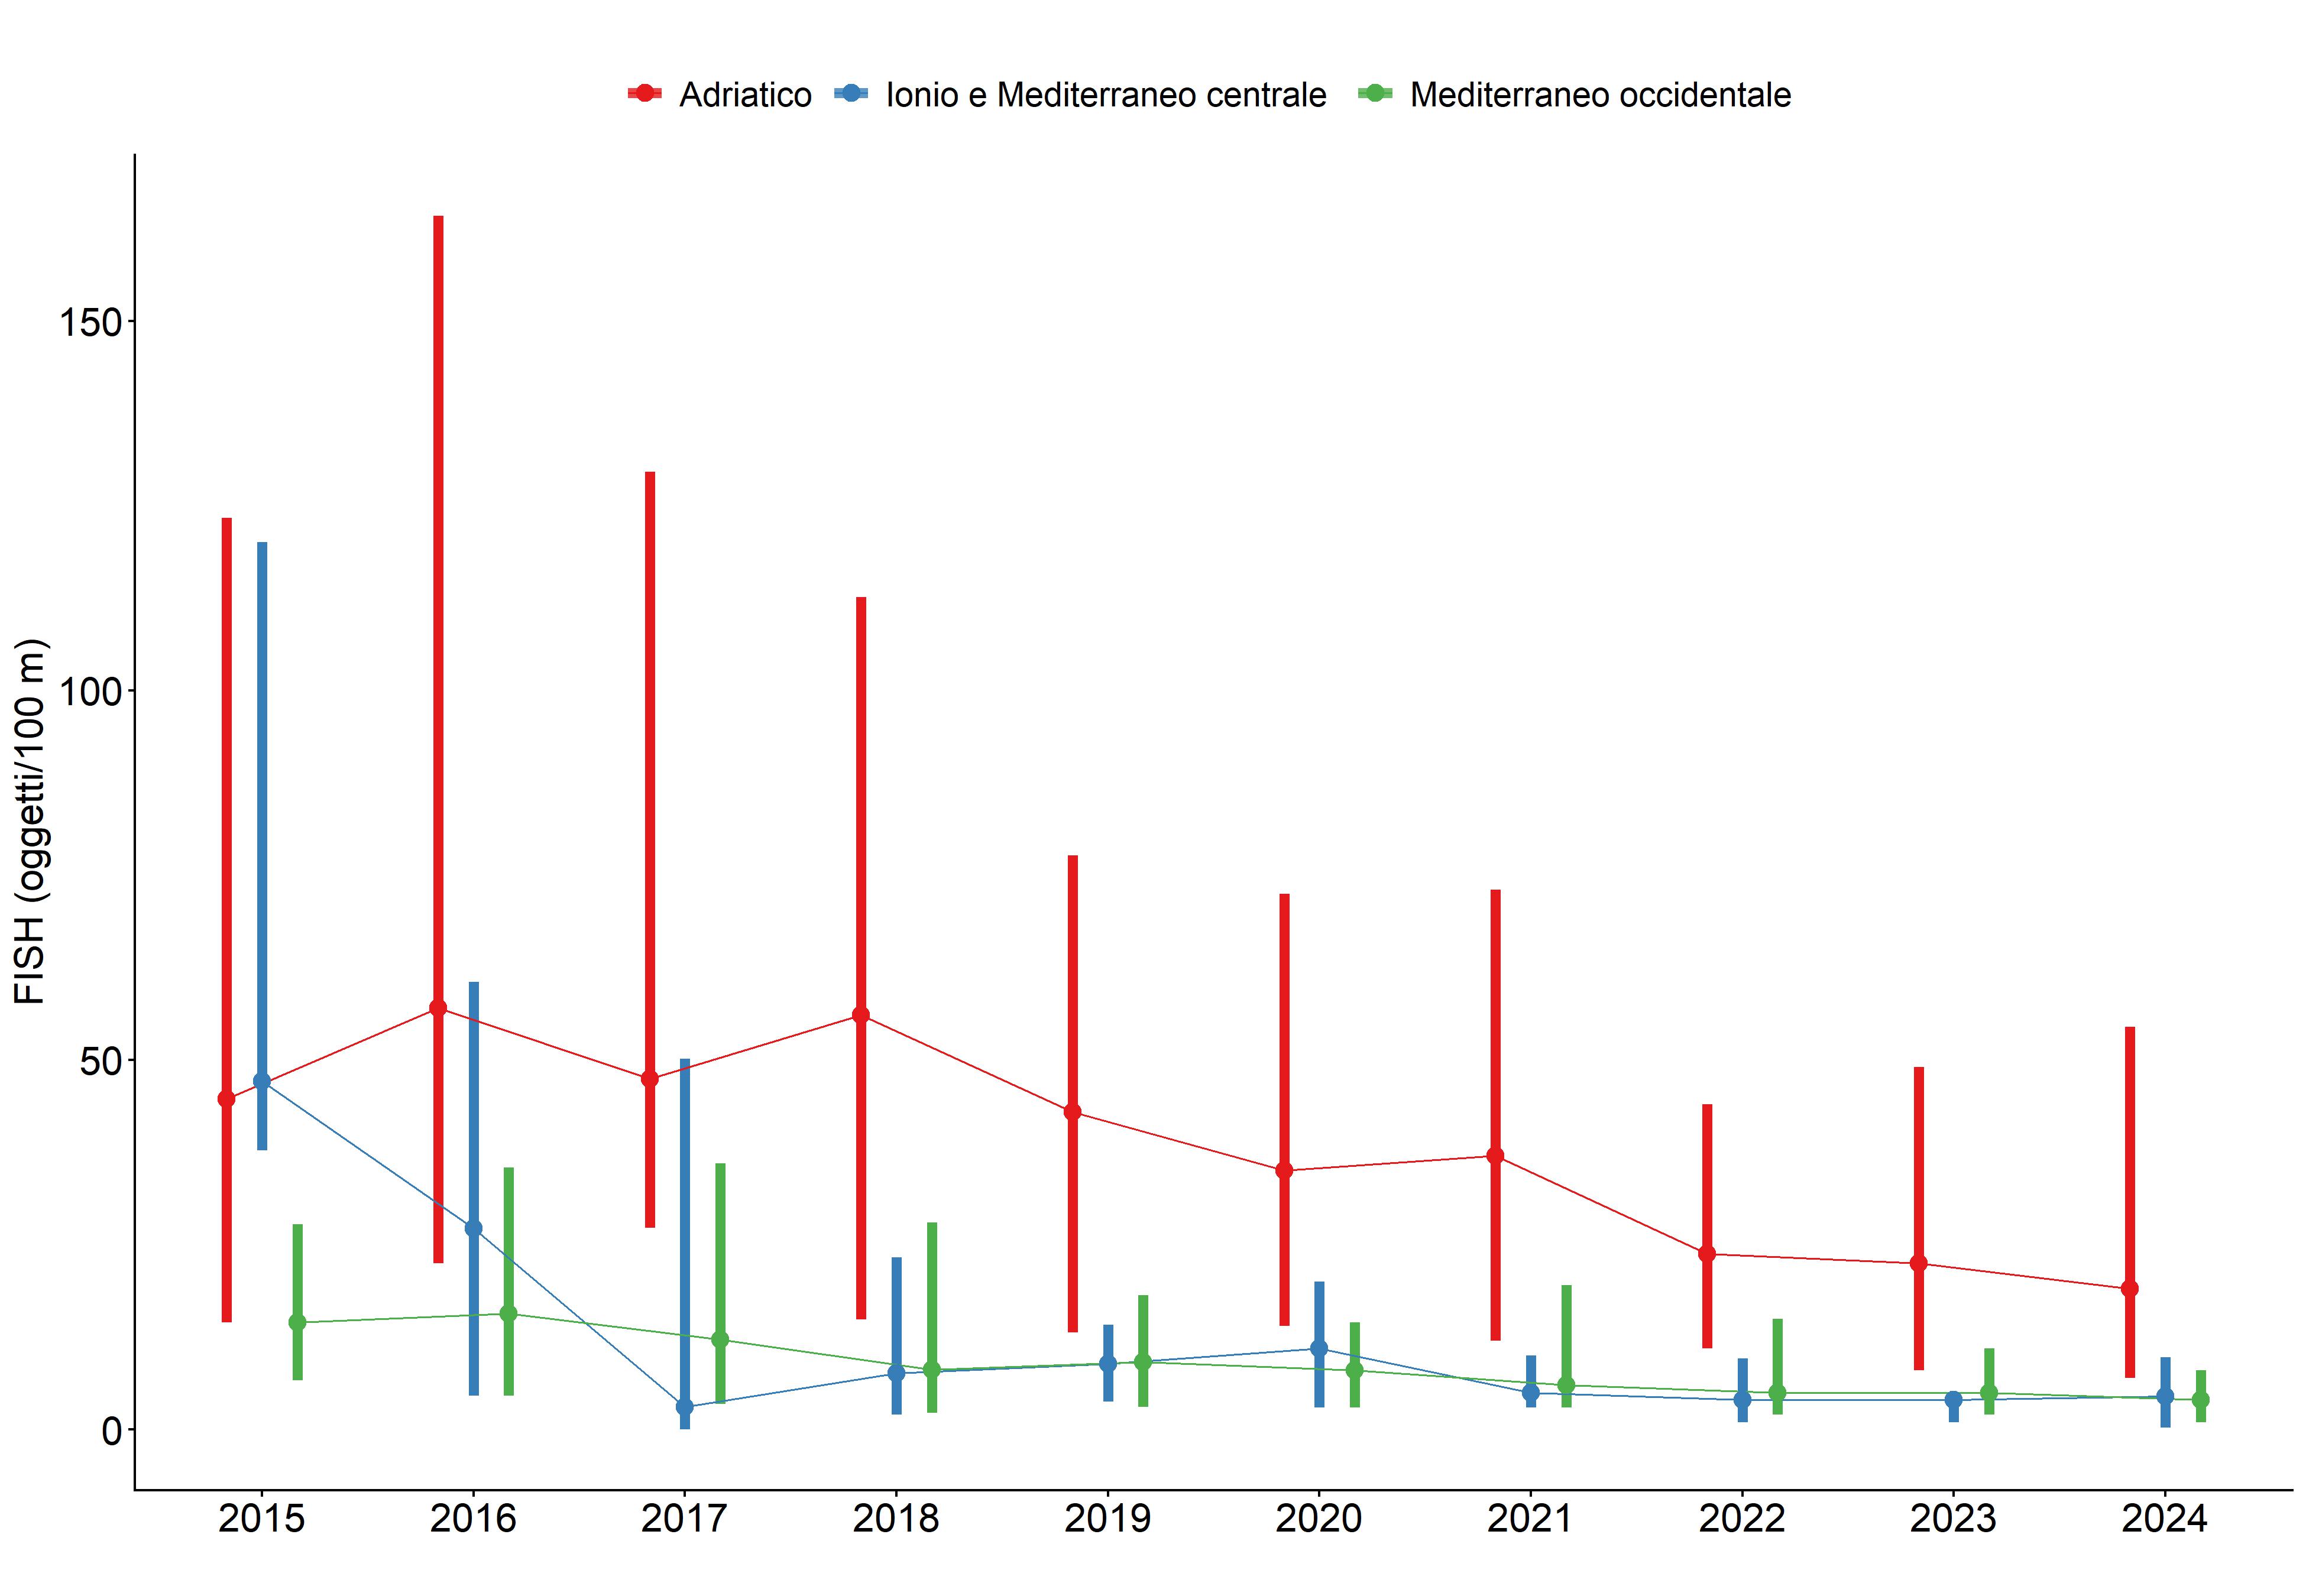
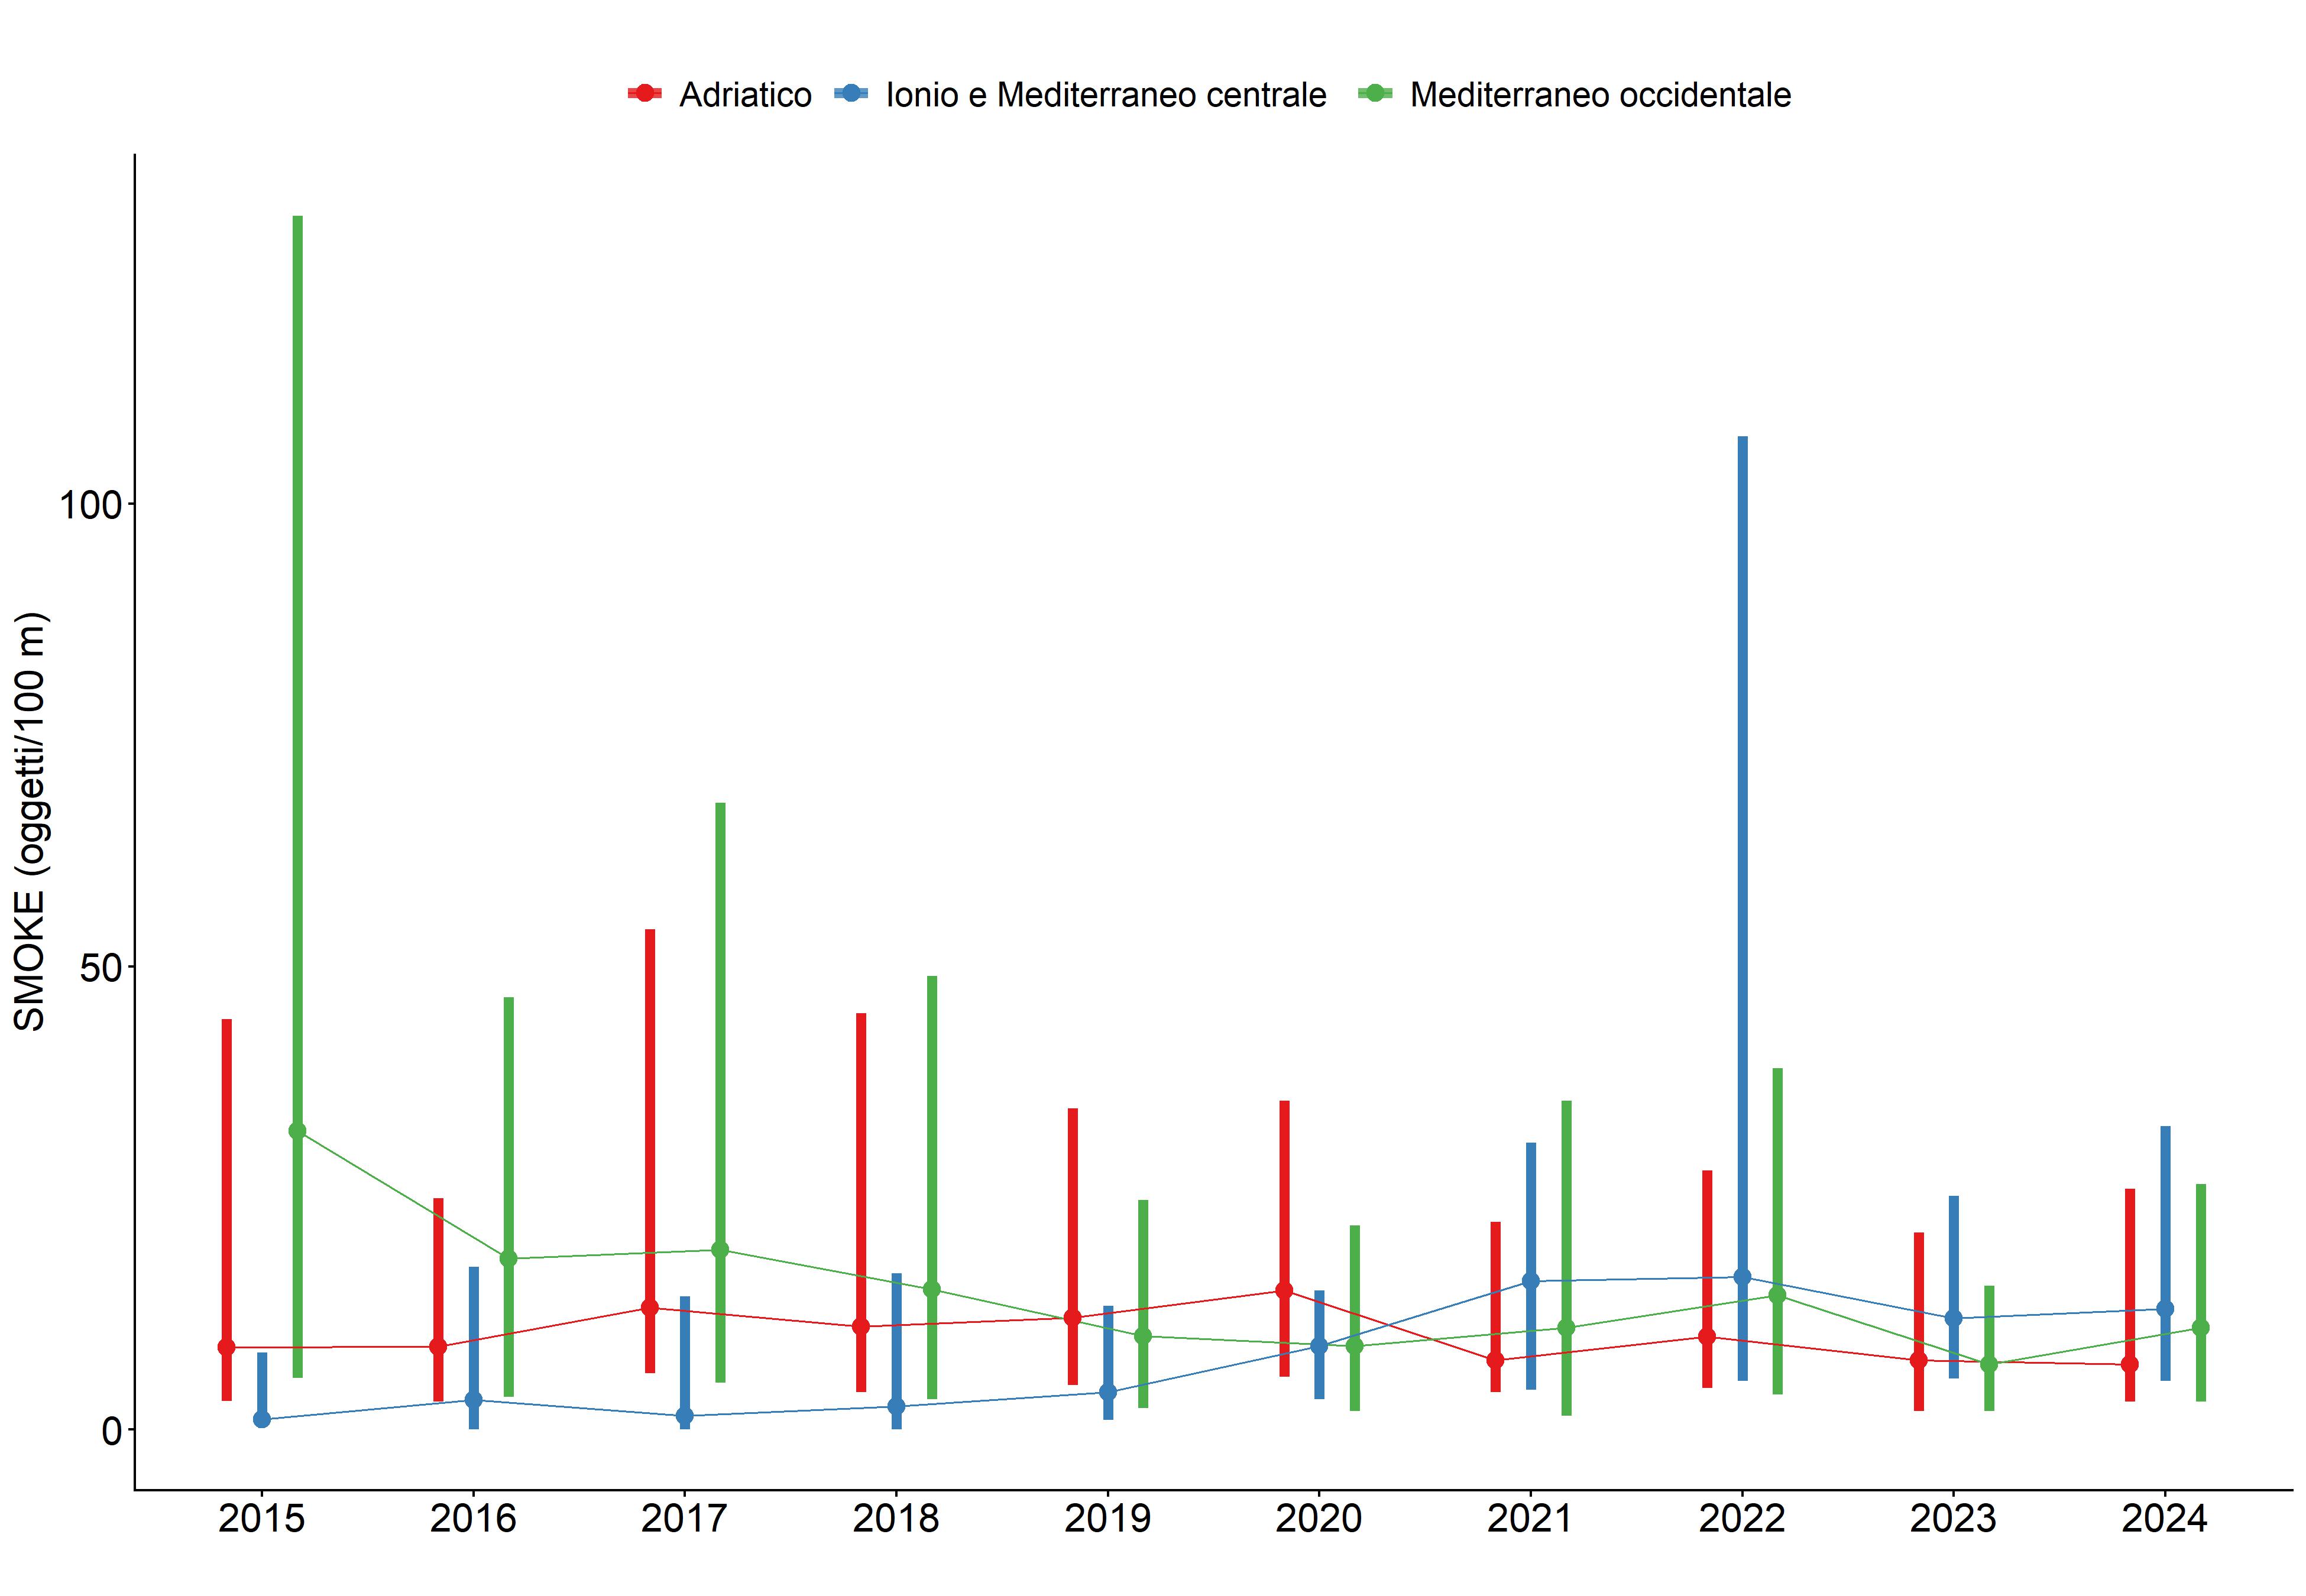
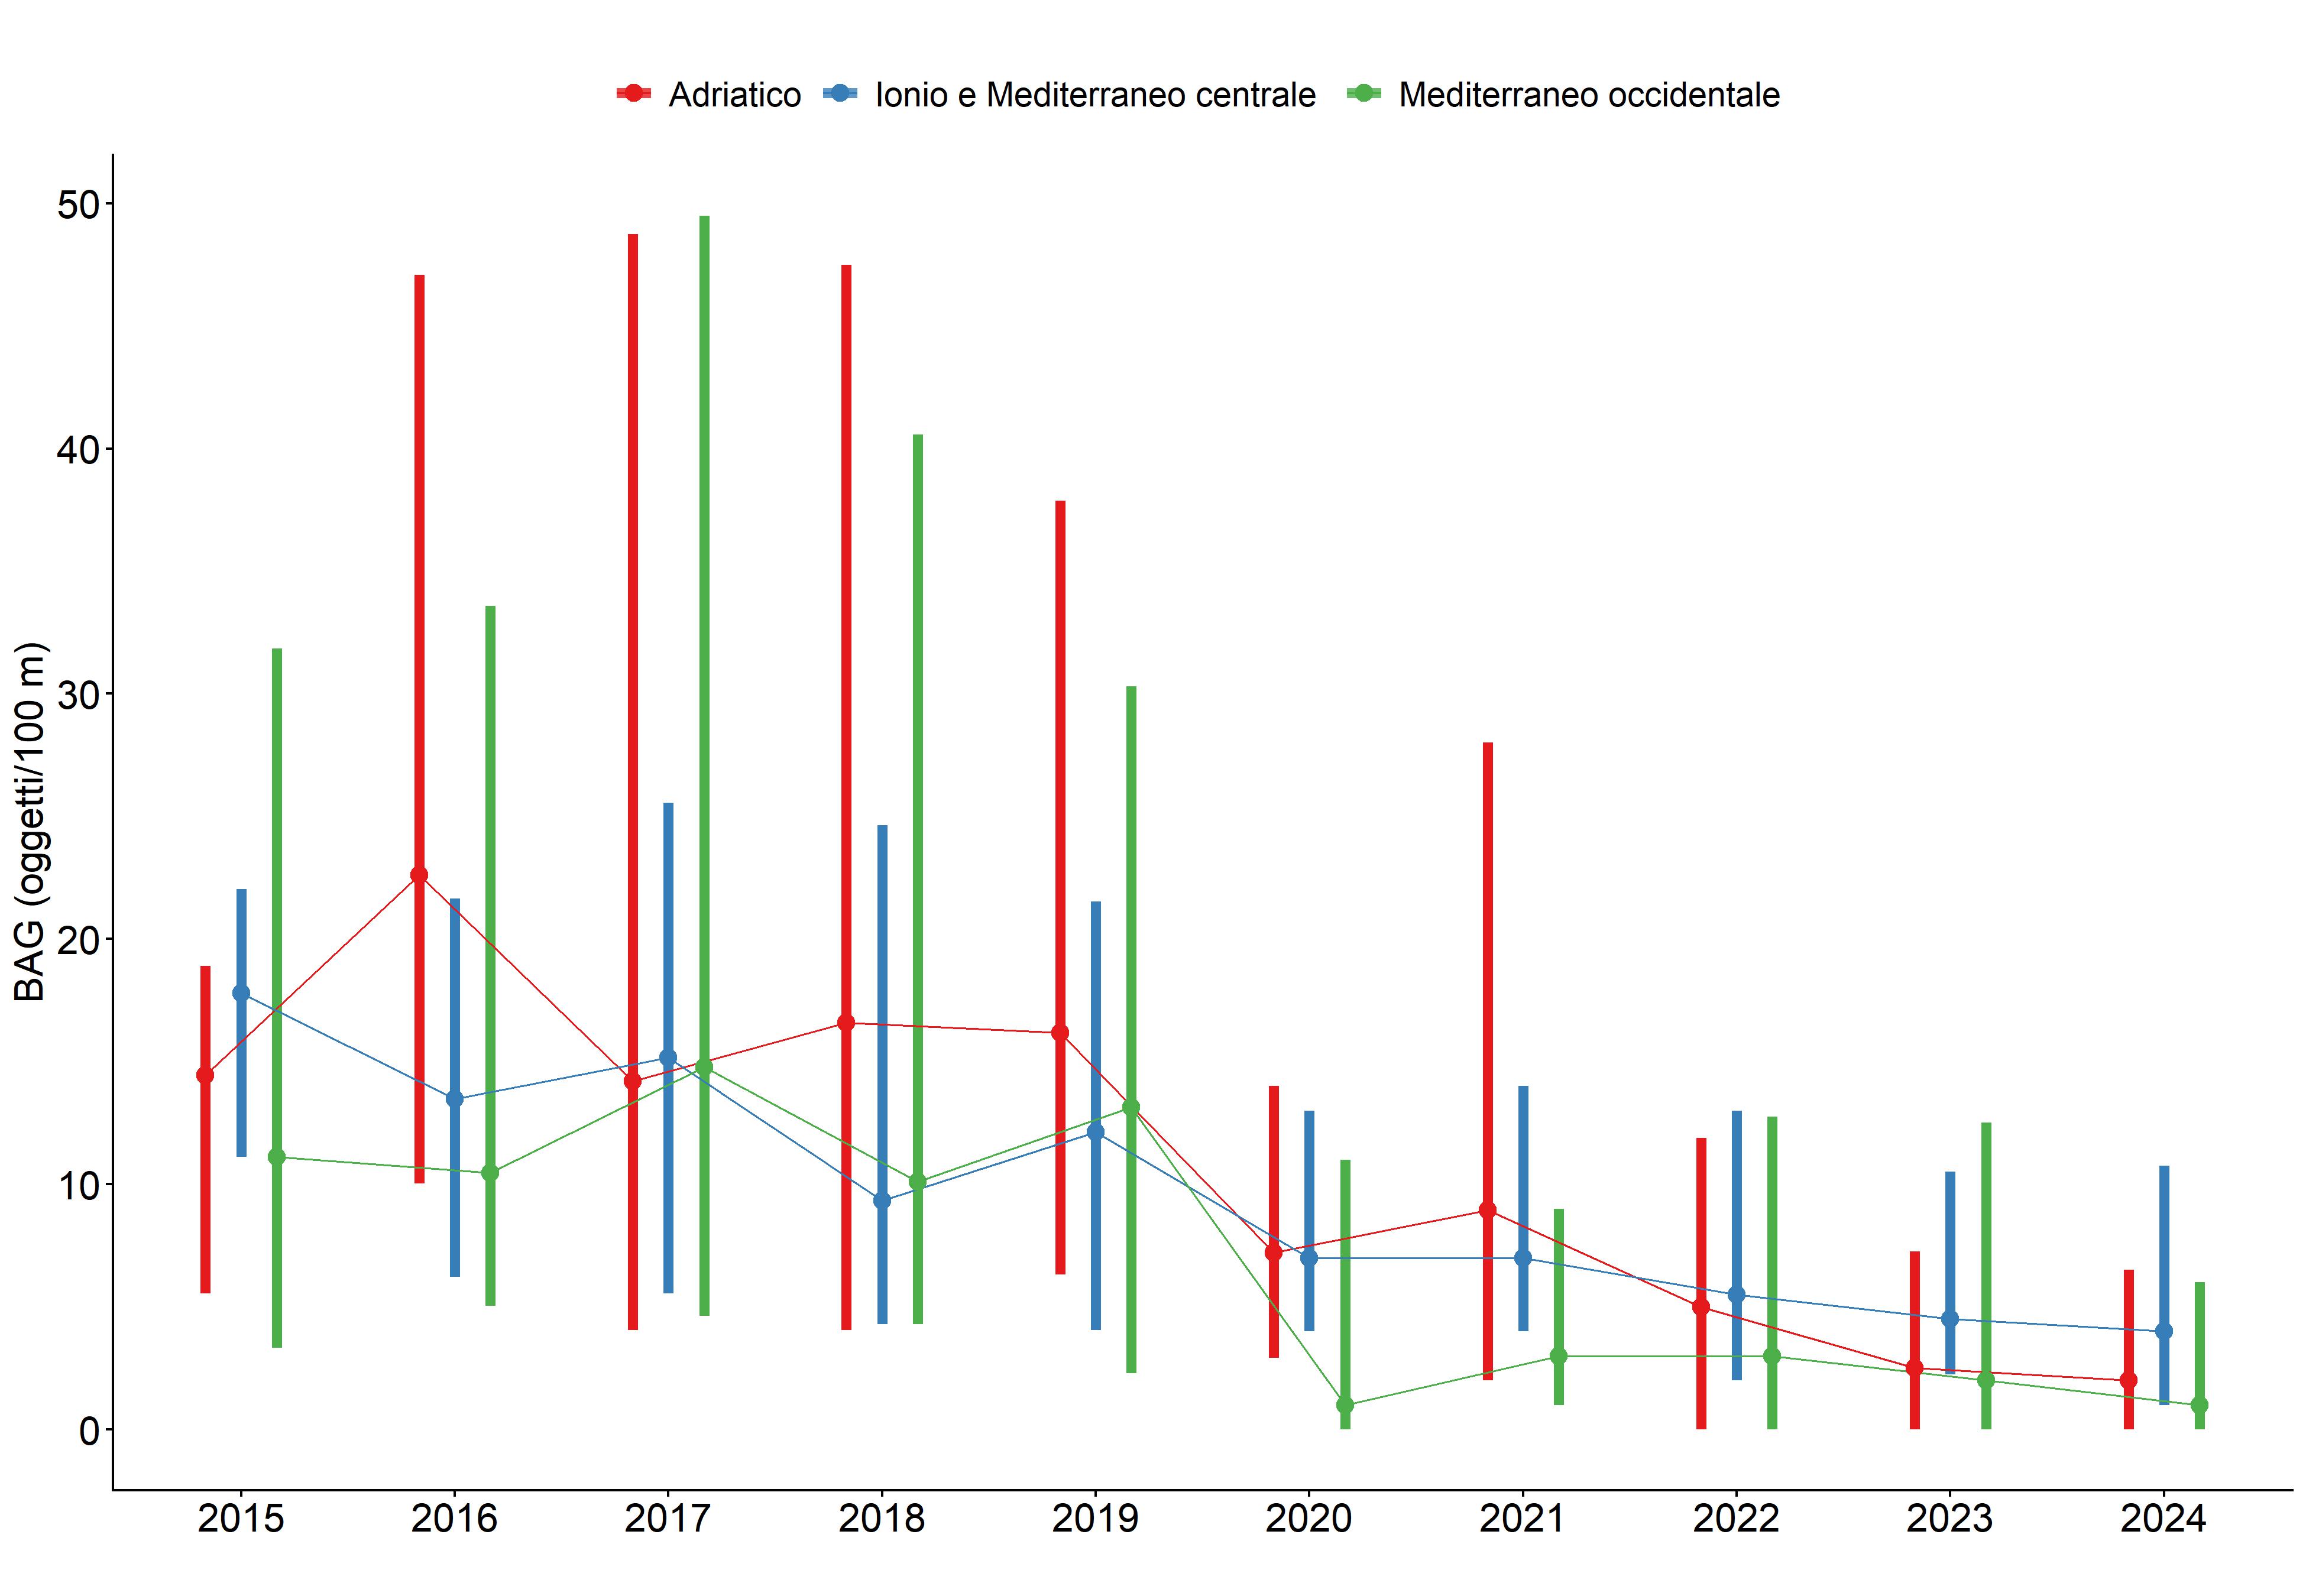
The Adriatic subregion confirms itself as the area with the highest total density of waste (median of 394 objects/100 m), followed by the western Mediterranean (median of 283 objects/100 m) and the Ionian and central Mediterranean (median of 144 objects/100 m). All the values of the medians and quartiles of the distributions per year for the individual macro-categories are shown in Table 1. Compared to 2023, in the Adriatic subregion there was a slight increase in total waste (from 318 to 394 objects/100 m) (Figure 2), but a decrease in single-use plastics (SUP) (from 97 to 85 objects/100 m) (Figure 3); waste related to fishing and aquaculture (FISH) also decreased, from 23 to 19 objects/100 m (Figure 4), while waste related to smoking (SMOKE), mainly cigarette butts, remained almost unchanged (from 8 to 7 objects/100 m; Figure 5) as did plastic bags and bags (BAG) (from 3 to 2 objects/100 m) (Figure 6). Even in the Ionian and Central Mediterranean sub-region, total waste increased slightly, going from 136 to 144 objects/100 m. Single-use plastics (SUP) decreased slightly, from 47 to 43 objects/100 m, while the other waste categories remained almost unchanged. In the Western Mediterranean sub-region, total waste remained almost unchanged (from 282 to 283 objects/100 m), as did the other categories.
At a national level, all waste macro-categories present a statistically significant decreasing trend, apart from the SMOKE macro-category, whose trend is still decreasing, but the p-value is > 0.05. The same applies to the Adriatic subregion. In the Western Mediterranean sub-region, however, the trends are all significantly decreasing, apart from total waste which has a p-value > 0.05. Finally, in the Ionian and Central Mediterranean subregion, the trends are all significantly negative, with the sole exception of the FISH macrocategory, whose p-value is > 0.05.
| Data |
|---|
Thumbnail
Headline
Figure 1: Median values of the linear densities (objects/100 m) of the total waste present along the Italian coasts based on the monitoring carried out as part of the Marine Strategy Data source
ISPRA processing on ARPA data |
Thumbnail
Headline
Figure 2: Linear density (objects/100 m) of total waste stranded in the three sub-regions into which the Italian seas are divided Data source
ISPRA processing on ARPA data Note
The lines join the median value for each year and subregion, the bars represent the interquartile range |
Thumbnail
Headline
Figure 3: Linear density (objects/100 m) of single-use plastics (SUP) in the three sub-regions into which the Italian seas are divided Data source
ISPRA processing on ARPA data Note
The lines join the median value for each year and subregion, the bars represent the interquartile range |
Thumbnail
Headline
Figure 4: Linear density (objects/100 m) of waste related to fishing and aquaculture (FISH) in the three sub-regions into which the Italian seas are divided Data source
ISPRA processing on ARPA data Note
The lines join the median value for each year and subregion, the bars represent the interquartile range |
Thumbnail
Headline
Figure 5: Linear density (objects/100 m) of smoking-related waste (SMOKE) in the three sub-regions into which the Italian seas are divided Data source
ISPRA processing on ARPA data Note
The lines join the median value for each year and subregion, the bars represent the interquartile range |
Thumbnail
Headline
Figure 6: Linear density (objects/100 m) of bags and plastic bags (BAG) in the three sub-regions into which the Italian seas are divided Data source
ISPRA processing on ARPA data Note
The lines join the median value for each year and subregion, the bars represent the interquartile range |
Headline
Table 1: Median density and interquartile range by waste type and subregion Data source
ISPRA processing on ARPA data |
In 2024, at a national level, there were no major changes in the densities of the different types of waste compared to the previous year. Single-use plastic (SUP) (Figure 3) represents the most abundant macro-category, equal to 28% of total waste. The Adriatic is affected by high densities of waste related to fishing and aquaculture (FISH), which have a median density of 19 objects/100 m, compared to 4 objects/100 m in the western Mediterranean and 5 objects/100 m in the Ionian and central Mediterranean (Figure 4). Smoking-related waste (SMOKE) in 2024 did not change substantially compared to the previous year (Figure 5). As regards plastic bags and bags (BAG), no substantial differences were observed compared to 2023 and they now represent a rather rare waste along the Italian coasts (Figure 6).