POLLEN SEASON
Data aggiornamento scheda:
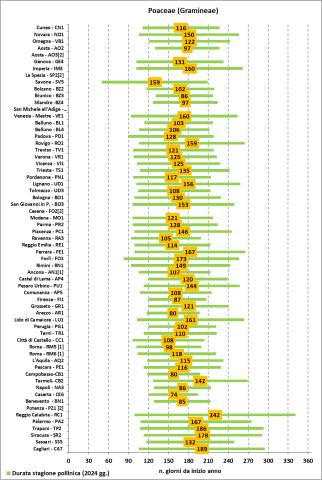
The indicator describes the times of pollination of a specific botanical family during the year. The start and end dates and duration of a family's pollen season change based on location, because pollination is extremely sensitive to weather and climate differences. It should be noted that the duration of the pollen season is not related to the greater or lesser quantity of airborne pollen. The comparative examination of the data of the beginning and end of pollination of the monitored families can highlight the presence of airborne pollen, for some locations, even in the months of January and December.
EXPOSURE OF THE POPULATION TO OUTDOOR AIR POLLUTANTS - OZONE
Data aggiornamento scheda:
Estimates of the average annual exposure weighted for the population were developed ( Population Weighted Exposure , PWE) to ozone (O 3) aggregated at municipal level, through the integrated use of statistical measures and models. The data obtained, relating to the period 2016-2024, allow the comparison of PWE between all municipalities and to have a complete picture of the average exposure at a national level.
In 2024, 100% of the population was exposed to levels above the WHO guideline value (60 µg/m 3 as the average of the distribution of the daily maximums of the 8-hour moving averages in the period from April to September).
The national average of PWE was 96 µg/m 3 ( range minimum-maximum: 50 – 119 µg/m 3).
In the period observed, there was no trend towards a reduction in exposure levels.
ALLERGENIC AND ANNUAL POLLEN INTEGRAL
Data aggiornamento scheda:
The Allergenic and Annual Pollen Integral indicator considers two integrals: the Annual Pollen Integral (IPAn) and the Allergenic Pollen Integral (IPA) which describe the quantity of pollen present in a year in the atmosphere of the locations where the monitoring stations are positioned. The Annual Whole Pollen and the Allergenic Whole Pollen are locally subject to very significant variations from one year to the next caused by the different trends of seasonal weather and climate characteristics. These are cumulative quantitative indicators which therefore do not give indications on the distribution methods of airborne pollen during the year.
EXPOSURE OF THE POPULATION TO OUTDOOR AIR POLLUTANTS - NO 2
Data aggiornamento scheda:
Estimates of the average annual exposure weighted for the population were developed ( Population Weighted Exposure , PWE) to nitrogen dioxide (NO 2) aggregated at municipal level, through the integrated use of statistical measures and models. The data obtained, relating to the period 2016-2024, allow the comparison of PWE between all municipalities and to have a complete picture of the average exposure at a national level.
In 2024, 77% of the population was exposed to levels above the WHO guideline value (10 µg/m 3).
The national average of PWE was 11 µg/m³ ( range minimum-maximum: 3 – 36 µg/m 3).
In the period 2016-2024, a trend towards a reduction in exposure levels equal to 29% on average is observed, mainly linked to the reduction of emissions from vehicular traffic.
POPULATION EXPOSURE TO OUTDOOR AIR POLLUTANTS - PM10
Data aggiornamento scheda:
Estimates of the average annual exposure weighted for the population were developed ( Population Weighted Exposure , PWE) to PM10 aggregated at municipal level, through the integrated use of statistical measures and models. The data obtained, relating to the period 2016-2024, allow the comparison of PWE between all municipalities and to have a complete picture of the average exposure at a national level.
In 2024, 95% of the population was exposed to levels above the WHO guideline value (15 µg/m 3).
In the period observed there is no trend towards reduction in exposure levels with the national average which in 2024 is equal to 20 µg/m 3 ( range minimum-maximum: 6 – 35 µg/m 3).
POPULATION EXPOSURE TO OUTDOOR AIR POLLUTANTS - PM2.5
Data aggiornamento scheda:
Estimates of the average annual exposure weighted for the population were developed ( Population Weighted Exposure , PWE) to the PM 2.5 aggregated at municipal level, through the integrated use of statistical measures and models. The data obtained, relating to the period 2016-2024, allow the comparison of PWE between all municipalities and to have a complete picture of the average exposure at a national level.
In 2024, 100% of the population was exposed to levels above the WHO guideline value (5 µg/m 3). The national average of PWE was 12 µg/m 3 (minimum-maximum range: 4 – 24 µg/m 3).
In the period 2016-2024, the national average goes from 15 µg/m 3 of 2016 at 12 µg/m 3 of 2024, recording a reduction of 20%.
HEATWAVES AND MORTALITY
Data aggiornamento scheda:
This indicator measures the health impact of heatwaves on the elderly population (aged 65 and over) across 27 Italian cities included in the National Heatwave Health Prevention and Warning Plan. The plan is implemented by the National Centre for Disease Prevention and Control (CCM) of the Ministry of Health and coordinated by the Epidemiology Department of the Lazio Regional Health Service (DEP Lazio). The cities are equipped with Heat Health Watch Warning (HHWW) systems to provide forecasts and alerts.
The summer of 2023 (15 May – 15 September) was characterized by temperatures above the seasonal reference average. Despite these elevated temperatures, observed mortality in the elderly population remained generally within expected levels. Monthly impact assessments highlighted increases in mortality rates associated with heatwave episodes during July and August in several monitored urban areas.
This indicator provides critical information for monitoring climate-related health risks and supports adaptation strategies aimed at reducing adverse health effects of heatwaves on vulnerable population groups.