Simona BUSCEMI, Giorgio CATTANI, Alessandra GAETA, Federica NOBILE (Department of Epidemiology of the Regional Health Service-Lazio Region ASL Rome 1), Maria Antonietta REATINI, Massimo STAFOGGIA (Department of Epidemiology of the Regional Health Service-Lazio Region ASL Rome 1)
Estimates of the average annual exposure weighted for the population were developed ( Population Weighted Exposure , PWE) to PM10 aggregated at municipal level, through the integrated use of statistical measures and models. The data obtained, relating to the period 2016-2024, allow the comparison of PWE between all municipalities and to have a complete picture of the average exposure at a national level.
In 2024, 95% of the population was exposed to levels above the WHO guideline value (15 µg/m 3).
In the period observed there is no trend towards reduction in exposure levels with the national average which in 2024 is equal to 20 µg/m 3 ( range minimum-maximum: 6 – 35 µg/m 3).
The most accredited health estimates attribute a significant portion of premature deaths and reductions in life expectancy linked to exposure to air pollutants (WHO, 2016; EEA, 2022, WHO, 2021).
The assessment of population exposure and the related spatial and temporal variability outdoors represents a fundamental step for epidemiological studies that relate exposure to air pollution and health effects (Caplin et al., 2019).
The indicator provides an estimate of the average annual exposure weighted for the population ( Population Weighted Exposure , PWE) to PM10 aggregated at municipal level allowing the comparison of the situation between different cities and to have a complete picture of the average exposure at a national level. It is representative of the chronic exposure of the population and useful for estimates of long-term health effects.
The exposure values are compared with the reference values (guidelines e interim target ) indicated by the World Health Organization (WHO, 2021).
Estimate the average exposure of the population to the main airborne pollutants, evaluate the exposure levels for comparison with the WHO reference values and evaluate the trend of exposure over time.
Legislative Decree n. 155 of 13 August 2010 and subsequent amendments. In implementation of Directive 2008/50/EC and Directive 2004/107/EC.
WHO (2021), Global Air Quality Guidelines. Particulate matters (PM10, PM2.5), ozone, nitrogen dioxide, sulfur dioxide and carbon monoxide. Geneva, World Health Organization , 2021.
A “Clean Air” program for Europe. Brussels, 18.12.2013 COM (2013) 918 final.
A Europe that protects: clean air for all. Brussels, 17.5.2018 COM(2018) 330 final.
A path to a healthier planet for all EU Action Plan: “Towards zero pollution for air, water and soil”. Brussels, 12.5.2021 COM(2021) 400 final.
In revising the Guidelines, WHO produced numerical risk estimates for a series of health effects associated with a 10 µg/m³ increase in the average annual concentration of various pollutants. In its assessments, the WHO does not establish a value below which there is no risk, but identifies the value of 15 µg/m³ for PM as the lower limit of average annual exposure 10, called “ Air quality guideline level " which can be translated as "reference level": it is the lowest level for which an increase in total mortality, mortality from cardiopulmonary causes, and mortality from lung cancer has been observed, with a confidence level of 95%. The WHO has also defined " interim target ", i. e. Higher reference levels to be considered as objectives to be achieved in subsequent steps, through the implementation of air quality improvement policies. interim target for the PM 10 proposed by the WHO are equal to 20 µg/m³ (IT 4), 30 µg/m³ (IT 3), 50 µg/m³ (IT 2) and 70 µg/m³ (IT 1).
The EU's clean air programs have set the medium to long-term target to comply with WHO air quality guidelines, which are much stricter than the standards set by the EU air quality directives and are based on what is deemed necessary to ensure the protection of human health.
The Clean Air Policy Package and the Zero Pollution Action Plan aim to reduce the number of premature deaths, at European level, linked to air pollution by more than half by 2030 compared to 2005.
Caplin A., Ghandehari M., Lim C., Glimcher P., Thurston G. Advancing environmental exposure assessment science to benefit society. Nature communication (2019) 10:1236. https://doi. org/10.1038/s41467-019-09155-4.
EEA (2022), Health Risk Assessment of Air Pollution and the Impact of the New WHO Guidelines . Eionet Report – ETC/ATNI 2022/10
EUROSTAT, Sustainable development in the European Union — Monitoring report on progress towards the SDGs in an EU context — 2022 edition. (DOI): 10.2785/313289.
Stafoggia M, Bellander T, Bucci S et al. (2019) Estimation of daily PM 10 and PM2.5 concentrations in Italy, 2013-2015, using a spatiotemporal land-use random-forest model. Environ Int 2019;124:170-79.
Stafoggia M, Cattani G, Ancona C, Ranzi A. The assessment of the exposure of the Italian population to air pollution in the period 2016-2019 for the study of the relationship between air pollution and COVID-19. Epidemiol Prev. 2020 Sep-Dec; 44(5-6 Suppl 2):161-168. Italian. doi: 10.19191/EP20.5-6. S2.115. PMID: 33412807.
WHO (2016), Ambient air pollution: A global assessment of exposure and burden of disease . Geneva, World Health Organization, 2016.
WHO (2021), Global Air Quality Guidelines. Particulate matter (PM 10, PM2.5), ozone, nitrogen dioxide, sulfur dioxide and carbon monoxide . Geneva, World Health Organization , 2021.
The population considered is that distributed in the 2021 permanent census sections, which represents the most recent territorial base available.
The indicator expresses an average exposure value of the population at municipal level. Within a single municipality it is known that there is variability in the concentration of pollutants with areas where the levels may be higher than the average or background values. However, the assessment of exposures on a local or microscale within individual municipalities goes beyond the scope of this indicator. However, it should be underlined that, within the municipality, the areas with higher population density are weighted more heavily in the PWE calculation.
In any case, the exposure values obtained should not be compared with the legal limit values: in this case, in fact, for the purpose of assessing compliance with the legal limits, it is necessary to use the highest value among those measured by the individual monitoring stations.
Application of high spatio-temporal resolution models, with the use of spatio-temporal predictors, satellite data, air quality monitoring data.
DEP: Department of Epidemiology of the SSR Lazio Region - ASL RME ISPRA (
ISTAT
SNPA (National System for Environmental Protection)
ISPRA - InfoARIA Database
ISTAT - www. demo. istat. it
National, Regional, Municipal (7,901/7,914)
2016-2024
The model uses the average daily concentrations measured in monitoring stations distributed across the national territory as a response variable and a selection of spatial and temporal predictors as explanatory variables. The monitoring data is collected and archived in ISPRA in databases InfoAria, in accordance with the provisions of Directive 2008/50/EC (and the transposing Legislative Decree no. 155/2010) and Decision 2011/850/EU.
A model has been developed machine learning, the random forest, which relates the daily concentrations of monitoring stations with spatial (population density, road network, land cover, altitude, artificial surfaces, etc.) and spatio-temporal (dispersion models, meteorology) predictors in order to estimate average daily levels of PM10 for each km 2 of the Italian territory.
Starting from the daily concentrations estimated by the model random forest , the average annual exposure of the Italian population was calculated by weighting the concentrations of each pollutant at the single cell level for the population residing within the cell itself.
The "national average concentration value" is calculated as the weighted average of the concentrations estimated for each municipality, considered with weights proportional to the resident population.
Finally, the percentage distribution of the resident population exposed to different PM10 concentration bands is estimated.
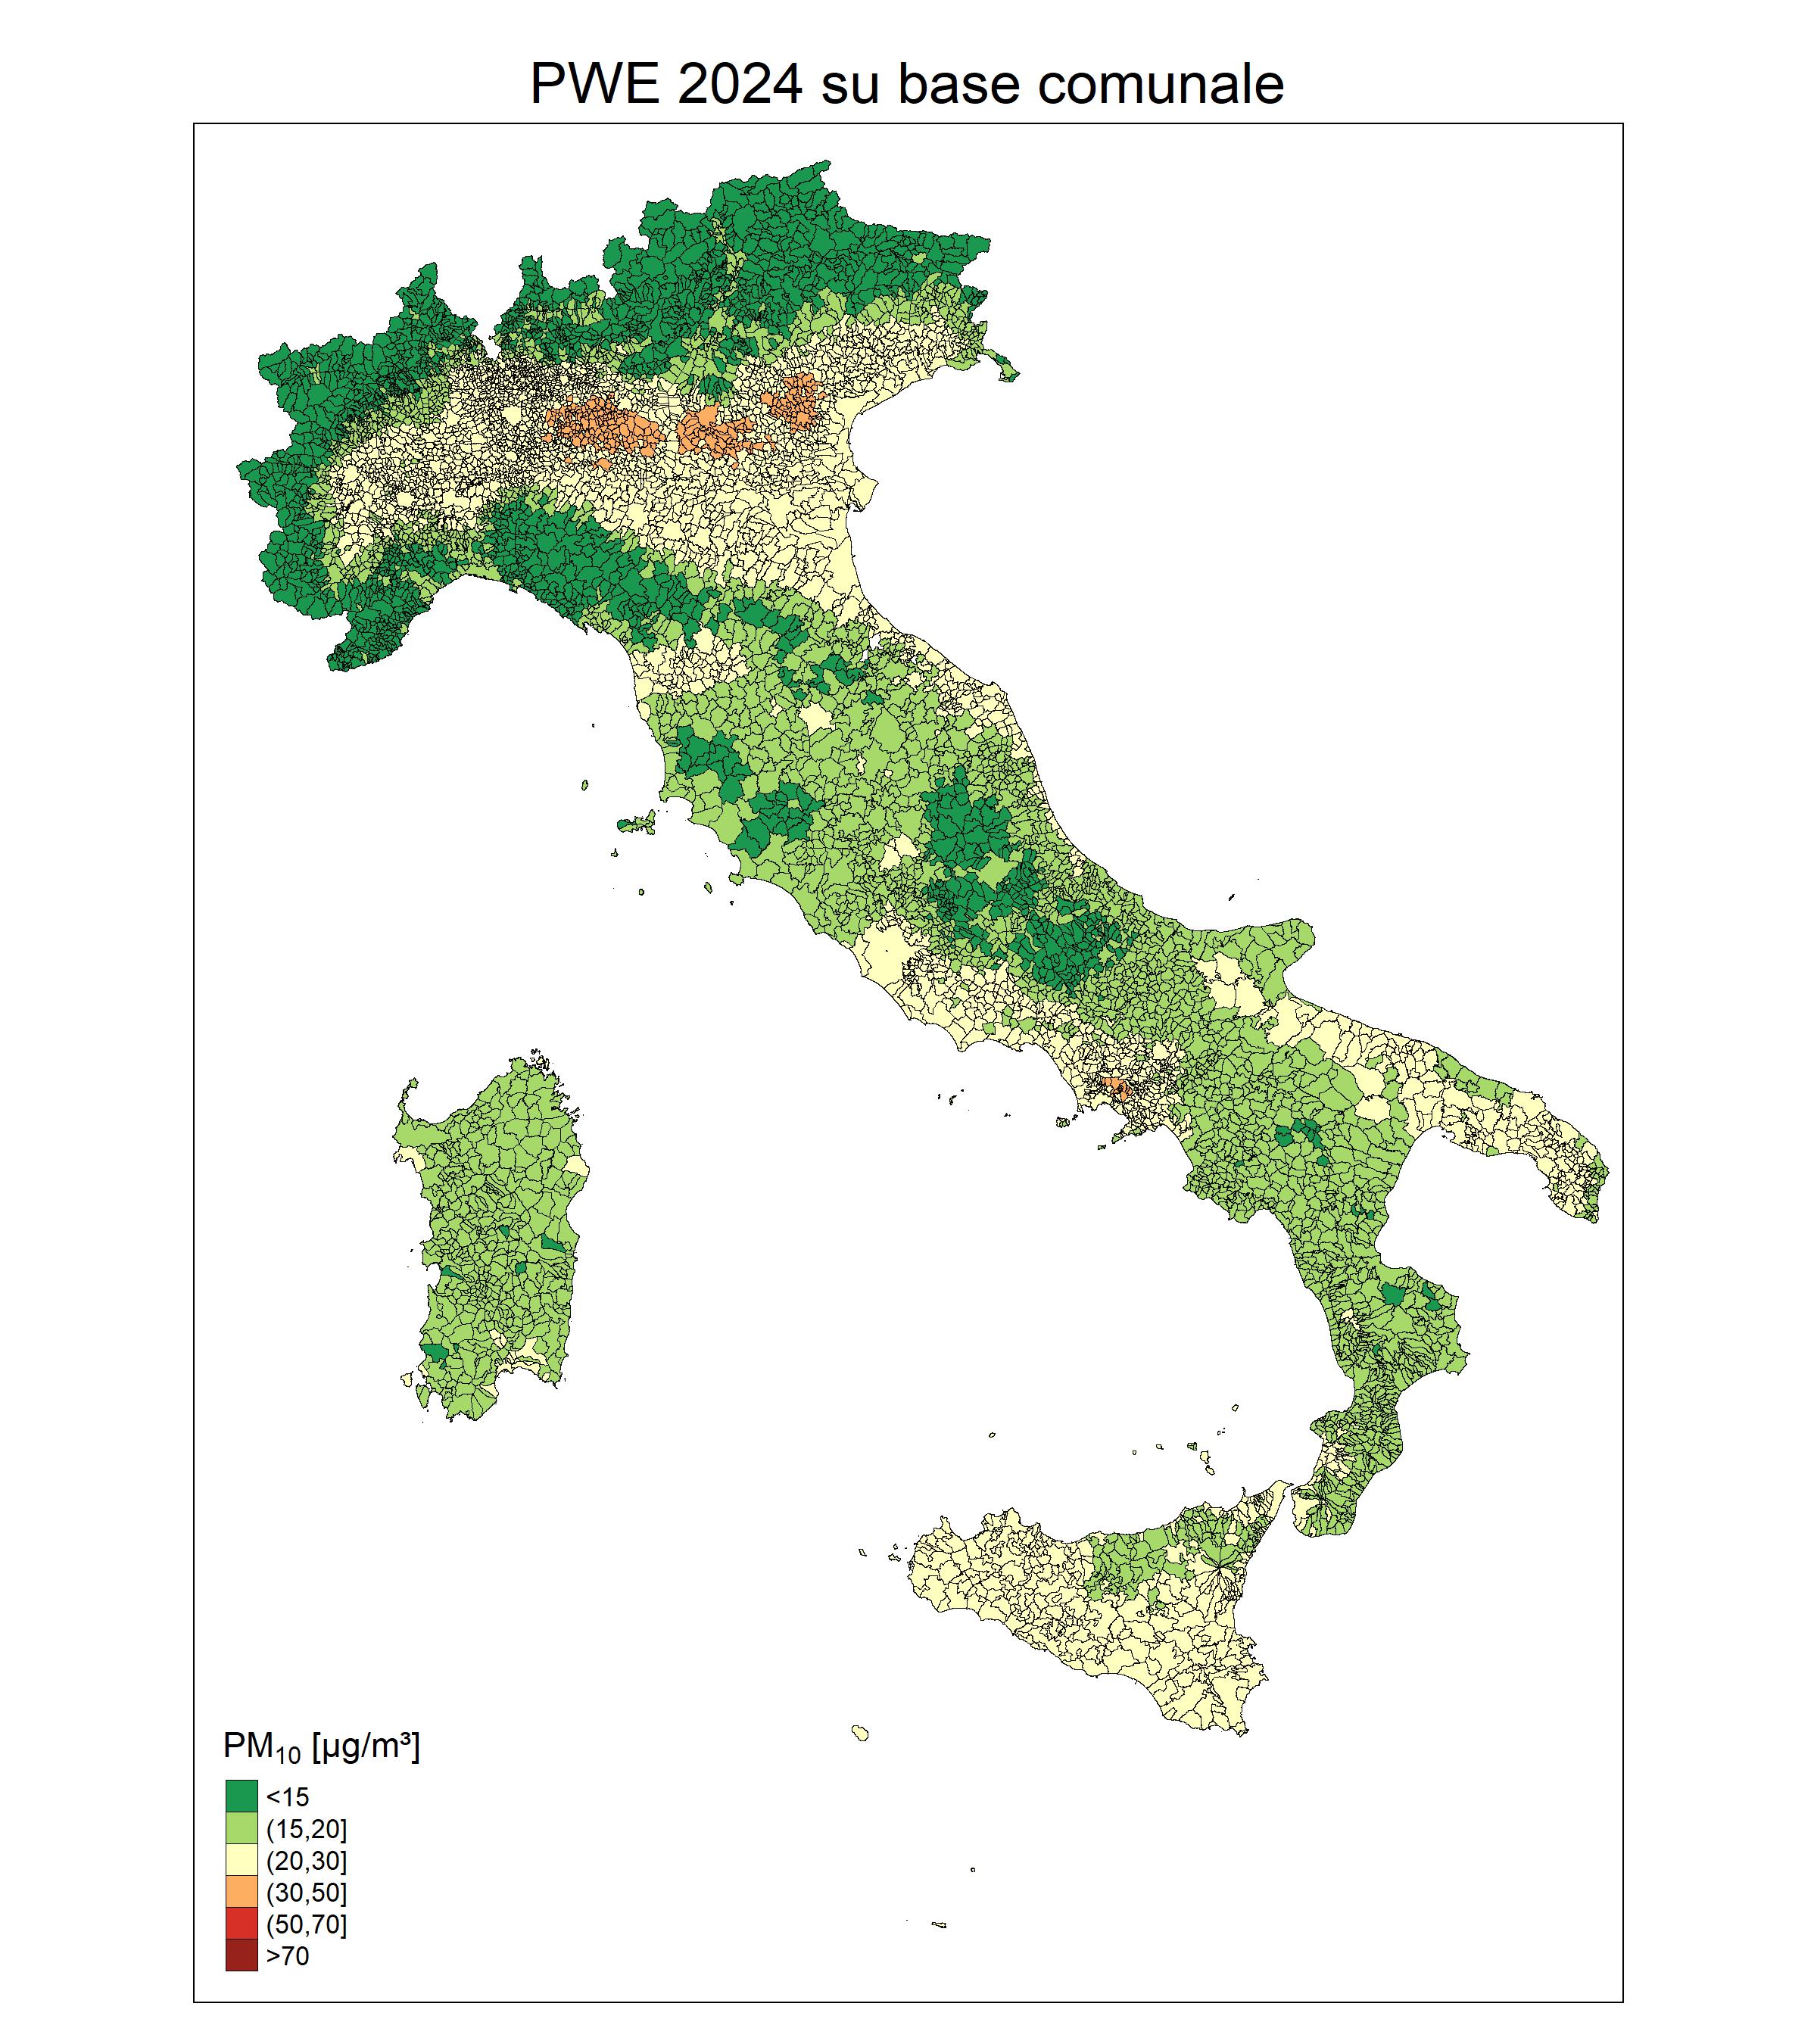
In 2024, 95% of the population was exposed to levels above the WHO guideline value (15 µg/m 3); 72% were exposed to levels higher than the interim target (IT) 4 (20 µg/m 3); 4% of the population residing in 243 municipalities was exposed to levels higher than IT3 (30 µg/m 3). In the latter case the exposed population is mainly concentrated in Veneto and to a lesser extent in Lombardy and Campania (Figure 1 - Table 1).
In no municipality in 2024 were PWE levels higher than IT2 (50 µg/m 3).
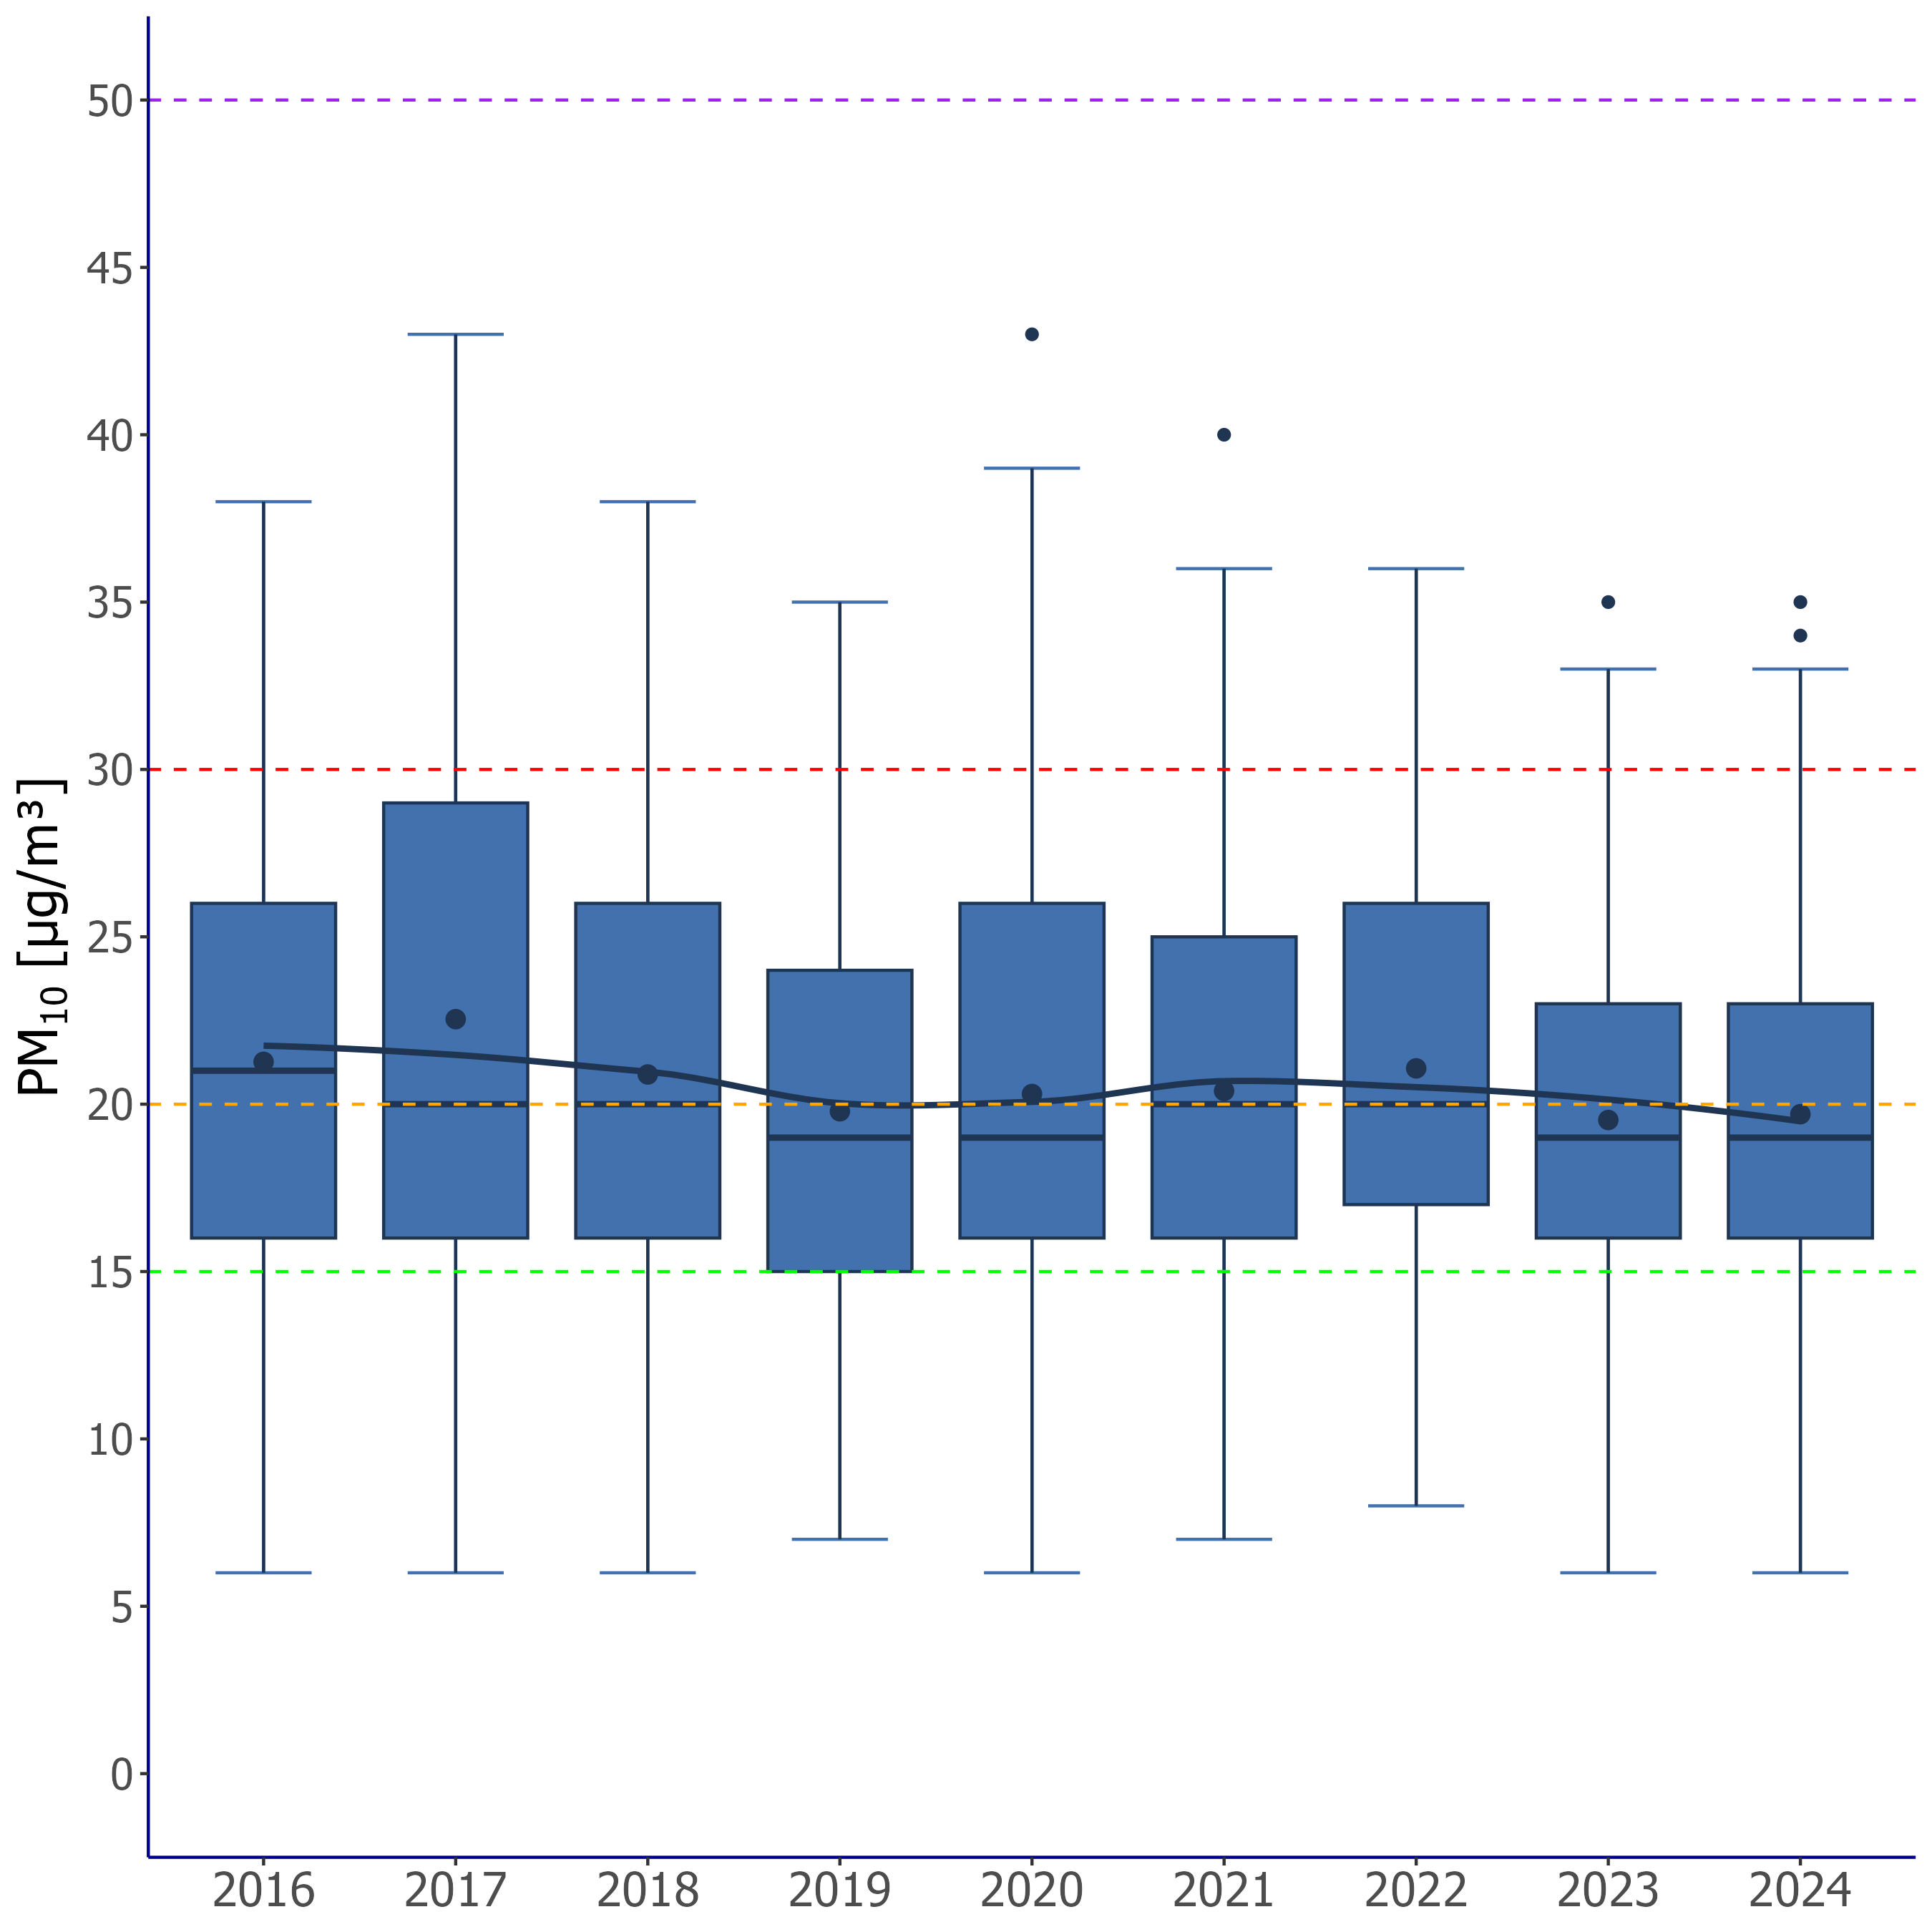
The national average of PWE was 20 µg/m 3 (6 – 35 µg/m 3) (Figure 2).
In the nine years taken into consideration, there was an overall tendency for PWE values to remain stationary, with the sole exception of 2017, the year in which a higher average value was observed (23 µg/m 3) (Figure 2). The trend, although it has not been evaluated in quantitative terms with statistical methods and refers to a relatively short period, appears consistent with that observed in the last decade in air quality monitoring stations.
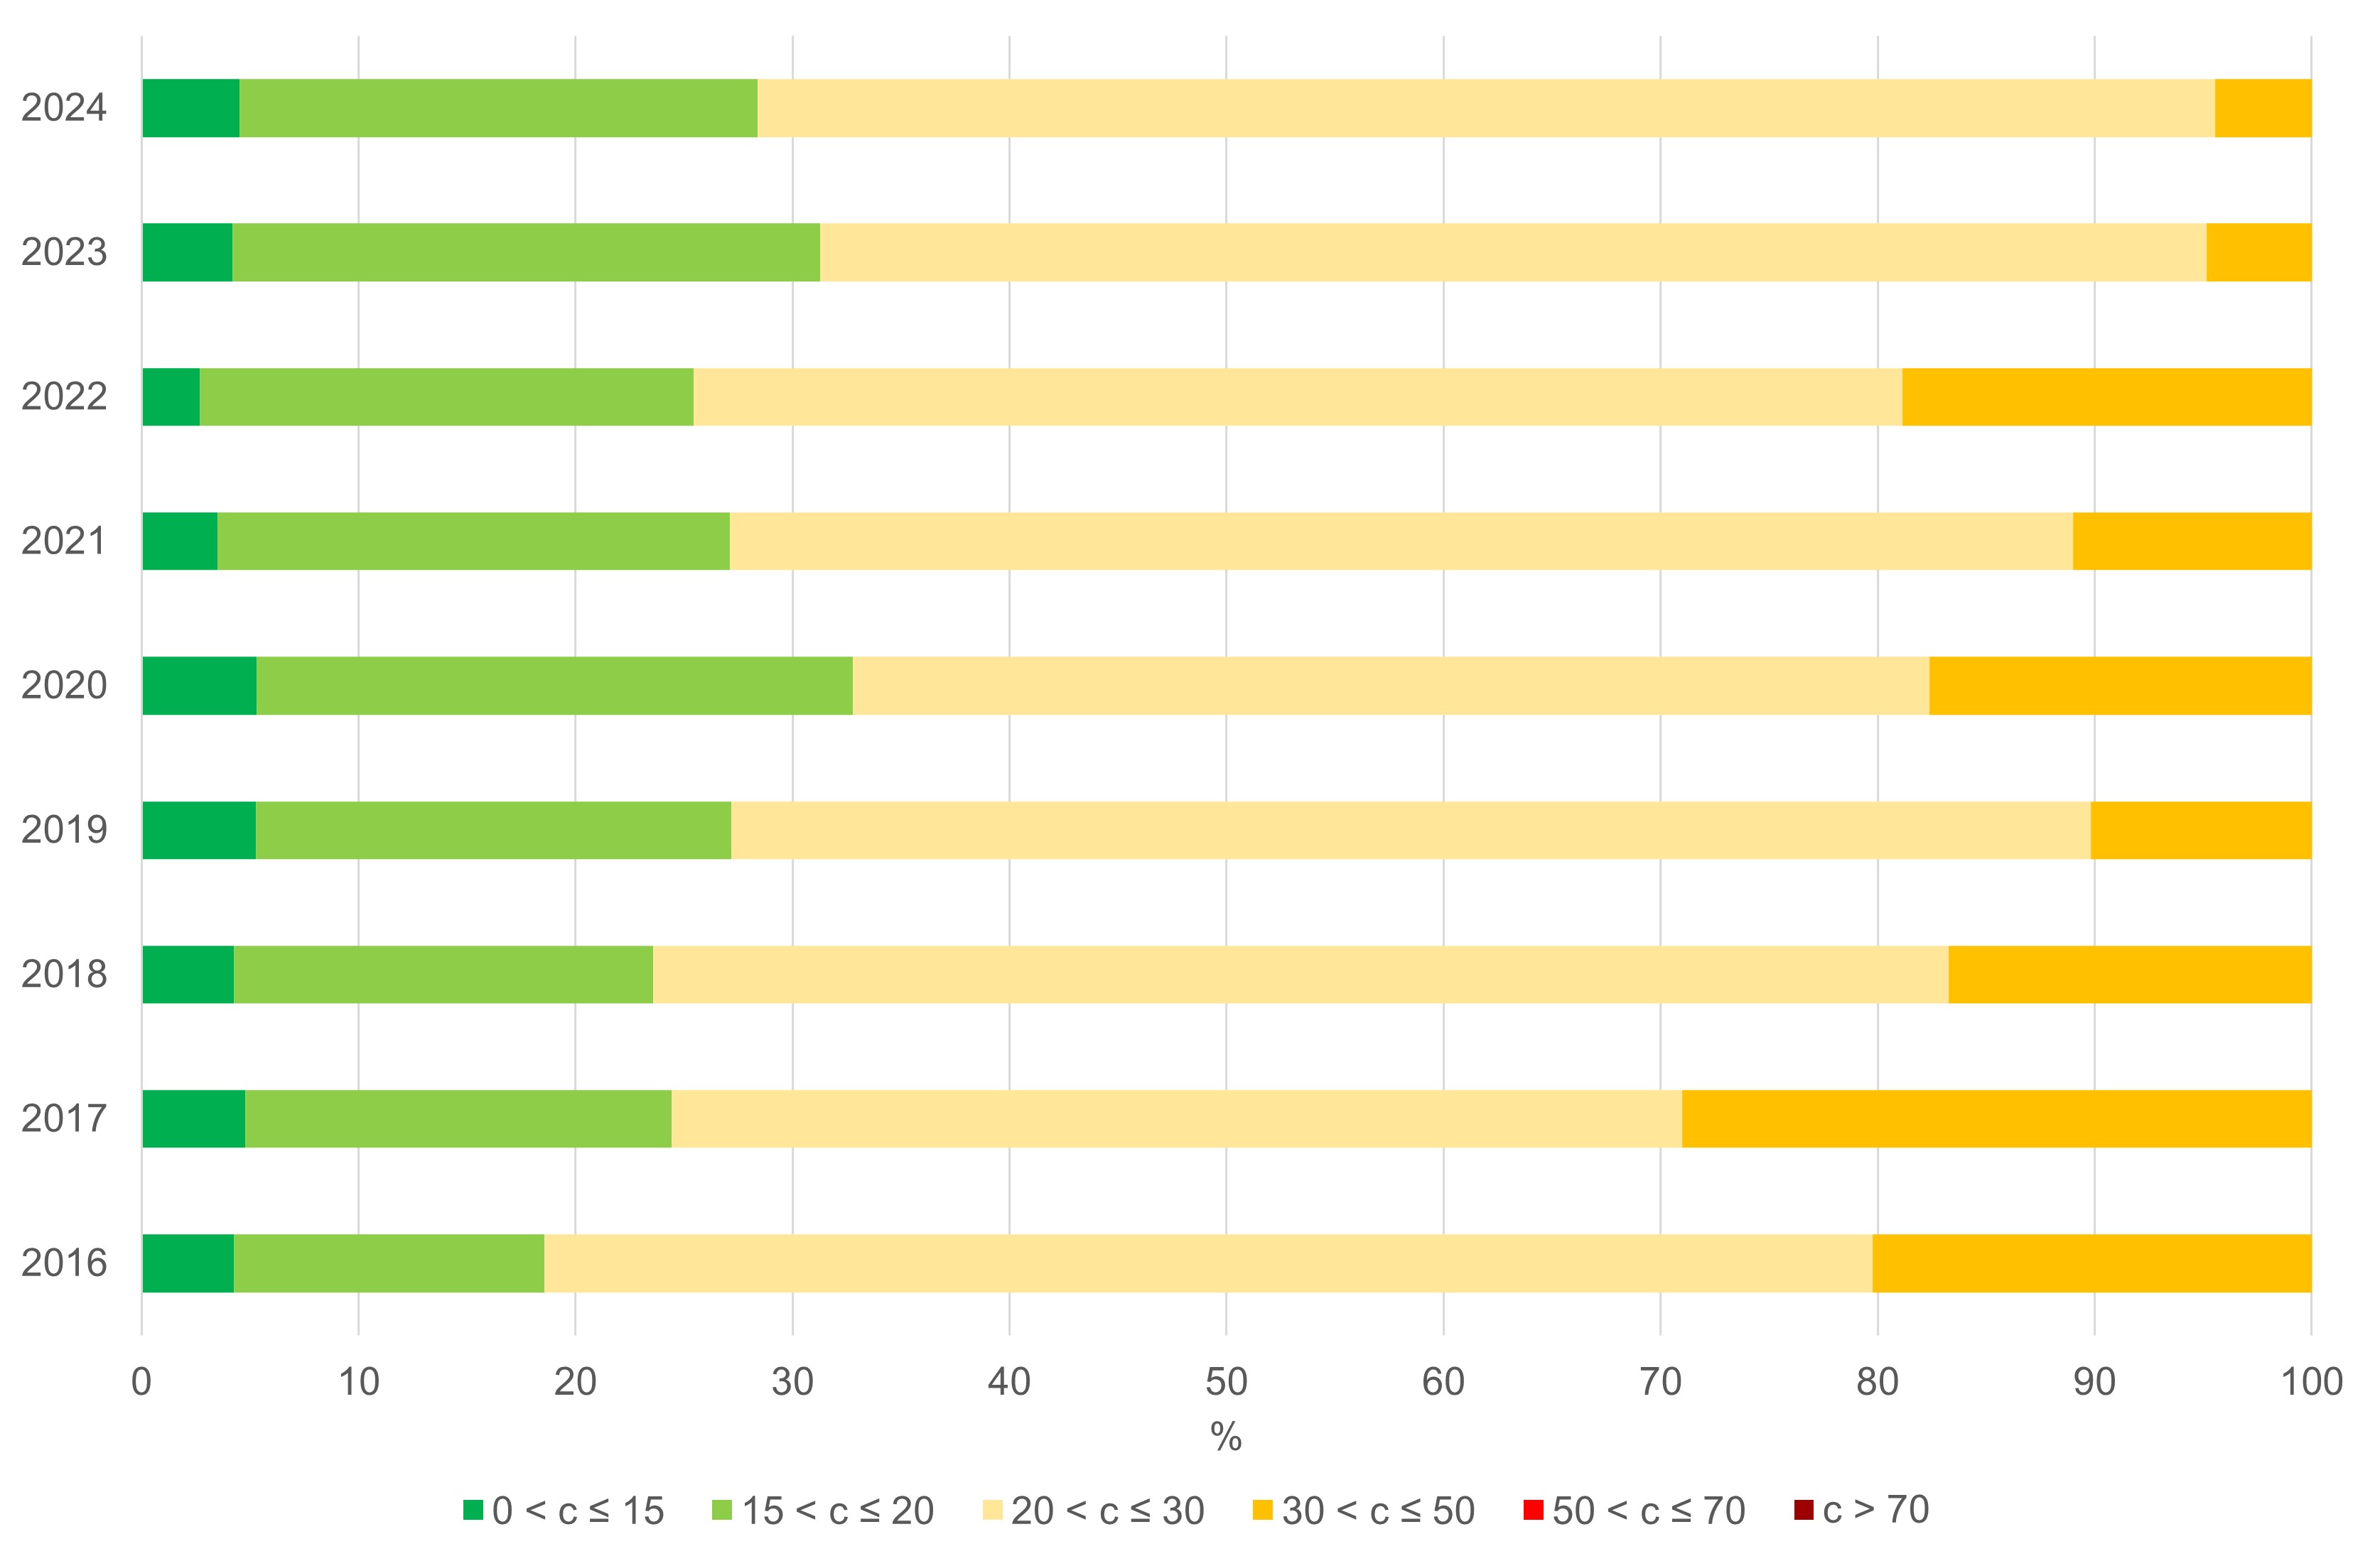
Between 2016 and 2024, the share of the population exposed to a PM10 concentration lower than the threshold value recommended by the WHO assumes values between 3 and 5%, reaching its minimum in 2022. At the same time, the PWE in all the years considered is never higher than the IT2 (50 µg/m 3) (Figure 3).
| Allegati |
|---|
Thumbnail
Titolo
Figure 1: Population-weighted average exposure to atmospheric particulate matter PM₁₀ at the municipal level (2024). Fonte
ISPRA processing based on data from the Department of Epidemiology of the Lazio Regional Health Service. |
Thumbnail
Titolo
Figure 2: Annual distribution of PWE values (population-weighted average exposure to atmospheric particulate matter PM₁₀ at the municipal level). Fonte
ISPRA processing based on data from the Department of Epidemiology of the Lazio Regional Health Service. Note
The box: represents the interquartile range, i.e. the difference between the third quartile (Q3, 75th percentile) and the first quartile (Q1, 25th percentile) of the data. The line inside the box indicates the median (Q2, 50th percentile), while the point represents the mean value. |
Thumbnail
Titolo
Figure 3: Percentage of the population exposed to atmospheric particulate matter PM₁₀ by exposure range and year. Fonte
ISPRA processing based on data from the Department of Epidemiology of the Lazio Regional Health Service. Note
The six reported PWE classes correspond respectively to the WHO guideline value and the four interim targets. |
Titolo
Table 1: PM₁₀ – Population-weighted average exposure (PWE) by region: percentage distribution by exposure classes (2024). Fonte
ISPRA processing based on data from the Department of Epidemiology of the Lazio Regional Health Service. Legenda
PWE: population-weighted average exposure (Population Weighted Exposure). Note
The six reported PWE classes correspond respectively to the WHO guideline value and the four interim targets. |
The indicator complies with those used on a European scale by the EEA and on a global scale by the World Health Organization to monitor exposure. Furthermore, it represents the basis (exposure assessment) for developing health risk assessments ( health risk assessment and burden of disease ) in a manner consistent with the approaches of the same two supranational organizations.
With reference to the United Nations sustainable development goals (SDG goals ), the methodological approach is consistent with that followed for the calculation of the indicator useful for monitoring progress relating to Goal 11 (make cities and human settlements inclusive, safe, durable and sustainable), target 11.6 (By 2030, reduce the negative per capita environmental impact of cities, in particular regarding air quality and waste management).
From a methodological point of view, the exposure estimate thus obtained also represents the basis for developing one of the indicators useful for monitoring progress relating to the Goal 3 (Ensure health and well-being for all at all ages), target 3.9 (By 2030, substantially reduce the number of deaths and illnesses from hazardous chemicals and from pollution and contamination of air, water and soil.)