Mariacarmela Cusano
The indicator is based on information on air quality plans which, under Directive 2008/50/EC (as transposed into Italian legislation by Legislative Decree No 155/2010), must be adopted where the limit values for the main air pollutants are exceeded.
At the national level, the Regions and Autonomous Provinces report information on air quality plans to ISPRA using the reporting format established by Commission Implementing Decision 2011/850/EU. ISPRA collects and stores these data in the InfoAria database. The information is then transmitted to the European Commission "within two years of the end of the year in which the first exceedance was observed" (Directive 2008/50/EC, Article 23).
Information on air quality plans is therefore not reported annually, but only when new information becomes available. Consequently, the analysis includes both the information reported in 2025 and the information submitted in previous years by Regions and Autonomous Provinces that were not required to submit an updated report.
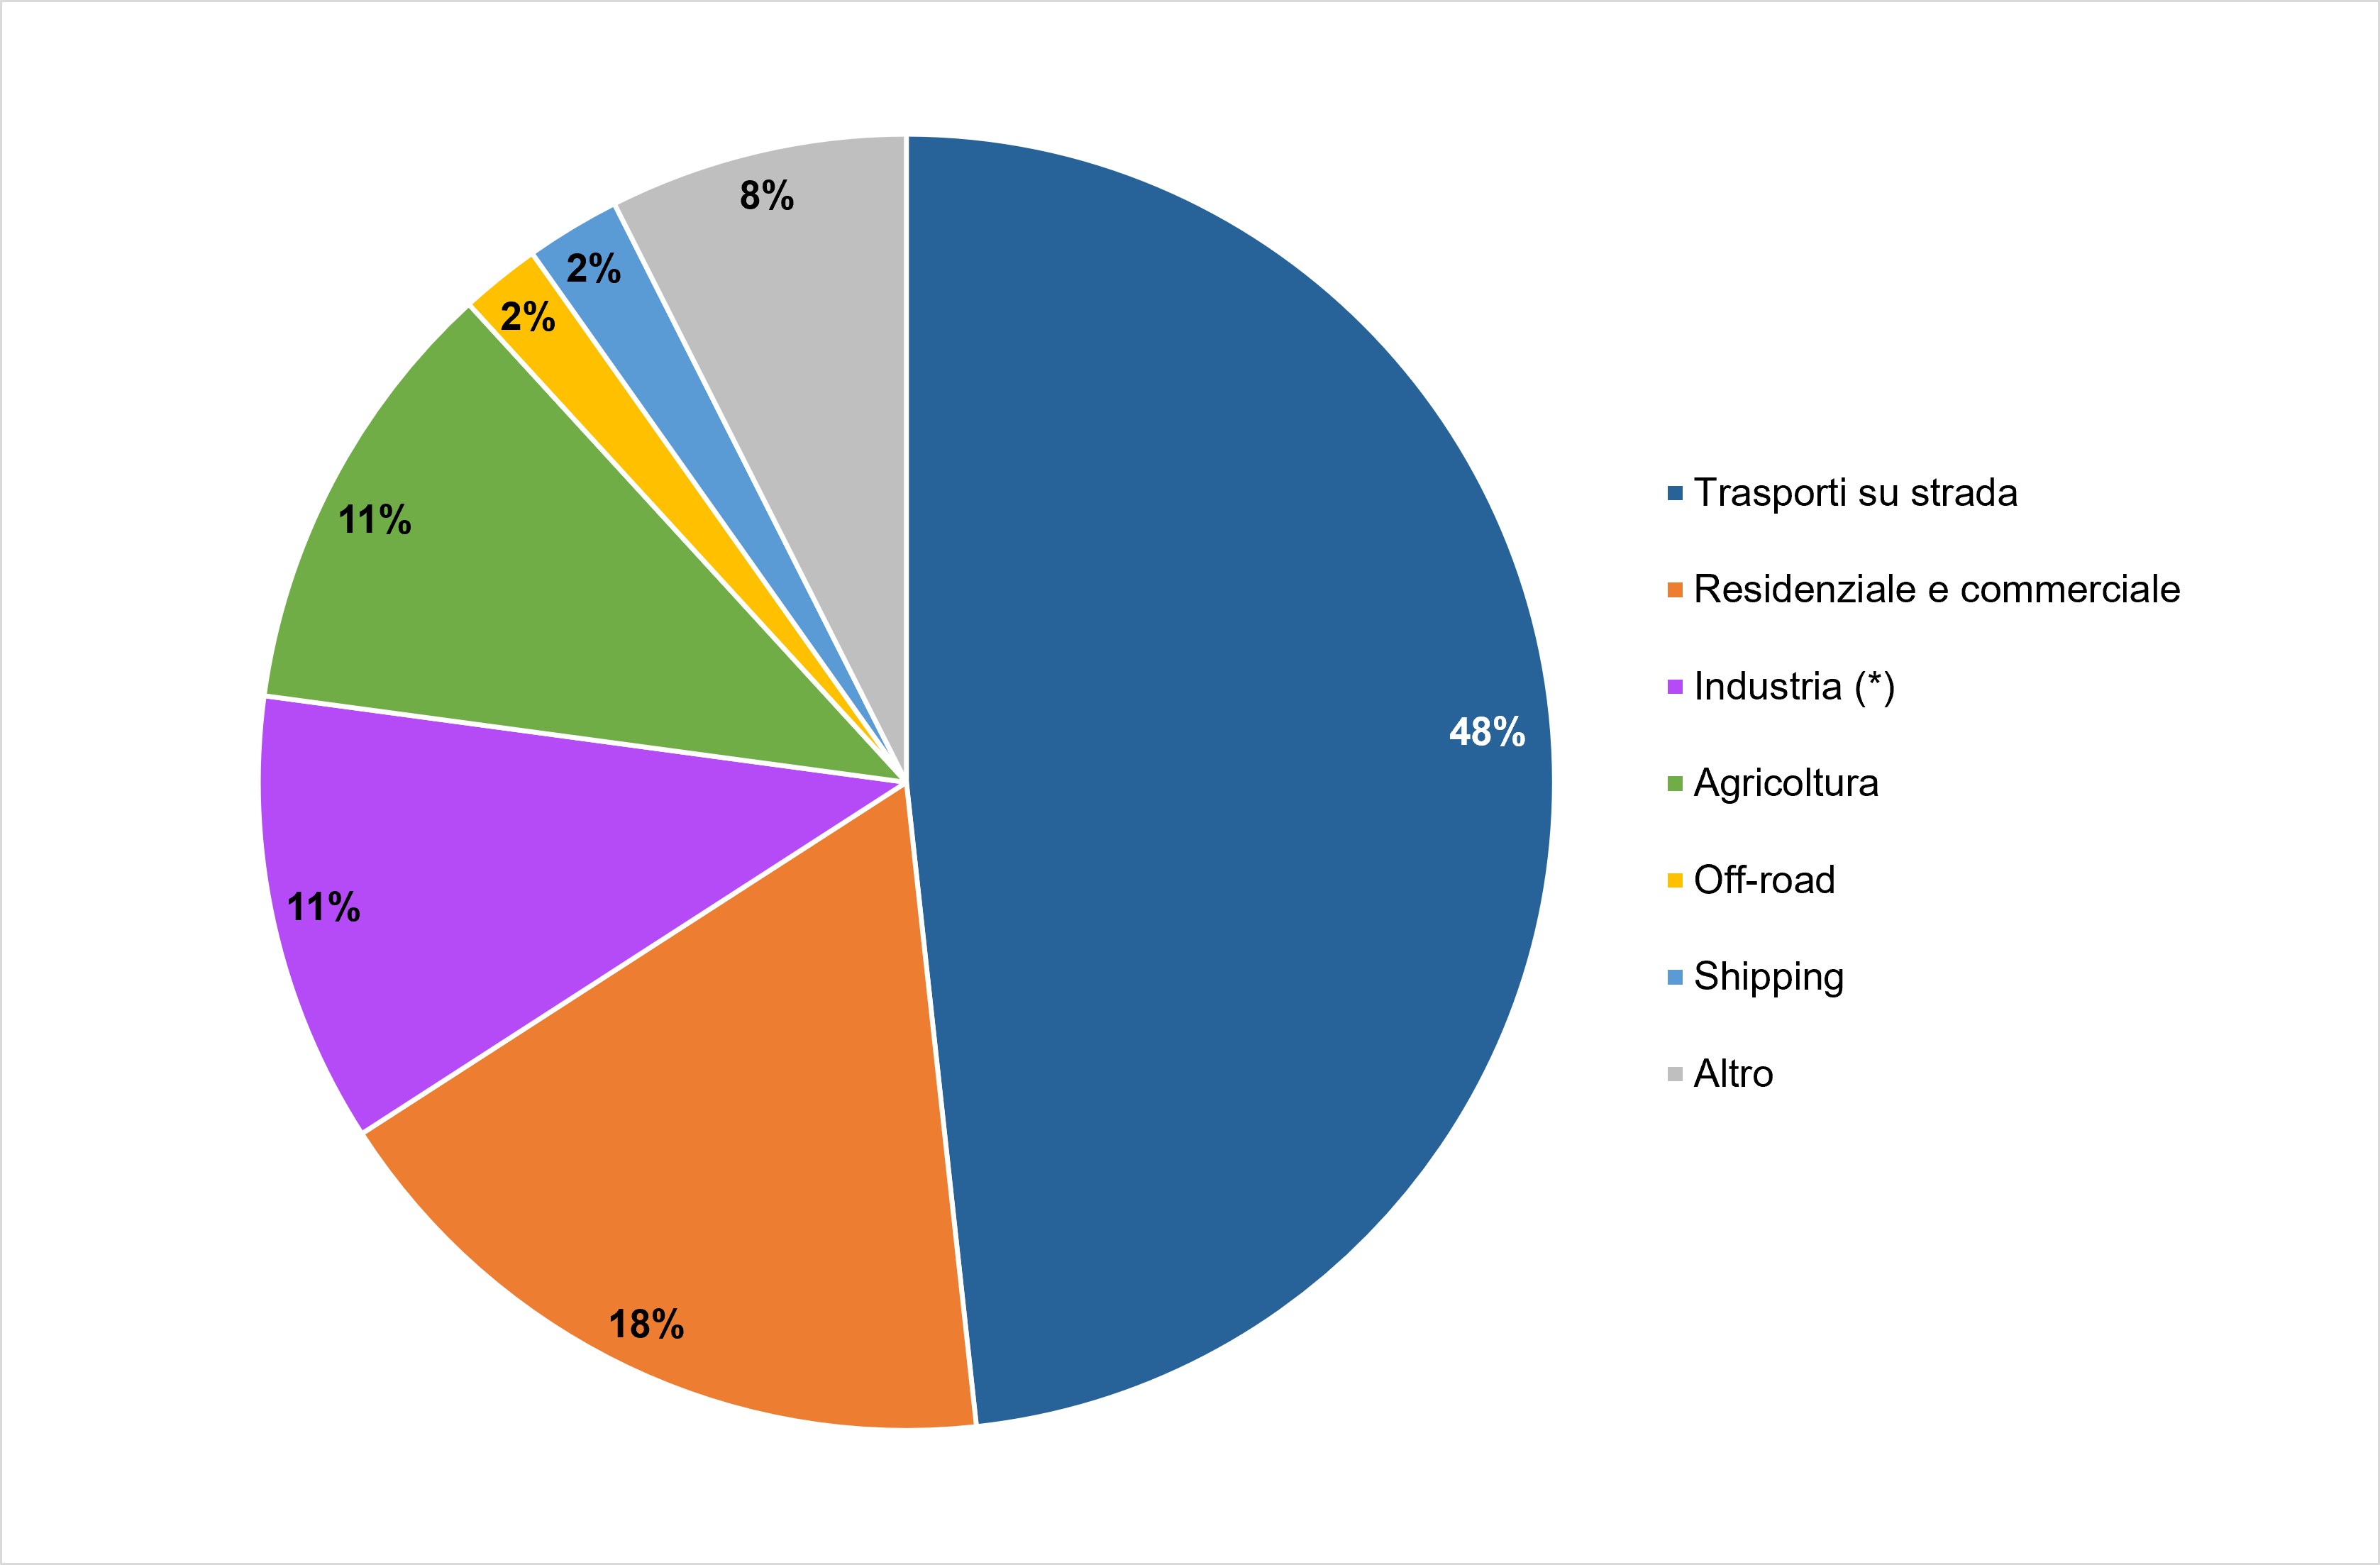
The analysis shows that the measures reported in 2025, adopted following exceedances of the limit values recorded in 2023, together with those reported in previous years and still in force, amount to 551. Of these measures, 48% relate to the road transport sector and 18% to the residential and commercial sector.
The indicator is based on information relating to the air quality plans that regions and autonomous provinces (authorities responsible for the management and assessment of air quality in Italy) must draw up and implement, pursuant to Legislative Decree 155/2010 (art. 9) (implementation of Directive 2008/50/EC) and its corrective Legislative Decree 250/2012, if the set limit values are exceeded for air pollutants, sulfur dioxide (SO 2), nitrogen dioxide (NO 2), benzene (C 6 H 6), carbon monoxide (CO), lead (Pb), PM10 and PM2.5 particulate matter and/or the target value (VO) established for ozone (O 3).
At a national level, the regions and autonomous provinces communicate information on regional/provincial air quality plans, according to the format established by Decision 2011/850/EU, to MASE and ISPRA, within eighteen months from the end of the year in which the exceedances were recorded for the first time (Legislative Decree 155/2010, art. 19); at European level, each Member State transmits the aforementioned information to the European Commission (EC) "within two years from the end of the year in which the first exceedance was detected" (Directive 2008/50/EC, art. 23).
Current legislation therefore provides that the transmission of information on air quality plans is carried out only in the case of new elements to be communicated, such as a new or updated plan.
An air quality plan is the result of a process which, through the characterization of the territory, the identification of specific emission sources (emission inventory and related projections), the assessment of air quality and the development of emission and air quality scenarios, leads to the identification of "additional" measures, compared to those already existing at national and regional level, aimed at improving air quality.
As regards ozone, before Directive 2008/50/EC, information on the plans or measures adopted in the event of exceeding the VO was transmitted to the EC via a report (Directive 2002/3/EC, Legislative Decree 183/2004), which simply provided the link to the plan or measures. This mode of transmission made the information difficult to use.
Starting from 2012, the format for the transmission of plans/measures for exceeding the VO of the O 3 is that established by Decision 2011/850/EU (Annex II, parts H-K). Since it is a totally secondary pollutant, the measures communicated to reduce ozone concentrations are essentially those aimed at reducing the concentrations of its precursors in ambient air, mainly nitrogen dioxide (NO 2) and volatile organic compounds (VOCs).
Provide information regarding the measures undertaken by regions and autonomous provinces to comply with the limits of air pollutants established by law.
- Directive 2008/50/EC implemented at national level by Legislative Decree 155/2010 and subsequent amendments.
- Decision 2011/850/EU.
Directive 2008/50/EC on air quality, implemented at national level with Legislative Decree 155/2010 and subsequent amendments, requires compliance with the limits of concentrations of regulated pollutants in the atmosphere and, if this does not happen, the implementation of actions necessary to achieve said values within the prescribed terms.
SPRA, Rapporti 254/2016, Piani per la qualità dell'aria: analisi delle nuove informazioni relative all'anno 2012
Regions, Autonomous Provinces
The data is collected and archived in ISPRA in the InfoAria Database, in alignment with the provisions of Directive 2008/50/EC (implemented by Legislative Decree 155/2010) and Decision 2011/850/EU. The InfoAria Database is not public.
Region, autonomous province
2012-2023
The indicator is based on information relating to air quality plans that regions and autonomous provinces transmit to ISPRA and MASE according to the format established by Decision 2011/850/EU. In particular, the indicator consists of the number of measures adopted as part of the air quality plans, and also provides an indication of the emission sectors involved, including: Road transport, Residential and commercial, Industry (including heat and energy production), Agriculture, Off-road or Non-road transport, Shipping o Maritime transportation and Other.
In 2025, all autonomous regions/provinces have communicated or confirmed information on the plans compared to the exceedances recorded in the reference year 2023.
The measures communicated, or confirmed, in relation to the exceedances recorded in 2023 are 551, the majority of which (48%) were adopted in the road transport sector (Figure 1).
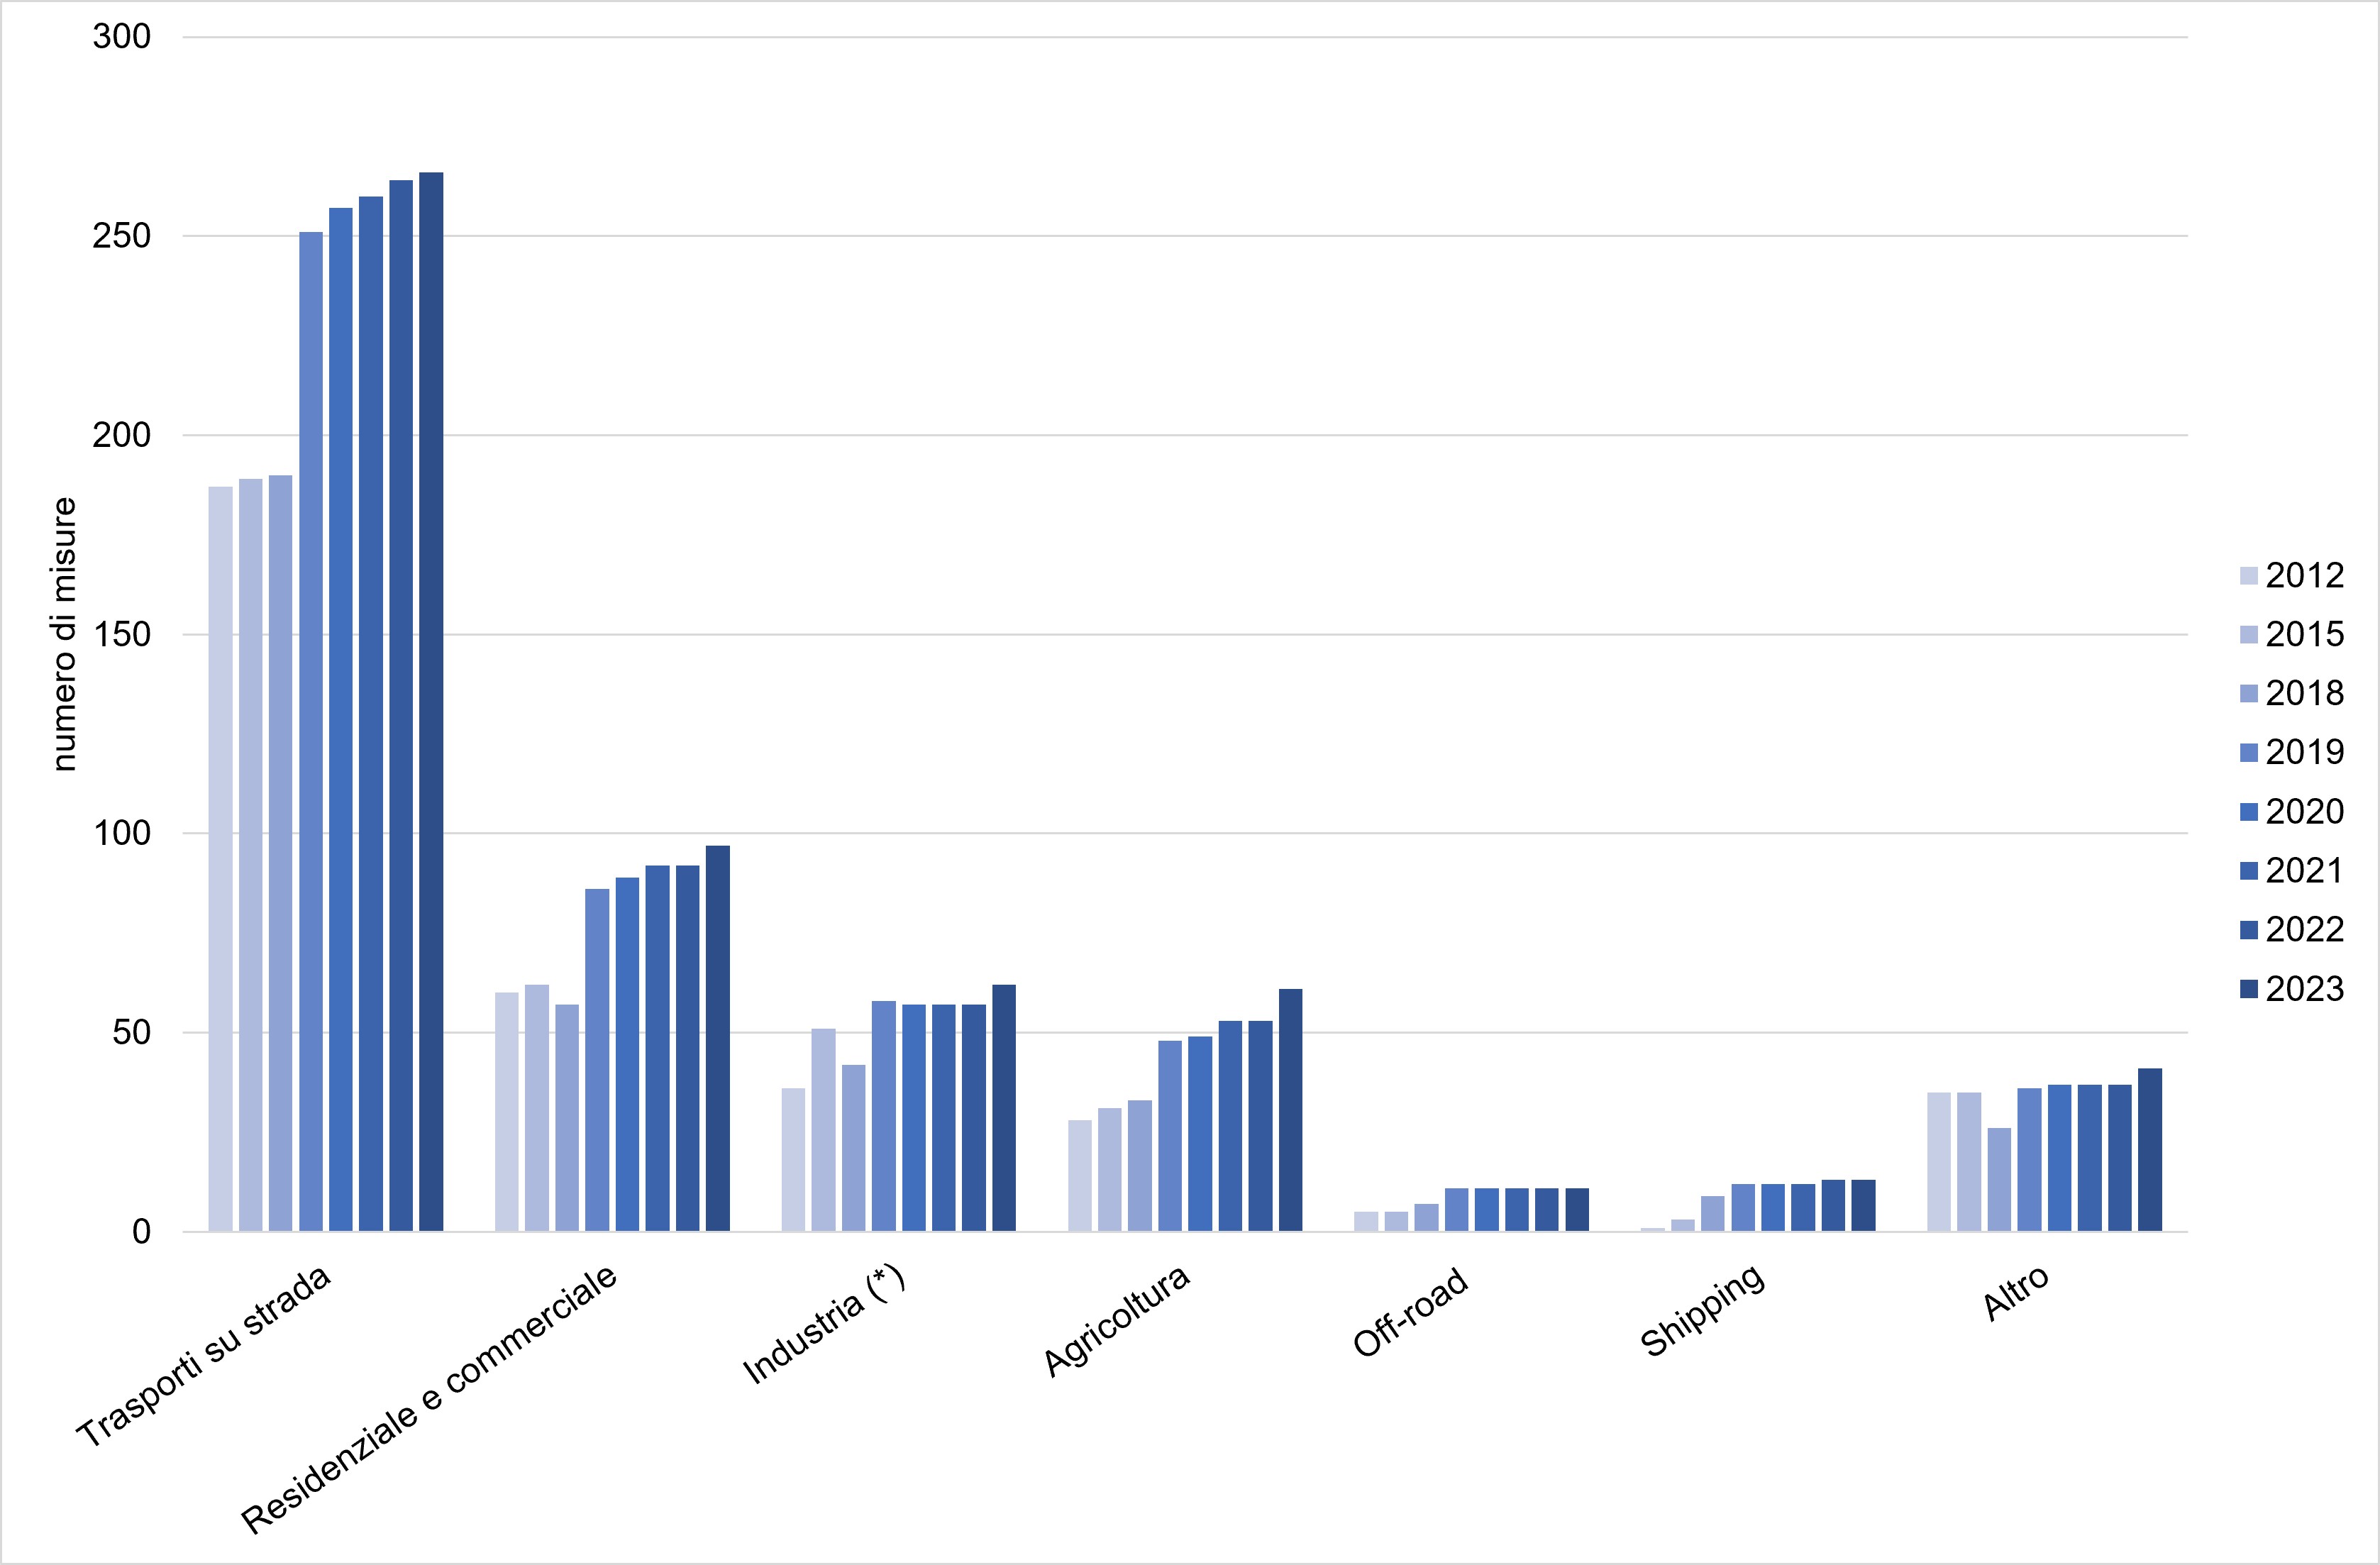
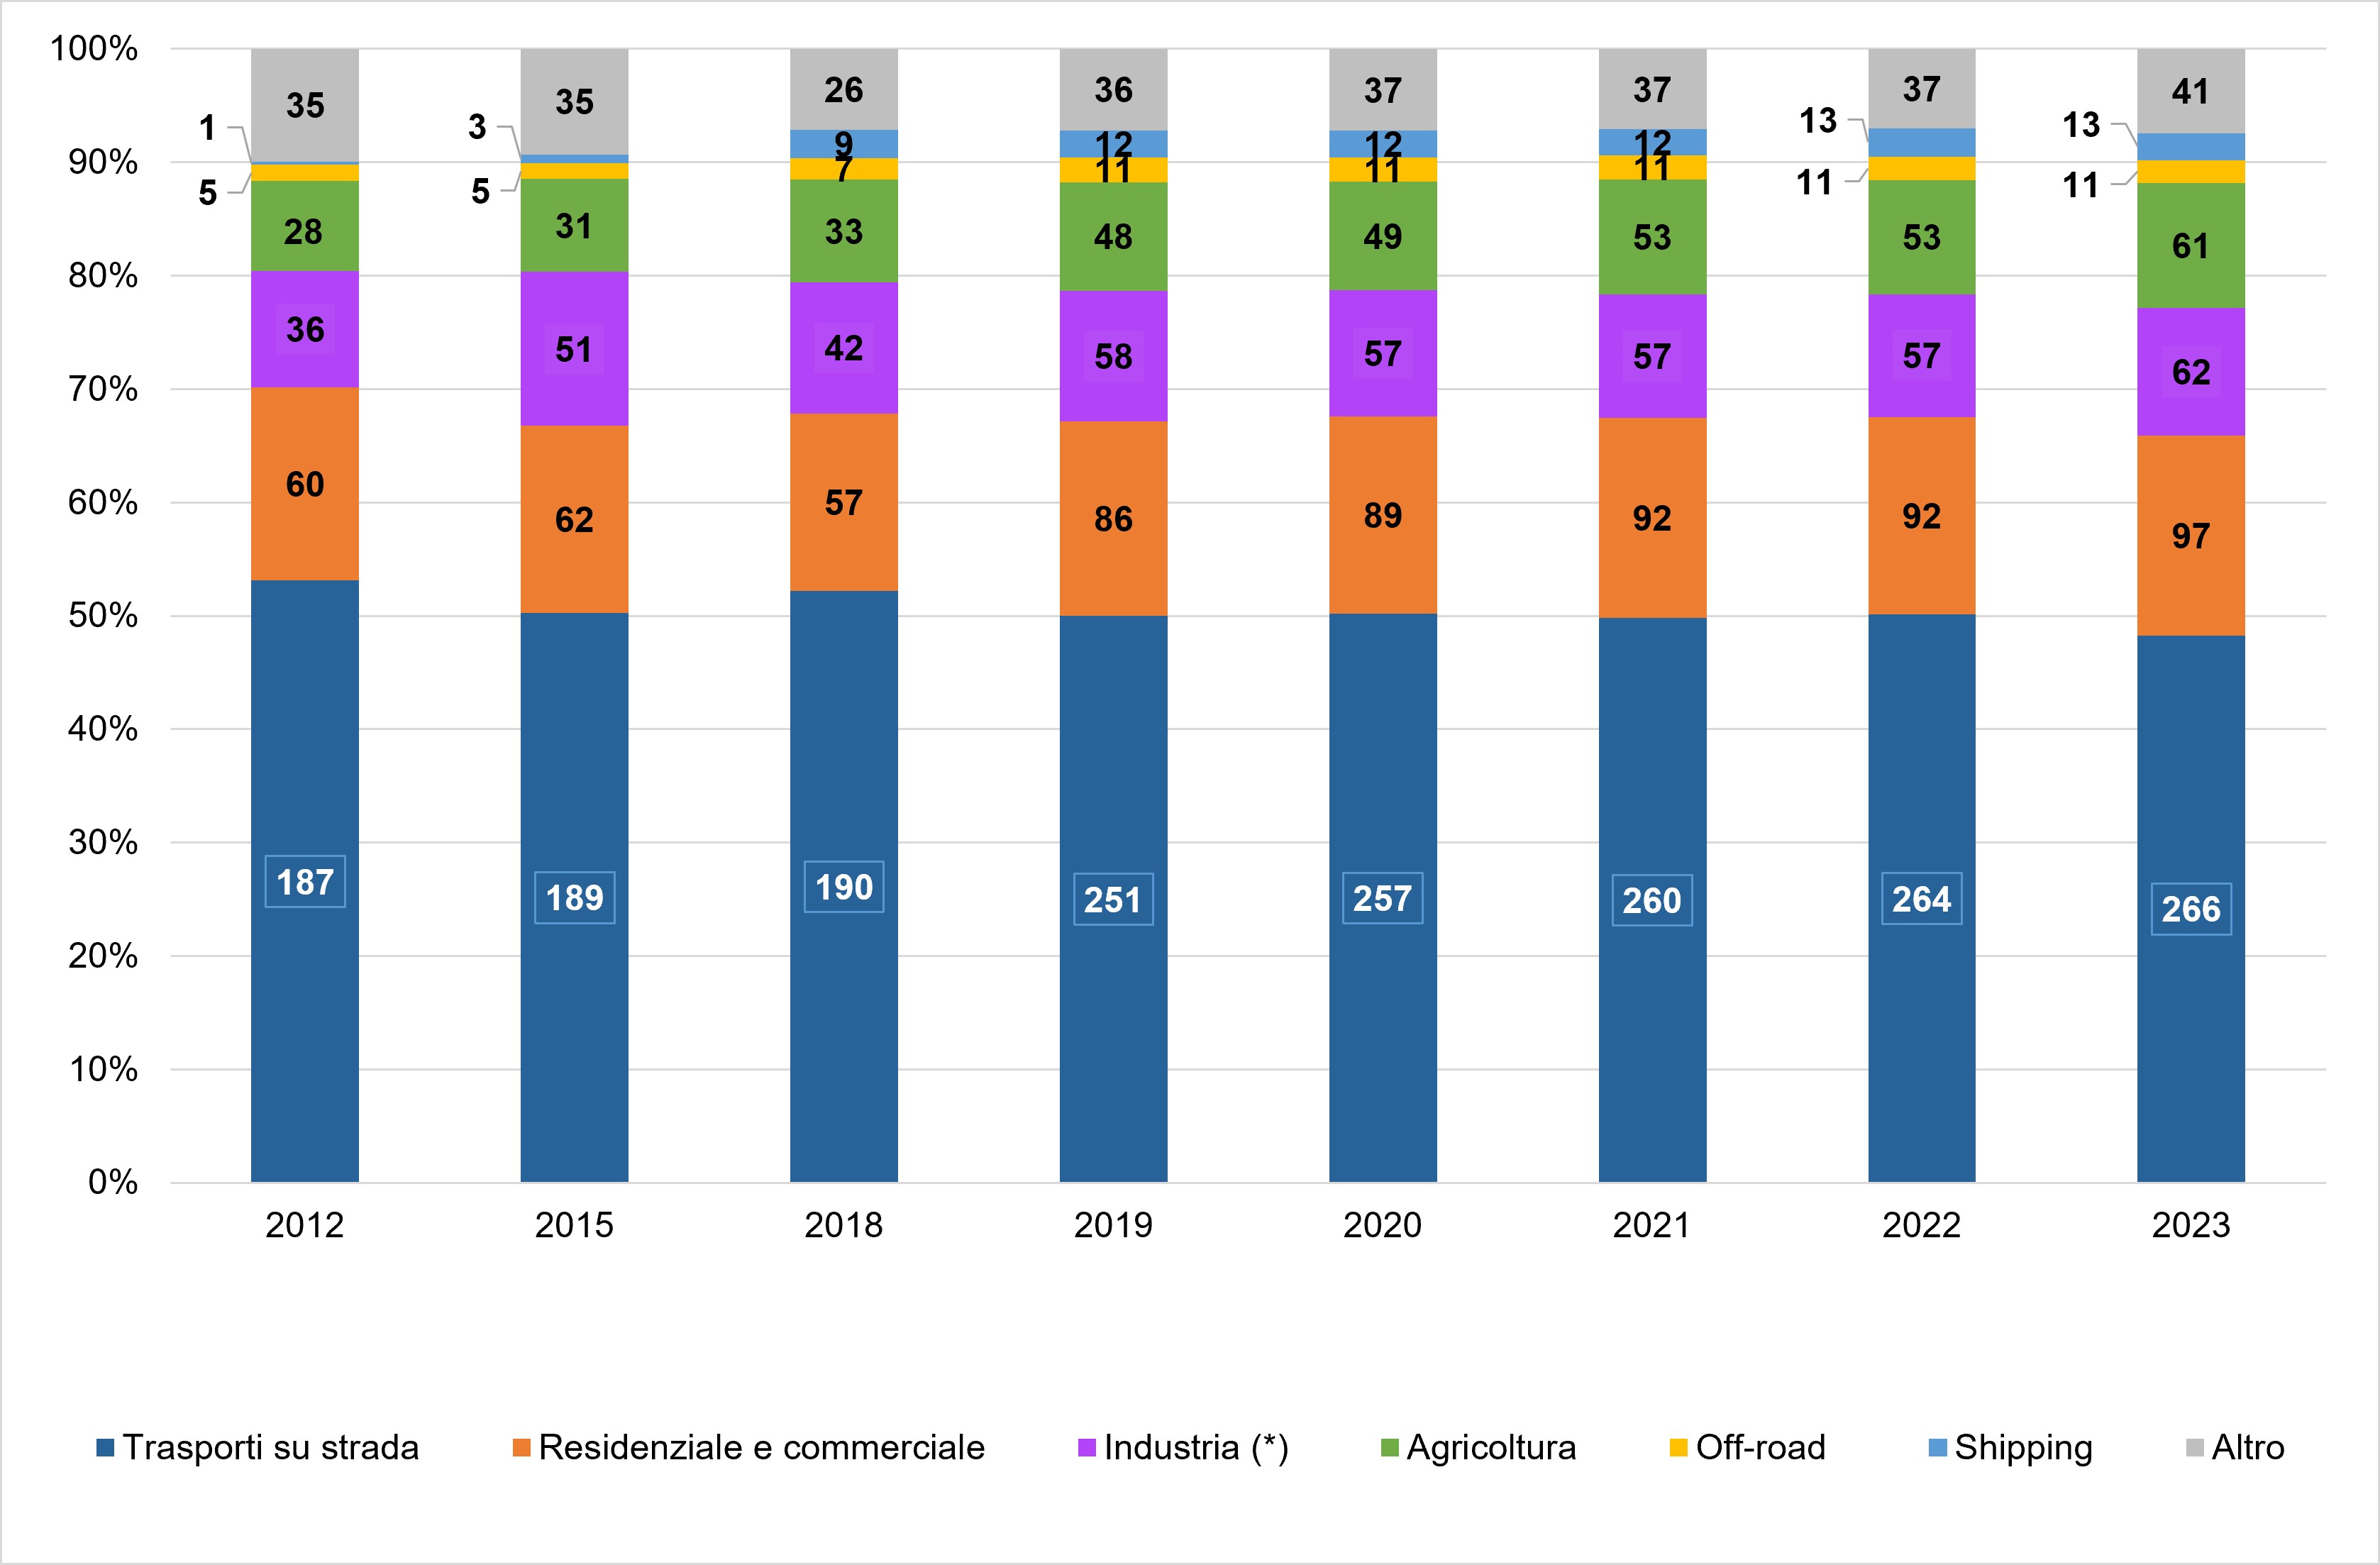
As regards the emission sectors affected by the measures communicated for the exceedances recorded in the period 2012-2023, it can be observed (Figures 3a, 3b) that:
- the road transport sector is the one with the highest number of measures;
- the measures adopted in the sectors, Road transport, Residential and commercial and Industry (including heat and energy production), show a significant increase between 2018 and 2019, followed by a more contained growth in the following years;
- the measures adopted in the Agriculture sector show an increasing trend over the entire period considered;
- the measures adopted in the Off-road and Shipping sectors show an increase between 2012 and 2019, and an almost constant trend in the following period, 2020 - 2023;
- the measures, for which the emission sector involved is not specified, indicated with "Other", present an almost constant trend over the entire period considered.
| Data |
|---|
Headline
Table 1. Information on air quality plans reported by the Regions and Autonomous Provinces in accordance with the applicable legislation Data source
ISPRA processing on data provided by regions and autonomous provinces. Note
SI - information relating to the plan has been transmitted; # Information on the assessment of air quality for ozone is not available.
|
Thumbnail
Headline
Figure 1. Distribution of measures reported or confirmed for 2023, by emission sector Data source
ISPRA processing based on data provided by the Regions and Autonomous Provinces. Note
(*) Including heat and power generation. |
Thumbnail

Headline
Figure 2: Distribution by emission sector of the measures communicated or confirmed for 2023, detailed by region/autonomous province Data source
ISPRA processing on data provided by regions and autonomous provinces. Note
(*) = including heat and energy production. |
Thumbnail
Headline
Figure 3a: Distribution of measurements (number) by emission sector and by year Data source
ISPRA processing on data provided by regions and autonomous provinces. Note
(*) = including heat and energy production. |
Thumbnail
Headline
Figure 3b: Distribution of measures (percentage) by emission sector and by year Data source
ISPRA processing on data provided by regions and autonomous provinces Note
(*) = including heat and energy production |
Headline
Dati per Figura 1: Distribuzione per settore emissivo delle misure comunicate o confermate per il 2023 Data source
Elaborazione ISPRA su dati forniti da Regioni e Province autonome. Note
(*) = inclusa la produzione di calore ed energia. |
Headline
Dati per Figura 2: Distribuzione per settore emissivo delle misure comunicate o confermate per il 2023, dettaglio per regione/provincia autonoma Data source
Elaborazione ISPRA su dati forniti da Regioni e Province autonome. Note
(*) = inclusa la produzione di calore ed energia. |
Headline
Dati per Figura 3a: Distribuzione delle misure (numero) per settore emissivo e per anno. Dati per Figura 3b: Distribuzione delle misure (percentuale) per settore emissivo e per anno Data source
Elaborazione ISPRA su dati forniti da Regioni e Province autonome. Note
(*) = inclusa la produzione di calore ed energia. |
In 2023, 12 regions and the autonomous province of Bolzano exceeded at least one of the limit values relating to regulated air pollutants, 6 regions and the autonomous province of Trento recorded the exceeding of only the ozone VO, while one region, Sardinia, did not detect exceeding the limit or/and target values (Table 1).
Regarding the data transmission for the reference year 2023 (Table 1):
Overall, the recovery measures transmitted, or confirmed, for the exceedances recorded in 2023 are 551. As can be seen in Figure 1, the emission sector most affected is that of road transport. Figure 2 shows the detail for each individual region/autonomous province of the emission sectors affected by the 551 measures.