Gabriella Aragona
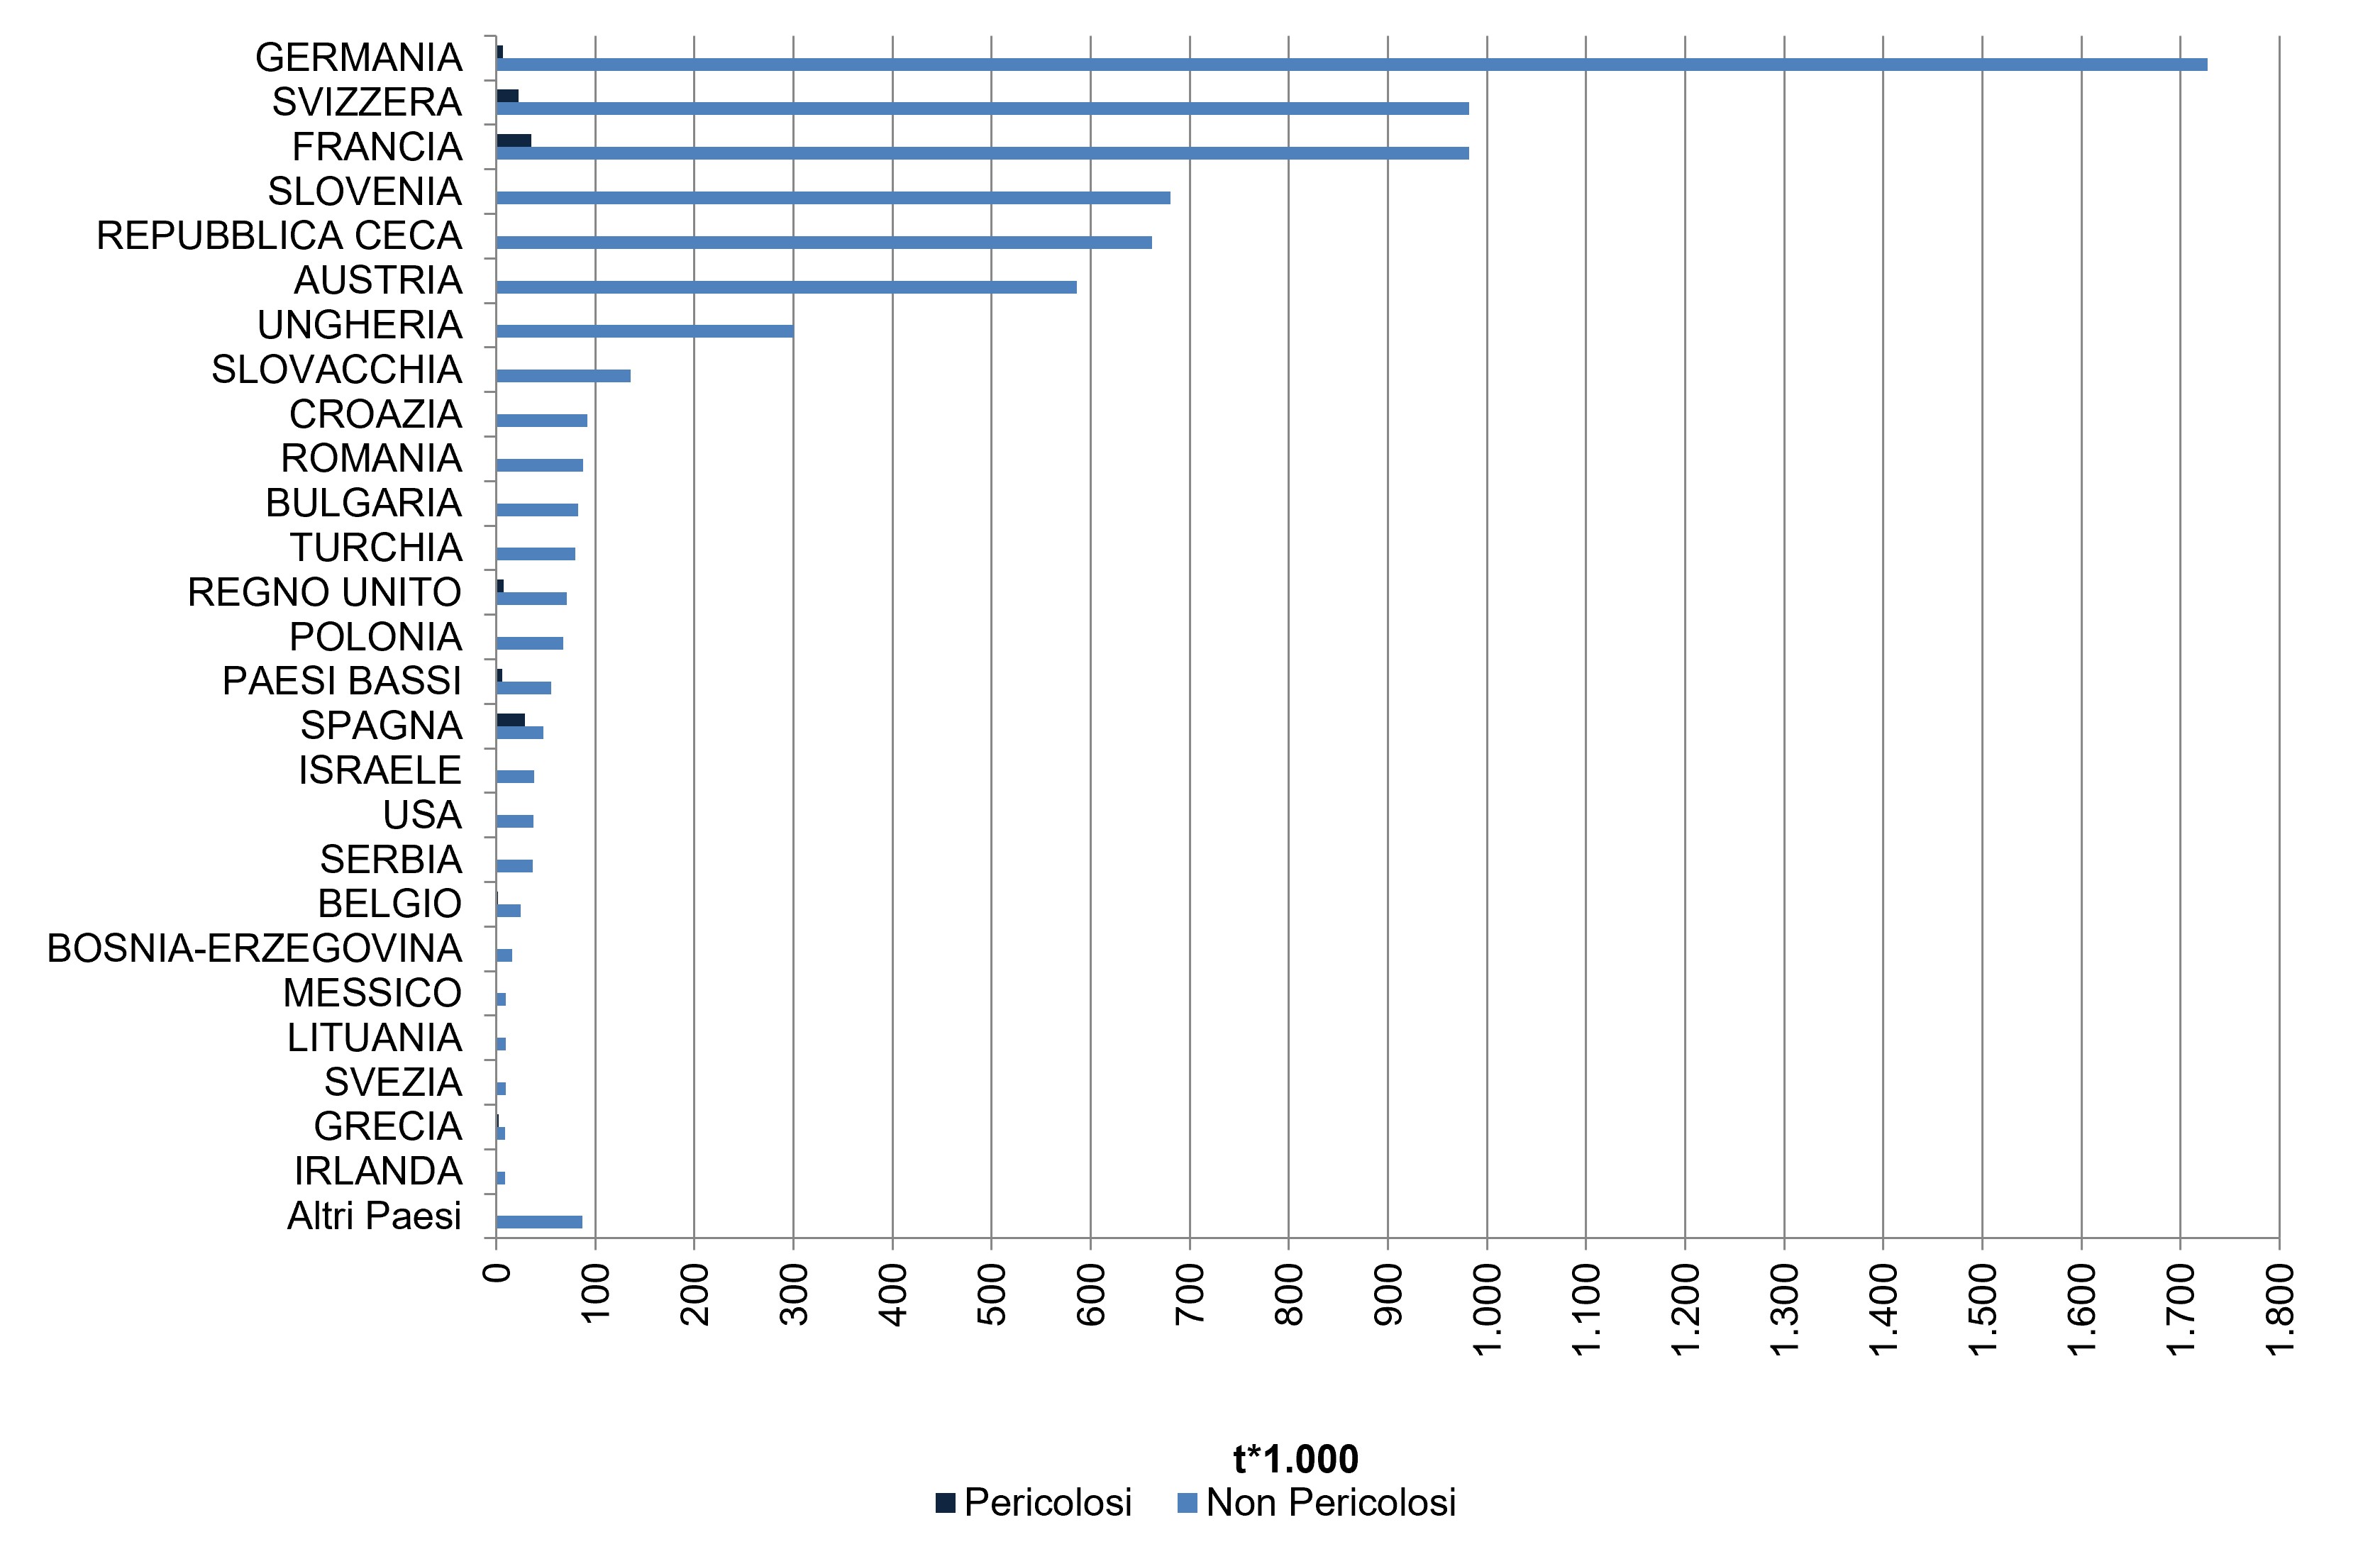
The indicator measures the quantities of Waste from Economic Activities imported for recovery in production activities. In 2024, Waste from Economic Activities imported into Italy (over 7 million tonnes) consisted almost entirely of non-hazardous waste (98.4%); hazardous waste amounted to 115 thousand tonnes (1.6% of total imports). The largest quantity originated from Germany, at over 1.7 million tonnes (24.6% of total imports), consisting almost entirely of non-hazardous waste (hazardous waste amounted to only 7,129 tonnes), followed by France, with over 1 million tonnes (14.4% of the total). Waste imported from these countries was predominantly metallic.
The indicator provides information on the types of waste that are imported into the national territory, specifying the country of origin and the destination region.
Analyze which types of waste are imported for the purposes of recovery in production activities.
• Basel Convention of 22/03/1989 on the control of cross-border movements of hazardous waste and their disposal and subsequent amendments;
• OCSE C decision (2001) 107 on the control of cross-border movements of waste intended for recovery;
• Regulation 1013/2006/EC and S. M. I. Governing the shipment of waste between community member states, also through third countries;
• Regulation 1418/2007/EC and S. M. I. Relating to the export of some waste intended for the recovery, to some countries to which the OECD decision does not apply.
There are no objectives set by the legislation.
ISPRA - Rapporto Rifiuti Speciali 2026
ISPRA
ISPRA, MUD database, not accessible to the public
National, regional
2010-2024
Quantity of imported Waste from Economic Activities (tons)
The quantities of imported Waste from Economic Activities are analyzed for single EER Code, by country of origin and by destination region.
Waste from Economic Activities imported into Italy in 2024, amounting to over 7 million tonnes, consisted almost entirely of non-hazardous waste (98.4%), while hazardous waste amounted to 115 thousand tonnes (1.6% of total imports) (Table 1). Metallic waste accounted for 78.3% of total imports (5.5 million tonnes) and was recovered within the production cycles of the metallurgical industries, representing a positive contribution to resource efficiency by reducing the use of primary raw materials.
In 2024 the positive trend of past years is confirmed (+43,5% in 2010- 2024) (Table 1).
| Allegati |
|---|
Titolo
Table 1: Waste from Economic Activities imported into Italy Fonte
ISPRA |
Titolo
Table 2: Waste from Economic Activities imported by country of origin Fonte
ISPRA |
Titolo
Table 3: Waste imported by region of destination (2024) Fonte
ISPRA |
Thumbnail
Titolo
Figure 1: Waste from Economic Activities imported by country of origin (2024) Fonte
ISPRA |
Thumbnail
Titolo
Figure 2: Non-hazardous Waste from Economic Activities imported by European Waste Catalogue chapter, 2024 Fonte
ISPRA |
Thumbnail
Titolo
Figure 3: Hazardous Waste from Economic Activities imported by European Waste Catalogue chapter, 2024 Fonte
ISPRA |
Waste from Economic Activities imported into Italy in 2024 amounted to over 7 million tonnes. The largest quantity originated from Germany, at over 1.7 million tonnes, consisting almost entirely of non-hazardous waste (hazardous waste amounted to only 7,129 tonnes) and predominantly of metallic waste (Table 2 and Figure 1).
Lombardy was the region importing the largest quantity of waste, at 3.5 million tonnes (49.7% of the total), mainly consisting of metallic waste, in line with the region’s strong industrial base in sectors such as metallurgy and steelmaking (Table 3). This was followed by Friuli-Venezia Giulia and Veneto, accounting for 26.6% and 11.1% of total imports, respectively. These regions also imported almost exclusively metallic waste, which was recovered within production cycles.
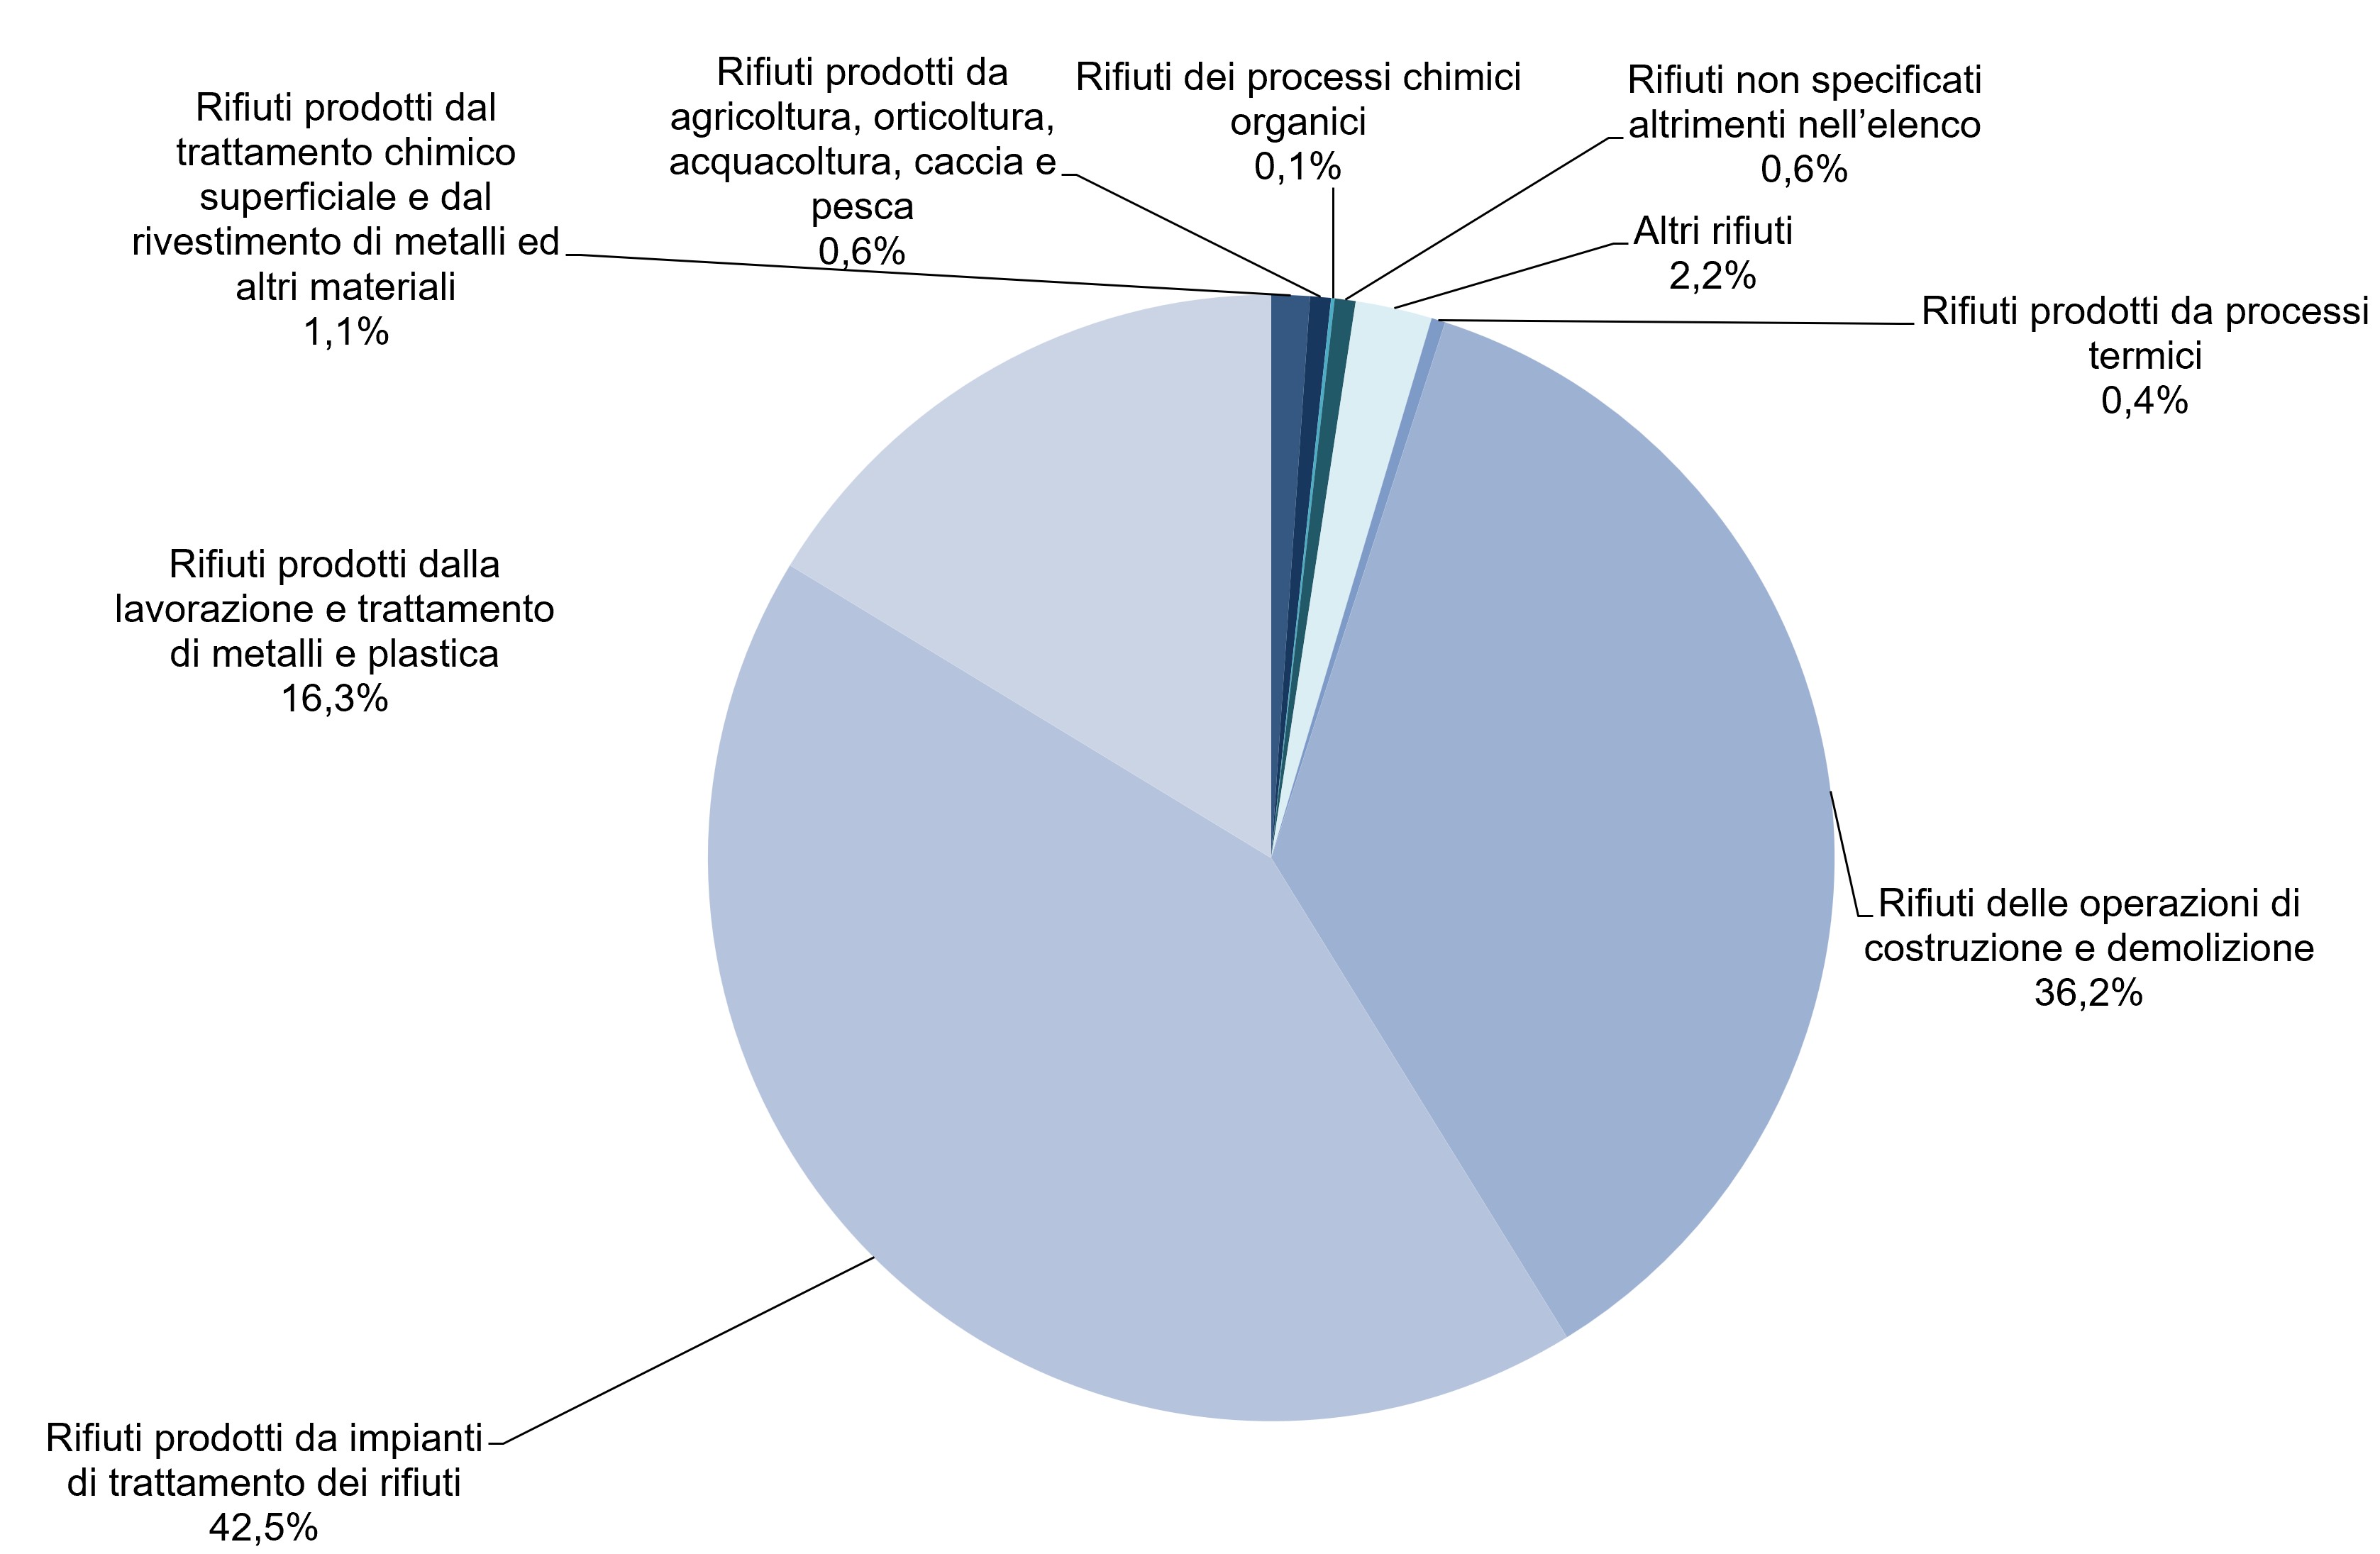
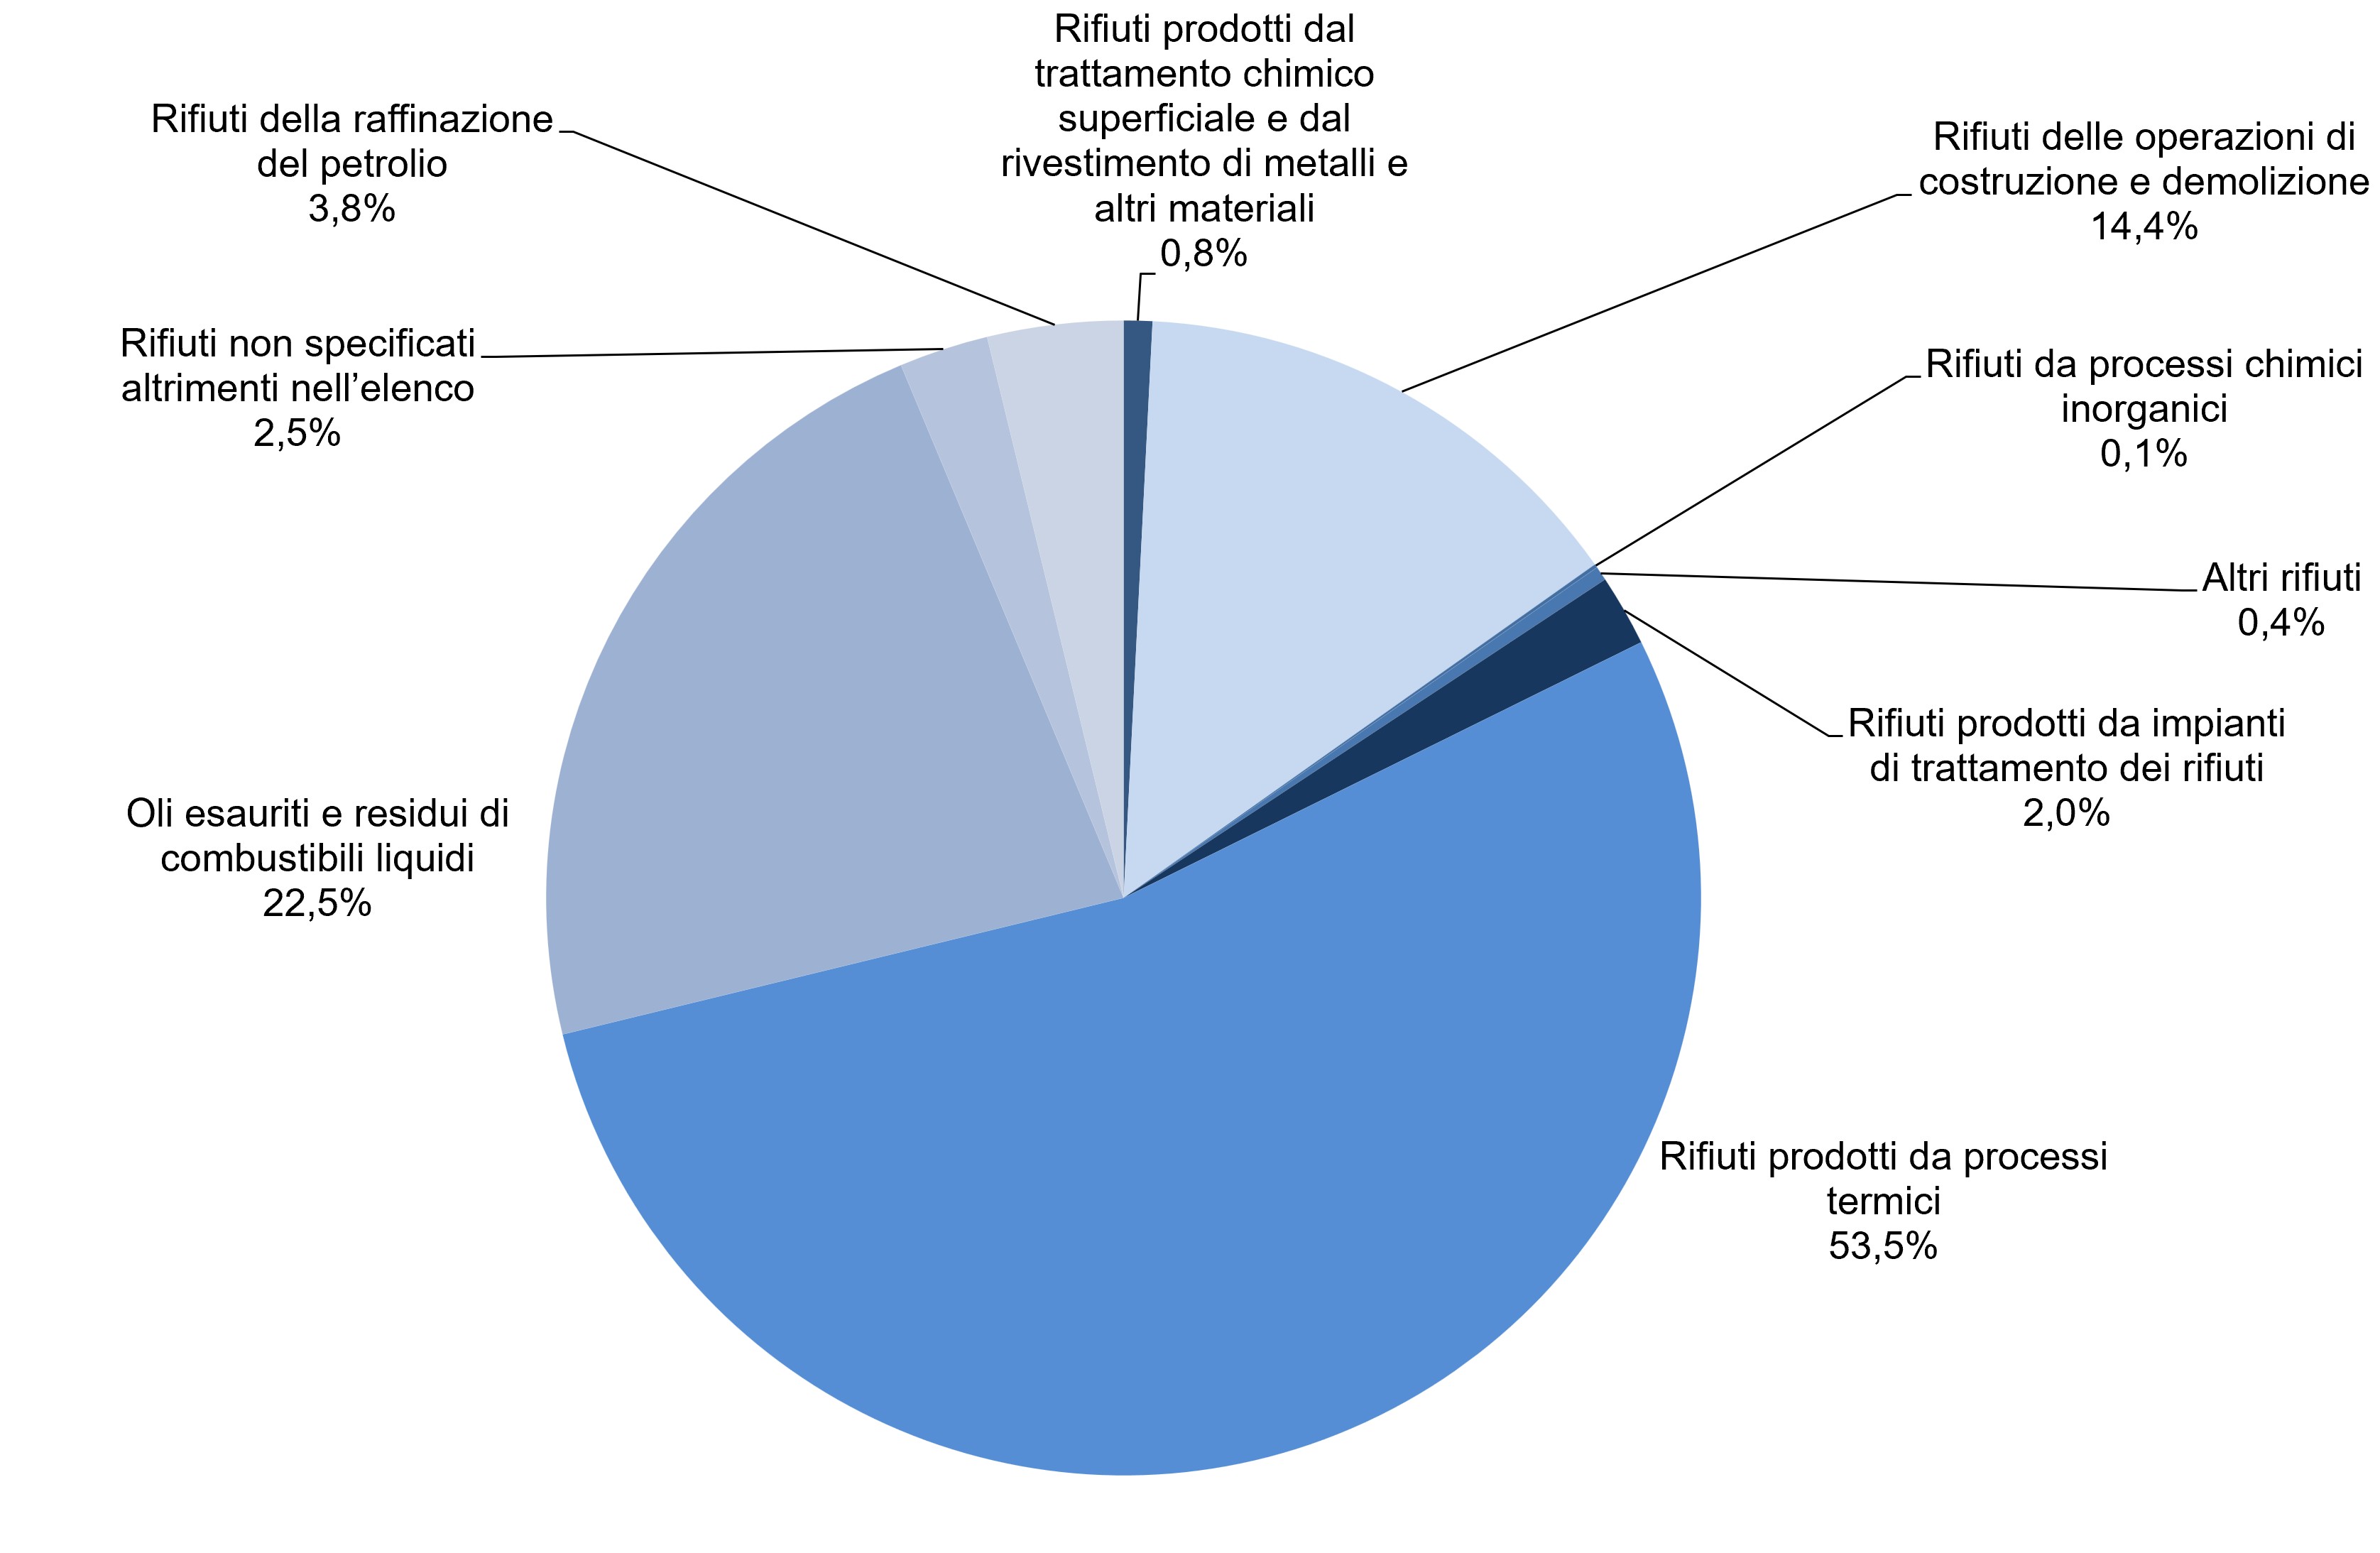
Construction and demolition waste accounted for 36.2% of total non-hazardous waste imports (approximately 2.5 million tonnes) (Figure 2). “Waste from waste management facilities” accounted for 42.5% of non-hazardous waste imports (2.9 million tonnes), with “ferrous metals”, “iron and steel”, and “non-ferrous metals” representing the largest fractions in quantitative terms. The substantial imports of ferrous scrap are further reflected in the high share of “waste from the shaping and physical and mechanical surface treatment of metals and plastics” (16.3%), consisting predominantly of metallic waste. With regard to hazardous Waste from Economic Activities, “waste from thermal processes” represented the largest imported category, accounting for 53.5% of the total (Figure 3).